Authors
Danielle Guedes Andrade Ezequiel1 Monica Barros Costa1 Alfredo Chaoubah1 Rogerio Baumgratz de Paula1
1Universidade Federal de
Juiz de Fora – UFJF.
Submitted on: 07/21/2011 Approved on: 09/22/2011
Correspondence to:
Danielle Guedes Andrade Ezequiel
Fundação IMEPEN Rua José Lourenço Kelmer, 1.300/SL – São Pedro Juiz de Fora – MG – Brazil Zip code 36036-330 E-mail: daniezequiel@ hotmail.com
This study was undertaken at Núcleo Interdisciplinar de Estudos e Pesquisas em Nefrologia – NIEPEN of UFJF.
The authors report no
R
ESUMOObjetivo: No presente artigo, investigou-se o impacto da redução do peso corporal na excreção urinária de albumina e na depu-ração da creatinina em indivíduos obesos com síndrome metabólica. Métodos: Trinta e cinco indivíduos foram submetidos à dieta hipocalórica por um período de 12 sema-nas, visando uma redução mínima de 5% do peso corporal. Os voluntários foram sub-metidos à avaliação metabólica (teste oral de tolerância à glicose, dosagens de lípides plasmáticos e ácido úrico) e à avaliação de parâmetros hemodinâmicos renais (depura-ção da creatinina e excre(depura-ção urinária de al-bumina), antes (fase 1) e após 12 semanas de dieta hipocalórica (fase 2). Resultados: Após o período de intervenção, os voluntários fo-ram divididos em dois grupos: indivíduos que atingiram o alvo para redução de peso (respondedores: R, n = 14) e pacientes que não atingiram a meta para redução de peso (não-respondedores: NR, n = 21). Indivíduos do Grupo R apresentaram melhora do per-fil lipídico, da redução da excreção urinária de albumina (mediana = 162.5 mg/24 ho-ras, variação: 0,8 a 292 mg/24 hoho-ras, na fase 1 para 10,4 mg/24 horas, variação: 1,6 a 22,4 mg/24 horas, na fase 2), além de redução significante da depuração da creatinina (121,4 ± 66,5 mL/min. para 92,9 ± 35,6 mL/min., p = 0,001). No Grupo NR, não foram observadas diferenças esta-tisticamente significantes entre as fases 1 e 2 do estudo. Conclusão: A redução do peso corporal teve impacto positivo na hemodi-nâmica renal, reduzindo a excreção uriná-ria de albumina e a hiperfiltração glome-rular em indivíduos obesos com síndrome metabólica.
Palavras-chave: Obesidade. Síndrome X Metabólica. Albuminúria. Falência Renal Crônica.
A
BSTRACTObjective: We investigated the impact of weight loss on urinary albumin ex-cretion (UAE) and creatinine clearan-ce in obese patients with metabolic syndrome. Methods: Thirty-five obese patients undertook a 12-week calorie-restricted diet. The patients underwent a metabolic (oral glucose tolerance test, plasma lipids, and uric acid) and renal hemodynamic evaluations (creatinine clearance and urinary albumin excre-tion) before (phase 1), and after the 12-week diet (phase 2). Results: After the dietary intervention, the subjects were divided into two groups: patients who achieved the target weight reduction (R: responders, n = 14), and patients who did not (NR: non-responders, n = 21). The patients in Group R showed an im-provement in lipid profile, a decrease in UAE (median = 162.5 mg/24 hours, range: 0.8 to 292 mg/24 hours, at pha-se 1 versus 10.4 mg/24 hours, range: 1.6 to 22.4 mg/24 hours, at phase 2), and a significant reduction in creatini-ne clearance (121.4 ± 66.5 mL/min. in phase 1 to 92.9 ± 35.6 mL/min. at the end of phase 2, p = 0.001). In Group NR, no statistically significant differen-ces were observed between phases 1 and 2. Conclusion: Body weight reduction has a positive impact on renal hemo-dynamics, decreasing urinary albumin excretion as well as glomerular hyperfil-tration in obese patients with metabolic syndrome.
Keywords: Obesity. Metabolic Syndrome X. Albuminuria. Kidney Failure, Chronic.
Efeito da perda de peso sobre a hemodinâmica renal em
portadores da síndrome metabólica
I
NTRODUCTIONMetabolic syndrome (MS) is a clustering of risk factors for cardiovascular diseases (CVD), such as: hypertension, hypertriglyceridemia, low HDL-cholesterol levels, disorders of glucose metabolism, and insulin resistance. A number of associated con-ditions are included in the MS spectrum, such as: ab-dominal obesity, systemic inflammatory activation, endothelial dysfunction, non-alcoholic fatty liver di-sease, hyperuricemia, polycystic ovarian syndrome, and microalbuminuria.1,2
Consequently, the diagnosis of MS identifies pa-tients who are at increased risk for type 2 diabetes mellitus and CVD.3-5 In the last few years, the poten-tial for MS to trigger renal damage and accelerate the progression of pre-existing nephropathy has become a focus of research.6-8 In a study of 202 incident di-alysis patients, Young et al. reported a MS prevalence of nearly 70% at the initiation of renal replacement therapy and found that MS was particularly preva-lent among patients who were diabetic, female, and white-colored.9 Several other epidemiological studies have demonstrated a positive correlation between MS and microalbuminuria.7,8,10 Chen et al. reported an as-sociation between the number of MS components and the development of chronic kidney disease (CKD) in a study of 6,217 individuals. However, a cause-effect relationship between MS and CKD could not be estab-lished, due to the cross-sectional design of the study.11 These findings were further confirmed in a large pro-spective study, which found a positive correlation between the prevalence of CKD and the number of MS components.8 Overall, these studies suggest that MS can influence the development of CKD, although the underlying mechanisms are not well understood. In this study, we hypothesized that modifying a key component of the MS, namely obesity, could attenu-ate renal damage.
The aim of this study was to investigate the impact of weight loss on creatinine clearance and urinary al-bumin excretion (UAE) in non-diabetic obese patients with MS.
M
ETHODSPATIENTS
Non-diabetic patients with MS were recruited from an outpatient clinic at the Division of Nephrology of the Federal University of Juiz de Fora, in Brazil. MS was defined according to the criteria of the National Cholesterol Education Program Adult Treatment
Panel III (NCEP-ATPIII).12 The main exclusion cri-teria were: fasting plasma glucose > 126 mg/dL or history of diabetes mellitus; hypertension stage 2 or 3; glomerulonephritis; CKD stages 3, 4, or 5; severe heart or lung disease, and pregnancy. Fifty-five pa-tients were evaluated, and 35 individuals, aged be-tween 20 and 65 years-old, were considered eligible for inclusion. The study protocol was revised and approved by the Human Subjects Review Committee of the Federal University of Juiz de Fora (approval number 273/2006). All subjects provided the written informed consent.
METHODS
The study was divided into two phases: 1 (baseline) and 2 (intervention).
PHASE 1 (WEEKS 1 TO 4)
At the first study visit (day 0), a full medical history (demographic data and lifestyle: smoking, alcohol consumption, and physical activity) was taken and a clinical examination was performed. Blood pressure measurement had been performed with the patient se-ated quietly for at least five minutes with feet on the floor, and his/her arm supported at the heart level. An aneroid equipment coupled with an appropriately si-zed cuff (cuff bladder encircling at least 80% of the arm) was used to ensure accuracy. The mean of the last two of three measurements was used for analysis. Blood samples were taken to determine plasma glu-cose levels, both after fasting and two hours after a 75-g oral glucose overload (oral glucose tolerance test – OGTT), as well as levels of plasma insulin, TSH, cre-atinine, total cholesterol, HDL-cholesterol, triglyceri-des, and uric acid. All patients had fasted overnight for 12 hours prior to sampling. A colorimetric method was used to measure plasma glucose, serum creatinine, to-tal cholesterol, HDL-cholesterol, triglycerides, and uric acid levels. The insulin concentration was measured in duplicate by a chemiluminescence assay (Beckman Coulter, N. Harbor, USA). The Friedewald formula was used to calculate LDL-cholesterol levels. HOMA index (HOMA-IR) was calculated using the formula HOMA-IR = glucose (mmoL/L) × insulin (U/mL) / 22.5.13
area.14 The subjects were kept free of any medica-tion (statins; antihypertensive, antiobesity and anti-inflammatory drugs) over the entire study period. The only medications allowed during the study were anal-gesics, such as dipyrone and hioscin.
At visit 3 (day 28), each patient was evaluated by a registered dietitian with expertise in medical nutri-tion therapy with the aim of achieving a weight loss of at least 5% from baseline and a 12-week calorie-restricted diet consisting of 50% carbohydrate, 20 to 25% protein, and 25 to 30% fat was initiated.
PHASE 2 (WEEKS 5 TO 16)
Patients were evaluated by the dietitian every two we-eks. All the participants were asked not to join any kind of fitness program throughout the study. At the final visit all laboratory tests were repeated. At the end of phase 2, patients were divided into two groups: responders, who had achieved at least a 5% reduction in body weight (Group R, n = 14); and non-respon-ders, who had not achieved the target weight reduc-tion (Group NR, n = 21).
STATISTICAL ANALYSIS
The SPS, version 13.0, software package (SPSS, Chicago, IL, USA) was used to perform the statistical analyses. Normally distributed data were expressed as means and standard deviations (SD). Paired and unpaired Student’s t-tests were used to compare vari-ables within and between the two groups (R and NR), respectively. Data with a skewed distribution were ex-pressed as medians (ranges) and they were compared using the Mann-Whitney’s test. Results were consid-ered significant when p was less than 0.05.
R
ESULTSThirty-five patients were included in the study. The mean age was 43.0 ± 11.4 years-old and 30 of the
patients (86%) were female. The median duration of obesity was 10.0 years-old (range, 1 to 40) and of hypertension was 2.0 years-old (range, 0.1 to 20). The body mass index (BMI) was 35.0 ± 5.5 kg/m2. All of the patients had waist circumference above the cut-off point (mean: 111.6 ± 11.0 cm). Twenty-three patients (66%) had mild hypertension with a systolic blood pressure (SBP) of 139.3 ± 15.3 mmHg, and a diastolic blood pressure (DBP) of 90.1 ± 9.0 mmHg. Total cholesterol and HDL-cholesterol means were 201.2 ± 40.6 mg/dL and 42.0 ± 9.7 mg/dL, respec-tively. Triglyceride levels were 196.3 ± 88.5 mg/dL, and most patients (80%) had levels above the cut-off. Fasting plasma glucose levels were 92.3 ± 11.0 mg/dL; a two-hour post-glucose load values were 117.1 ± 32.2 mg/dL, and 16 patients (46%) had impaired glucose tolerance. Median HOMA-IR was 2.8 (range, 0.45 to 11.4) and 19 patients (54%) had values above 2.5. Creatinine clearance was 115.3 ± 38.6 mL/24 hours. Microalbuminuria, defi-ned as a UAE of > 30 mg/24 hours, was detected in 22 patients (63%), with a median level of 46.7 mg/dL (range, 1.5 to 292).
DEMOGRAPHICAND CLINICALFEATURESOF RESPONDERSAND NON-RESPONDERS
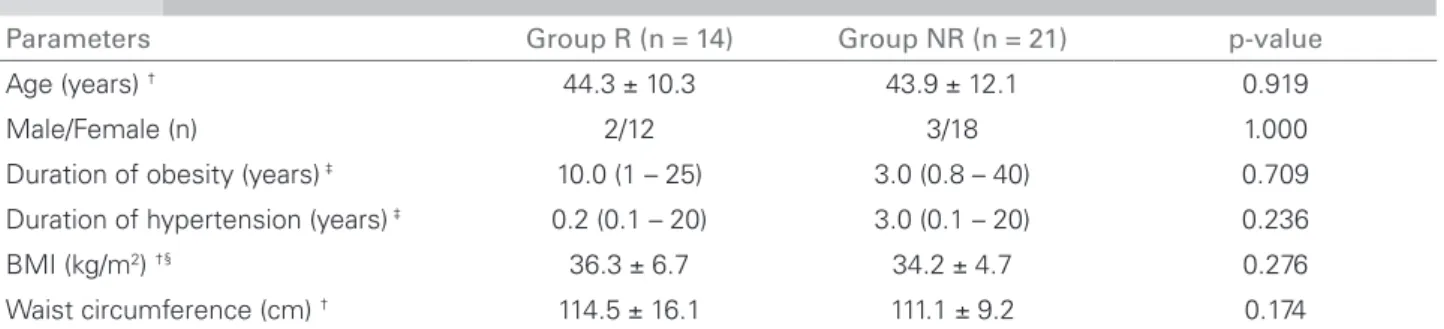
No significant differences were observed between Group R and Group NR in age, gender, BMI, waist circumference, or duration of obesity or hyperten-sion (Table 1).
At the end of phase 2,40% of the patients (14/35) had achieved the target weight loss and were assigned to Group R. The mean weight reduction in Group R was 8.5 ± 2.2 kg (9.4% from baseline) and abdomi-nal circumference decreased from 114.5 ± 16.1 cm to 103.6 ± 10.2 cm (p = 0.001). In Group NR, pa-tients gained 1.0 ± 3.5 kg, and there was no sig-nificant changes in the abdominal circumference (111.1 ± 9.2 cm versus 109.3 ± 10.3 cm, p = 0.304).
Tabela 1 DEMOGRAPHICANDCLINICALFEATURESOFRESPONDERS (GROUP R) ANDNON-RESPONDERS (GROUP NR)
Parameters Group R (n = 14) Group NR (n = 21) p-value
Age (years) † 44.3 ± 10.3 43.9 ± 12.1 0.919
Male/Female (n) 2/12 3/18 1.000
Duration of obesity (years) ‡ 10.0 (1 – 25) 3.0 (0.8 – 40) 0.709
Duration of hypertension (years) ‡ 0.2 (0.1 – 20) 3.0 (0.1 – 20) 0.236
BMI (kg/m2) †§ 36.3 ± 6.7 34.2 ± 4.7 0.276
Waist circumference (cm) † 114.5 ± 16.1 111.1 ± 9.2 0.174
Following weight loss, Group R patients showed a statistically significant decrease in DBP, from 90.0 ± 7.5 mmHg to 78.2 ± 8.2 mmHg (p = 0.007), and a trend towards a reduction in SBP, from 135.0 ± 18.7 mmHg to 123.6 ± 7.4 mmHg (p = 0.059). Although Group NR patients failed to lose weight, SBP decreased from 140.1 ± 13.4 mmHg to 129.8 ± 9.8 mmHg following nu-tritional intervention (p = 0.010), and a non-significant reduction in DBP was observed (90.0 ± 10.2 mmHg to 85.9 ± 7.3 mmHg; p = 0.143).
METABOLICPARAMETERSINRESPONDERSAND NON-RESPONDERS
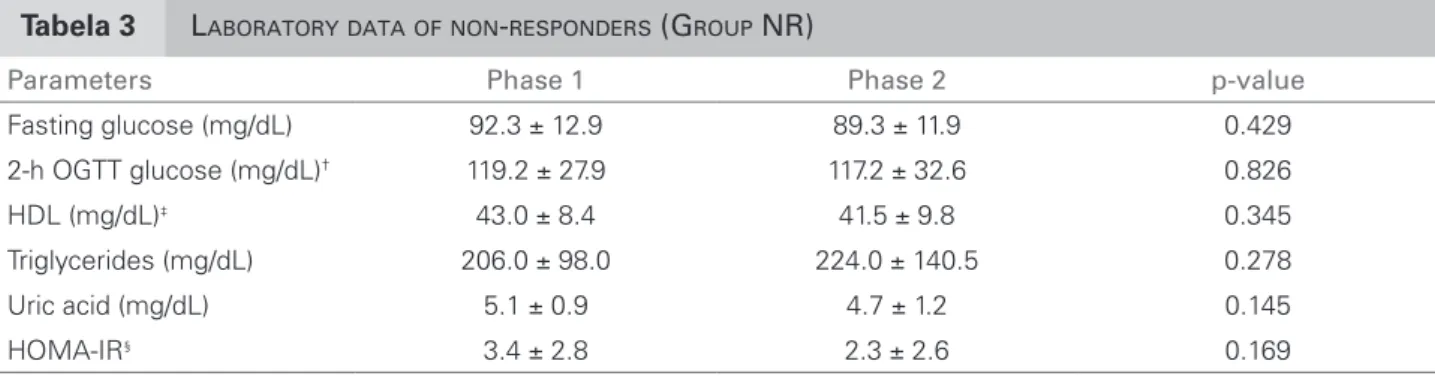
No significant differences in fasting plasma glucose and two-hour OGTT glucose levels were observed between Groups R and NR in phase 1 or after phase 2. At the end of phase 2, a trend towards a decrease in HOMA-IR was observed in Group R (3.0 ± 2.1 at phase 1 to 1.6 ± 0.66 at the end of phase 2), with p = 0.057. In Group R, a statistically significant decrease in tri-glyceride levels (p = 0.031) and an increase in HDL-cholesterol (p = 0.039) were observed. Uric acid levels showed a trend towards a reduction (p = 0.057), as seen in Table 2. For Group NR, no changes in these metabolic parameters were observed from phase 1 to 2 (Table 3). Taken together, these results indicate that there was an improvement in the metabolic status of patients in Group R but not in Group NR.
RENAL HEMODYNAMICPARAMETERSINRESPONDERS AND NON-RESPONDERS
On one hand, in Group R, UAE decreased sig-nificantly from 162.5 (range, 0.8 to 292.0) to 10.4 mg/24 hours (range, 1.6 to 22.4) following weight loss (p = 0.010). Most patients in this group (10/14) showed a significant decrease in UAE. On the other hand, no change in UAE was observed in Group NR between phase 1 and the end of phase 2 (Figure 1). When microalbuminuria values were com-pared as categorical data, with normoalbuminuria defined as < 30 mg/24 hours and microalbuminuria
Tabela 2 LABORATORYDATAOFRESPONDERS (GROUP R)
Parameters Phase 1 Phase 2 p-value
Fasting glucose (mg/dL) 92.8 ± 10.9 92.6 ± 13.3 0.976
2-h OGTT glucose (mg/dL)† 114.1 ± 35.8 112.1 ± 33.9 0.866
HDL (mg/dL)‡ 42.8 ± 11.7 51.8 ± 10.7 0.039
Triglycerides (mg/dL) 188.6 ± 79.4 141.9 ± 77.9 0.031
Uric acid (mg/dL) 4.9 ± 1.2 4.1 ± 1.1 0.057
HOMA-IR§ 3.0 ± 2.1 1.6 ± 0.7 0.057
†OGTT: oral glucose tolerance test; §HOMA-IR: homeostatic model assessment of insulin resistance; ‡HDL: high-density lipoprotein.
Tabela 3 LABORATORYDATAOFNON-RESPONDERS (GROUP NR)
Parameters Phase 1 Phase 2 p-value
Fasting glucose (mg/dL) 92.3 ± 12.9 89.3 ± 11.9 0.429
2-h OGTT glucose (mg/dL)† 119.2 ± 27.9 117.2 ± 32.6 0.826
HDL (mg/dL)‡ 43.0 ± 8.4 41.5 ± 9.8 0.345
Triglycerides (mg/dL) 206.0 ± 98.0 224.0 ± 140.5 0.278
Uric acid (mg/dL) 5.1 ± 0.9 4.7 ± 1.2 0.145
HOMA-IR§ 3.4 ± 2.8 2.3 ± 2.6 0.169
†OGTT: oral glucose tolerance test; §HOMA-IR: homeostatic model assessment of insulin resistance; ‡HDL: high-density lipoprotein.
Figure 1. Urinary albumin excretion in R and NR Groups, before and after the dietary intervention (phases 1 and 2).
162.5 (0.8 – 292)
*
10.4 (1.6 – 22.4)
R Group 0
20 40 60 80 100 120 140 160 180
NR Group 174 (0.3 – 293)
ns
96.7 (0.8 – 293)
Phase 1 Phase 2
Urinar
y albumin e
x
cretion (mg/24h)
Phase 1 Phase 2
defined as > 30 mg/24 hours, results showed that following nutritional intervention, microalbuminu-ria decreased to the normal range in 9/14 (64%) of the patients in Group R compared to only 14% (3/21) in the NR Group (p = 0.011).
As can be seen in Figure 2, creatinine clearance de-creased significantly from 121.4 ± 66.5 mL/minutes in phase 1 to 92.9 ± 35.6 mL/minutes at the end of phase 2 (p = 0.001). Conversely, in the NR Group, no sig-nificant differences in this parameter were observed in phase 1 compared to phase 2 (102.2 ± 29.9 mL/minutes versus 97.5 ± 31.8 mL/minutes, respectively), as seen in Figure 2.
D
ISCUSSIONThe worldwide epidemic of obesity-associated MS is a potential risk for cardiovascular morbidity and mor-tality. In addition, there is emerging evidence that obe-sity is a major risk factor for kidney damage indepen-dent of diabetes or hypertension. Cross-sectional9-11 and longitudinal studies7,8 have both demonstrated a relationship between components of the MS and risk of developing kidney injury, further suggesting a link between obesity and CKD.
The obese subjects included in the present study had glomerular hyperfiltration and increased urinary albumin excretion, abnormal renal hemodynamics that could potentially lead to kidney damage over the long term. The main finding in the present study is that a slight reduction in body weight ameliorated glomerular hyperfiltration and decreased urinary al-bumin excretion.
To the authors’ knowledge, no studies have ad-dressed non-pharmacological interventions as the sole strategy for nephroprotection in patients with mild obesity, without evidence of significant kidney dam-age. Most studies have focused on patients with severe
obesity, diabetes, and proteinuric nephropathies. For example, weight loss due to gastroplasty was effective in reducing the glomerular filtration rate (GFR) and al-bumin excretion in patients with BMI above 38 kg/m2.15 Similar results have been reported by the present group and by others in morbidly obese patients who underwent bariatric surgery.16-20 In obese patients with overt protei-nuria, Morales et al. found that caloric restriction led to a 31.2 ± 37.0% reduction in the UAE despite achieving only a modest decrease in body weight.21 In the present study, we have shown for the first time an improvement in renal hemodynamics in mildly obese patients, with microalbuminuria submitted to a calorie-restricted diet as the sole strategy to lose weight.
The study was not designed to explore mecha-nisms of obesity-induced kidney damage, but we speculate that hemodynamic changes could play a role in glomerular damage associated with obesity. Previous studies in animal models have shown that, even in the short-term, obesity causes a renal hemo-dynamic overload with glomerular hyperfiltration, and microalbuminuria. Dogs fed with a high fat diet for five weeks, obesity induced a 30% increase in the glomerular filtration rate.22 This change was associ-ated with an increase in renal blood flow and renal tu-bular sodium reabsorption, with a secondary increase in renin secretion, which was mediated by stimulation of the macula densa. Glomerulomegaly and increased TGFβ1 expression in the renal interstitium were ob-served in this model, both of which could explain the early renal damage in obesity.23
We speculated that the reduction in blood pres-sure observed in the current study may have contrib-uted to the decrease in urinary albumin excretion. Hypertension is a hallmark feature of MS and is asso-ciated with increased urinary albumin excretion.24 In the present study, a 9.4% decrease in the body weight was associated with a significant reduction in DBP and with a trend towards reduction in SBP. However, it should be noted that the significant reduction in SBP, which also occurred in the NR Group, argues against our hypothesis.
Metabolic mediators may also have contributed to glomerular hyperfiltration in the present study. The relationship between insulin resistance and renal damage in MS deserves attention. Insulin resistance and, consequently, hyperinsulinemia are known to play important roles in the development of athero-sclerosis in MS patients, independent of the diagnosis of diabetes.25 In an experimental study with Rhesus monkeys, mesangial expansion and increased glomer-ular volume were observed prior to the development
0 30 60 90 120 150
121.4 ± 66.5
* ns
Phase 1 Phase 2 92.9 ± 35.6
102.2 ± 29.9 97.5 ± 31.8
NR Group
Creatinine clearence mL/min
R Group
*p < 0.001
of hyperglycemia, which is a finding compatible with the trophic effect of insulin in the mesangial cells.26 Similarly, in 12 obese patients with metabolic syn-drome, glomerular lesions, such as vascular sclero-sis, tubular atrophy, and interstitial fibrosclero-sis, could be detected prior to the diagnosis of diabetes mellitus.27 In the present study, most of the patients had a high HOMA-IR, which decreased after weight loss, sug-gesting the presence of insulin resistance. In addition, a significant improvement was found in the metabolic profile after weight loss, with a reduction in triglycer-ide levels and an increase in HDL-cholesterol. In fact, the triglyceride-HDL ratio is a sensitive indicator of insulin resistance in non-diabetic obese patients,28 and it deserves further investigation.
The current study had some limitations, particu-larly in the small number of subjects enrolled and its non-randomized design. However, it was ethically mandatory to offer nutritional counseling to all the patient population, which prevented us from under-taking a randomized study. These shortcomings were compensated by the study’s prospective design and the careful supervision of the dieticians who moni-tored subject compliance throughout the protocol.
In conclusion, MS subjects have subtle changes in renal hemodynamics that were ameliorated by weight loss. Considering that glomerular hyperfiltration and microalbuminuria in the setting of obesity are risk factors for the development of CKD, this intervention seems to be of remarkable benefit. Long-term studies, which include a larger number of study participants, may lead to the adoption of this strategy for the pre-vention of kidney damage in obese patients.
A
CKNOWLEDGMENTSThis research was supported by Coordenação de Aperfeiçoamento de Pessoal de Nível Superior (CAPES) and the IMEPEN Foundation.
R
EFERENCES1. Reaven GM. Banting lecture 1988. Role of insulin resistance in human disease. Diabetes 1988;37:1595-607.
2. Alberti KG, Zimmet P, Shaw J. Metabolic syndrome-a new world-wide definition. A consensus statement from the International Diabetes Federation. Diabet Med 2006;23:469-80.
3. Mottillo S, Filion KB, Genest J, et al. The metabolic syndrome and cardiovascular risk. A systematic review and meta-analysis. J Am Coll Cardiol 2010;56:1113-32.
4. Alexander CM, Landsman PB, Teutsch SM, Haffner SM. NCEP-defined metabolic syndrome, diabetes, and
prevalence of coronary heart disease among NHANES III participants age 50 years and older. Diabetes 2003;52:1210-4.
5. Ford SE, Li C, Sattar N. Metabolic Syndrome and Incident Diabetes. Diabetes Care 2008;31:1898-904. 6. Bonnet F, Deprele C, Sassolas A, et al. Excessive body
weight as a new independent risk factor for clinical and pathological progression in primary IgA nephritis. Am J Kidney Dis 2001;37:720-7.
7. Kurella M, Lo JC, Chertow GM. Metabolic syndrome and the risk for chronic kidney disease among nondiabetic adults. J Am Soc Nephrol 2005;16:2134-40.
8. Tanaka H, Shiohira Y, Uezu Y, Higa A, Iseki K. Metabolic syndrome and chronic kidney disease in Okinawa, Japan. Kidney Int 2006;69:369-74.
9. Young DO, Lund RJ, Haynatzki G, Dunlay RW. Prevalence of the metabolic syndrome in an incident dialysis population. Hemodial Int 2007;11:86-95. 10. Hoehner CM, Greenlund KJ, Rith-Najarian S, Casper
ML, McClellan WM. Association of the insulin resistance syndrome and microalbuminuria among nondiabetic Native Americans. The Inter-Tribal Heart Project. J Am Soc Nephrol 2002;13:1626-34.
11. Chen J, Muntner P, Hamm LL, et al. The metabolic syndrome and chronic kidney disease in U.S. adults. Ann Intern Med 2004;140:167-74.
12. National Cholesterol Education Program (NCEP). Expert Panel on Detection, Evaluation, and Treatment of High Blood Cholesterol in Adults (Adult Treatment Panel III): Third Report of the National Cholesterol Education Program (NCEP) Expert Panel on Detection, Evaluation, and Treatment of High Blood Cholesterol in Adults (Adult Treatment Panel III) final report. Circulation 2002;106:3143-421.
13. Matthews DR, Hosker JP, Rudenski AS, Naylor BA, Treacher DF, Turner RC. Homeostasis model assessment: Insulin resistance and beta-cell function from fasting plasma glucose and insulin concentrations in man. Diabetologia 1985;28:412-9.
14. Saracino A, Morrone LF, Suriano V, et al. A simple method for correcting overestimated glomerular filtration rate in obese subjects evaluated by the Cockcroft and Gault formula: A comparison with 51Cr
EDTA clearance. Clin Nephrol 2004;62:97-103. 15. Chagnac A, Weinstein T, Herman M, Hirsh J, Gafter U, Ori
Y. The effects of weight loss on renal function in patients with severe obesity. J Am Soc Nephrol 2003;14:1480-6. 16. Galil Filho JE, Diniz FD, Paula RB, Galil AGS.
Repercussões da perda ponderal sobre parâmetros metabólicos e renais: seguimento de 12 meses pós-cirurgia bariátrica. J Bras Nefrol 2008;30:189.
17. Agrawal V, Khan I, Rai B, et al. The effect of weight loss after bariatric surgery on albuminuria. Clin Nephrol 2008;70:194-202.
18. Navarro-Diaz M, Serra A, Romero R, et al. Effect of drastic weight loss after bariatric surgery on renal parameters in extremely obese patients: long-term follow-up. J Am Soc Nephrol 2006;17(Suppl):213-7. 19. Navaneethan SD, Yehnert H, Moustarah F, Schreiber
20. Afshinnia F, Wilt TJ, Duval S, Esmaeili A, Ibrahim HN. Weight loss and proteinuria: systematic review of clinical trials and comparative cohorts. Nephrol Dial Transplant 2010;25:1173-83.
21. Morales E, Valero MA, Leon M, Hernández E, Praga M. Beneficial effects of weight loss in overweight patients with chronic proteinuric nephropathies. Am J Kidney Dis 2003;41:319-27.
22. de Paula RB, da Silva AA, Hall JE. Aldosterone antagonism attenuates obesity-induced hypertension and glomerular hyperfiltration. Hypertension 2004;43:41-7. 23. Henegar JR, Bigler SA, Henegar LK, Tyagi SC, Hall JE.
Functional and structural changes in the kidney in the early stages of obesity. J Am Soc Nephrol 2001;12:1211-7. 24. Mulè G, Nardi E, Cottone S, et al. Influence of metabolic
syndrome on hypertension-related target organ damage. J Intern Med 2005;257:503-13.
25. Mykkanen L, Zaccaro DJ, Wagenknecht LE, Robbins DC, Gabriel M, Haffner SM. Microalbuminuria is associated with insulin resistance in nondiabetic subjects: the insulin resistance atherosclerosis study. Diabetes 1998;47:793-800.
26. Cusumano AM, Bodkin NL, Hansen BC, et al. Glomerular hypertrophy is associated with hyperinsulinemia and precedes overt diabetes in aging Rhesus monkeys. Am J Kidney Dis 2002;40:1075-85.
27. Alexander MP, Patel TV, Farag YM, Florez A, Rennke HG, Singh AK. Kidney pathological changes in metabolic syndrome: a cross-sectional study. Am J Kidney Dis 2009;53:751-9.