Association between Self-Reported Smoking
and Hemoglobin A1c in a Korean Population
without Diabetes: The 2011
–
2012 Korean
National Health and Nutrition Examination
Survey
Jae Won Hong1, Cheol Ryong Ku2, Jung Hyun Noh1, Kyung Soo Ko3, Byoung Doo Rhee3, Dong-Jun Kim1*
1Department of Internal Medicine, Ilsan-Paik Hospital, College of Medicine, Inje University, Koyang, Gyeonggi-do, South Korea,2Endocrinology, Yonsei University College of Medicine, Seoul, South Korea,
3Department of Internal Medicine, Sanggye Paik Hospital, Cardiovascular and Metabolic Disease Center, College of Medicine, Inje University, Seoul, Republic of Korea
*djkim@paik.ac.kr
Abstract
Background
Several Western studies have revealed that among non-diabetics, glycosylated hemoglobin A1c (HbA1c) levels are higher in smokers than non-smokers. While studies conducted in Western populations consistently support this association, a recent meta-analysis reported that studies carried out in non-Western populations, including studies of Chinese, Egyptian, and Japanese-Americans, did not detect any significant differences in HbA1c levels be-tween smokers and non-smokers.
Objectives
We assessed the association between smoking habits and HbA1c levels in the general Ko-rean adult population using data from the KoKo-rean National Health and Nutrition Examination Survey (KNHANES) performed in 2011–2012.
Methods
A total of 10,241 participants (weighted n=33,946,561 including 16,769,320 men and 17,177,241 women) without diabetes were divided into four categories according to their smoking habits: never smokers (unweightedn/weightedn= 6,349/19,105,564), ex-smokers (unweightedn/weightedn= 1,912/6,207,144), current light smokers (<15 cigarettes per day, unweightedn/weightedn=1,205/5,130,073), and current heavy smokers (15 cigarettes per day, unweightedn/weightedn=775/3,503,781).
a11111
OPEN ACCESS
Citation:Hong JW, Ku CR, Noh JH, Ko KS, Rhee BD, Kim D-J (2015) Association between Self-Reported Smoking and Hemoglobin A1c in a Korean Population without Diabetes: The 2011–2012 Korean National Health and Nutrition Examination Survey. PLoS ONE 10(5): e0126746. doi:10.1371/journal. pone.0126746
Academic Editor:Barbara Fuhrman, University of Arkansas for Medical Sciences, UNITED STATES
Received:May 7, 2014
Accepted:April 7, 2015
Published:May 26, 2015
Copyright:© 2015 Hong et al. This is an open access article distributed under the terms of the
Creative Commons Attribution License, which permits
unrestricted use, distribution, and reproduction in any medium, provided the original author and source are credited.
Data Availability Statement:The raw data are owned by Korea Centers for Disease Control and Preservation. Anybody who signs up for membership can get raw data from the webpage of Korea Centers for Disease Control & Preservation(https://knhanes.
cdc.go.kr/knhanes/index.do).
Funding:The authors have no support or funding to report.
Results
In age- and gender-adjusted comparisons, the HbA1c levels of each group were 5.52±
0.01% in non-smokers, 5.49±0.01% in ex-smokers, 5.53±0.01% in light smokers, and 5.61±0.02% in heavy smokers. HbA1c levels were significantly higher in light smokers
than in ex-smokers (p= 0.033), and in heavy smokers compared with light smokers (p<
0.001). The significant differences remained after adjusting for age, gender, fasting plasma glucose, heavy alcohol drinking, hematocrit, college graduation, and waist circumference. Linear regression analyses for HbA1c using the above-mentioned variables as covariates revealed that a significant association between current smoking and HbA1c (coefficient 0.021, 95% CI 0.003–0.039,p= 0.019).
Conclusions
Current smoking was independently associated with higher HbA1c levels in a cigarette ex-posure-dependent manner in a representative population of Korean non-diabetic adults. In this study, we have observed an association between smoking status and HbA1c levels in non-diabetics drawn from a non-Western population, consistent with previous findings in Western populations.
Introduction
Glycosylated hemoglobin A1c (HbA1c) is a marker for long-term glucose control and provides an index of overall glycemic exposure and risk for long-term complications in patients with di-abetes. It is used to guide management and adjust treatments for diabetic individuals. In addi-tion to monitoring glycemic control, HbA1c is also used to diagnose diabetes and identify individuals at high risk of developing diabetes [1]. However, HbA1c levels can be influenced by various factors including age, ethnicity, conditions that alter red cell turnover, socioeconomic factors, and glucose homeostasis [1–6].
Cigarette smoking is a major public health problem and a well-known risk factor for cardio-vascular disease and several malignancies. Many studies have shown that cigarette smoking is also associated with an increased risk of diabetes and insulin resistance [7–11]. Furthermore, several studies have reported that current smokers exhibit higher HbA1c levels than non-smokers, even in populations without diabetes [9,12–16].
Recently, Sorayaet al. analyzed the difference in mean HbA1c levels between current smok-ers and never-smoksmok-ers. Their meta-analysis included individuals from 14 countries and sug-gested that HbA1c levels are higher in smokers than in non-smokers without known diabetes. [17] Therein, higher HbA1c levels in current smokers were consitently reported in 10 out of 14 Western population studies, including those from Australia, France, the United States, the Netherlands, and Denmark. However, in Chinese, Egyptian, Kenyan and Japanese-American populations, differences in HbA1c levels were not detected; current smokers even showed lower HbA1c levels. Therefore, race/ethnicity, or western lifestyle may modify the association between smoking and HbA1c levels. Nevertheless, few studies have investigated the association between smoking status and HbA1c levels in large study samples, particularly in non-Western populations.
Method
Study population and data collection
This study used data from the 2011–2012 Korea National Health and Nutrition Examination Survey (KNHANES), a cross-sectional and nationally representative survey conducted by the Korean Center for Disease Control for Health Statistics. The KNHANES has been performed periodically since 1998 to assess the health and nutritional status of the civilian, non-institu-tionalized Korean population. Participants were selected using proportional allocation system-atic sampling with multistage stratification. A standardized interview was conducted in the homes of the participants to collect information regarding demographic variables, family histo-ry, medical histohisto-ry, medications used, and a variety of other health-related variables. The health interview included well-established questions to determine the demographic and socio-economic characteristics of the subjects, including questions concerning age, education level, occupation, income, marital status, smoking habits, alcohol consumption, exercise, previous and current diseases, and family disease history. Smoking status was divided into four catego-ries: never smoker, ex-smoker, current light smoker (<15 cigarettes per day), and current
heavy smoker (15 cigarettes per day).
Subjects were asked whether they exercised with an intensity that caused slight breathing difficulty and sweating. Subjects who exercised regularly at moderate intensity were asked about the frequency at which they exercised per week and the length of time per exercise ses-sion. Regular exercise was defined as exercising five or more times per week. Alcohol consump-tion was assessed by quesconsump-tioning the subjects about their drinking behavior during the month prior to the interview. Heavy alcohol drinking was categorized as drinking four or more times per week. Hypertension was defined as a systolic blood pressure (BP)140 mmHg, diastolic BP90 mmHg, or the use of antihypertensive medications, irrespective of blood pressure. Dia-betes was defined as a fasting plasma glucose126 mg/dL (7.0 mmol/l), current use of anti-di-abetes medications, or a previous diagnosis of dianti-di-abetes by a physician. In this study, the definition of diabetes did not include HbA1c level criteria. Obesity was defined as a body mass index (BMI)25 kg/m2according to the Asia-Pacific obesity classification [18].
Height and weight were obtained using standardized techniques and equipment. Height was measured to the nearest 0.1 cm using a portable stadiometer (Seriter, Bismarck, ND, USA). Weight was measured to the nearest 0.1 kg using a Giant-150N calibrated balance-beam scale (Hana, Seoul, Korea). BMI was calculated by dividing weight by the square of the height (kg/m2). Systolic and diastolic BP were measured by standard methods using a sphygmomanometer and with the patient in the sitting position. Three measurements were made for all subjects at 5-min intervals, and the mean of the second and third measurements was used in the analysis.
Laboratory methods
Blood samples were collected in the morning after fasting for at least 8 h. Fasting plasma glu-cose (FPG), total cholesterol, triglycerides (TG), low-density lipoprotein cholesterol (LDL-C), and serum creatinine levels were measured using a Hitachi Automatic Analyzer 7600 (Hitachi, Tokyo, Japan). HbA1c was measured using high performance liquid chromatography (HLC-723G7, Tosoh, Tokyo, Japan). The detailed methods for comparing and verifying the validity and reliability of each survey were described previously [19].
Ethics statement
available at the request of the investigator. Since the dataset did not include any personal infor-mation and participant consent had already been given for the KNHANES, our study was ex-empt from participant consent requirements.
Statistical analyses
Participants in the Korean NHANES were selected for participation based upon a stratified, multi-stage probability-sampling design. Weights for each respondent, representing the inverse of their sampling probability, were provided by the Korean Center for Disease Control and have been used in most analyses presented in order to produce estimates representative of the non-institutionalized Korean civilian population. However, linear models used to identify sta-tistically significant determinants of HbA1C level were not weighted. Statistical analyses were performed using SPSS software (ver. 21.0 for Windows; SPSS, Chicago, IL, USA) for all analy-ses. To consider relationships among the study variables, we have drawn a direct acyclic dia-gram (DAG) based on the previous research findings or known facts. (Fig 1) To compare demographic and clinical characteristics among groups according to smoking habits, we evalu-ated age by ANOVA (analysis of variance) and the percentage of males by theχ2-test.
ANCOVA (analysis of covariance) with Bonferronipost-hoctest was used to adjust for age and gender (Table 1). General linear models were used to assess weighted HbA1c levels according to smoking habits before and after adjustment for confounders (Table 2). Age (year), sex (men/ women), and FPG (mmol/l) were adjusted in Model1.
In Model 2, heavy alcohol drinking (4 alcoholic drinks/week/<4 alcoholic drinks/week),
college graduation (yes/no), hematocrit (%), and waist circumference (cm), as well as age, sex, and FPG, were adjusted for in the analysis.
Linear regression analysis for HbA1c was performed using age (years), gender (men/ women), current smoking (yes/no), heavy alcohol drinking (4 alcoholic drinks/week/<4
al-coholic drinks/week), college graduation (yes/no), waist circumference (cm), FPG (mmol/l), and hematocrit (%) levels as confounding variables (Table 3). There was no evidence that ANOVA and linear regression assumptions were violated. Logistic regression analysis was used to evaluate the odds ratios and 95% confidence intervals of5.7% (the criteria of abnor-mal glucose regulation) and 6.1% HbA1c levels using age (by 10year increase), gender (men/ women), smoking status (never smoking/ ex-smoking/ current light smoking/current heavy smoking), heavy alcohol drinking (4 alcoholic drinks/week/<4 alcoholic drinks/week),
col-lege graduation (yes/no), waist circumference (by 5cm increase), FPG (by 1 mmol/l), and he-matocrit (by 2% increase) levels as confounding variables (Tables4and5). The HbA1c cutoff value of 6.1% was selected, because a recent Korean study showed an HbA1c cutoff level of 6.1% to be the optimal corresponding value for diagnosing diabetes, along with the criteria of FPG7.0 mmol/l and/or 2 hour plasma glucose11.1 mmol/l upon a 75 gram oral glucose tolerance test (63.8% sensitivity and 88.1% specificity). An HbA1c threshold of 5.7% had rea-sonable sensitivity (48.6%) and specificity (65.7%) for identification of prediabetes.[20] All tests were two-sided, andP<0.05 was considered statistically significant.
Results
Demographics and clinical characteristics of the study population
never smokers (unweightedn/weightedn= 6,349/19,105,564), ex-smokers (unweightedn/
weightedn= 1,912/6,207,144), current light smokers (<15 cigarettes per day, unweightedn/
weightedn= 1,205/5,130,073), and current heavy smokers (15 cigarettes per day, unweighted
n/weightedn= 775/3,503,781).
The mean ages of the never smokers, ex-smokers, current light smokers, and current heavy smokers were 44.5 ± 0.3, 47.8 ± 0.5, 38.9 ± 0.5, and 42.7 ± 0.5 years, respectively. The percent-ages of female participants in each smoking group were 78.0, 16.0, 22.0, and 3.0%, respectively (p<0.001). In age- and gender-adjusted comparisons, the current heavy smokers had a higher
BMI, waist circumference, serum TG levels, and fasting plasma glucose levels than current light smokers, never smokers, and ex-smokers. Heavy alcohol drinking and obesity were more common among current heavy smokers than current light smokers, never smokers, and smokers. There was no difference in waist circumference or BMI among never smokers, ex-smokers, and current light smokers. Heavy alcohol drinking was more common in ex-smokers and current light smokers than never smokers.
Mean HbA1c levels according to smoking habits of the subjects with and
without impaired FPG
After age- and gender-adjusted comparisons, mean HbA1c levels were higher among current smokers than never smokers and ex-smokers (5.56 ± 0.01, 5.52 ± 0.01, and 5.49 ± 0.01%, re-spectively). Among current smokers, heavy smokers also had a higher mean HbA1c level than light smokers (5.61 ± 0.02 vs. 5.53 ± 0.01%,p<0.001). FPG levels were higher in current heavy
smokers than current light smokers. However, there was no difference therein among never smokers, ex-smokers, and current light smokers (Table 1).
Age-, gender-, and FPG-adjusted HbA1c levels are shown inTable 2(model 1). In all partic-ipants, including those with both normal and impaired FPG, mean HbA1c levels were slightly higher in current smokers than ex-smokers, even after adjusting for age, gender, and FPG. Fur-thermore, current heavy smokers demonstrated a higher mean HbA1c level than current light smokers, suggesting an exposure-dependent phenomenon. Subgroup analysis of individuals with normal FPG revealed similar results of a higher mean HbA1c level in current smokers
Fig 1. DAG summarizes the established and hypothesized causal relationships among variables under study.
than ex-smokers in a dose-dependent manner. Subgroup analysis of individuals with impaired FPG showed a similar trend, but without statistical significance.
A similar dose-dependent relationship between smoking exposure and HbA1c levels was identified in analyses using age, gender, FPG, heavy alcohol drinking, hematocrit, college grad-uation and waist circumference as covariates (Table 2, model 2;p<0.001).
Factors associated with elevated HbA1c levels
Linear regression analysis to identify independent factors associated with HbA1c levels were performed using age, gender, current smoking, heavy alcohol drinking, college education, waist circumference, FPG, and hematocrit levels as confounding variables. In this model, current smoking was associated with HbA1c levels (coefficient 0.021, 95% CI 0.003–0.039,p= 0.019). (Table 3)
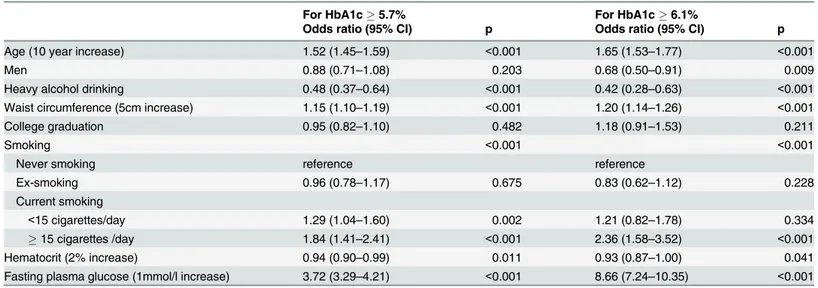
In the logistic regression analysis for5.7% HbA1c levels, the current cutoff value for ab-normal glucose regulation, using the above-mentioned variables as covariates, age, gender, heavy alcohol drinking, waist circumference, smoking habits, hematocrit, and FPG were
Table 1. Weighted, age- and sex-adjusted demographic and clinical characteristics by smoking status for Korean adults without diabetes, aged 19
years and older (2011–2012 KNHANES).
Never smoker Ex-smoker Current smoker
(<15 cigarettes/day)
Current smoker
(15 cigarettes/day)
P
Number
(unweighted/weighted)
6349/19105564 1912/6207144 1205/5130073 775/3503781
Age (years) 44.5±0.3 47.8±0.5 38.9±0.5 42.7±0.5 <0.001
Women (%) 78.0±0.8 16.0±0.9 22.0±1.2 3.0±0.6 <0.001
College graduation (%) 32.9±1.1 36.3±1.6 30.6±1.8 27.5±2.1 0.022
Heavy alcohol drinking (%) 2.4±0.3 10.6±1.0 9.3±1.0 19.5±1.8 <0.001
Regular exercise (%) 7.4±0.5 8.2±1.0 7.7±1.0 6.5±1.2 1.000
Waist circumference (cm) 80.1±0.2 80.7±0.3 80.6±0.4 82.6±0.5 0.006
BMI (kg/m2) 23.5±0.1 23.6±0.1 23.6±0.2 24.2±0.2 0.014
Obesity (%) 29.7±0.9 30.9±1.4 28.4±1.8 41.2±2.4 <0.001
Systolic BP (mmHg) 117.0±0.3 115.9±0.4 116.2±0.5 116.6±0.6 0.162
Diastolic BP (mmHg) 76.0±0.2 76.0±0.3 75.3±0.4 77.3±0.5 0.003
Anti-hypertensive drug (%) 10.7±0.4 13.8±0.9 11.9±0.9 8.4±1.0 0.005
Hypertension (%) 21.2±0.7 25.2±1.2 23.2±1.3 24.4±1.9 0.015
FPG (mmol/l) 5.12±0.01 5.16±0.02 5.09±0.02 5.20±0.03 <0.001
HbA1c (%) 5.52±0.01 5.49±0.01 5.53±0.01 5.61±0.02 <0.001
HbA1c (mmol/mol) 36.83±0.11 36.50±0.11 36.94±0.11 37.81±0.22 <0.001
Impaired fasting glucose (%) 19.0±0.8 21.0±1.2 17.0±1.3 26.0±2.0 0.001
Serum LDL-C (mg/dl) 115.2±1.3 115.6±1.8 114.4±2.1 119.2±2.7 0.462
Serum TG (mg/dl) 118.0±1.9 126.7±2.7 138.6±4.1 181.0±7.1 <0.001
Anti-lipid drug (%) 2.8±0.2 3.8±0.5 3.2±0.4 3.3±0.6 0.135
Serum Creatinine (mg/dl) 0.85±0.01 0.84±0.01 0.84±0.01 0.84±0.01 0.806
Hematocrit (%) 42.1±0.1 41.9±0.1 42.5±0.1 43.3±0.1 <0.001
Data are expressed as mean with SEM. The estimates for age and sex are not adjusted. BMI, body mass index; BP, blood pressure; FPG, fasting plasma glucose; LDL-C, low density lipoprotein-cholesterol; TG, triglyceride; Heavy alcohol drinking,×4 alcoholic drinks/week. Regular exercise,×5 exercise/ week; Obesity, BMI25 kg/m2or more; Hypertension, systolic blood pressure140 mmHg or diastolic blood pressure90 mmHg or use of
antihypertensive medications irrespective of BP;
associated with HbA1c levels. Using never smokers as a control, current light smoking (OR 1.29, 95% CI 1.04–1.60,p= 0.002) and current heavy smoking (OR 1.84, 95% CI 1.41–2.41,
p<0.001) were associated with5.7% HbA1c levels. Ex smoking was not associated with
5.7% HbA1c levels. Furthermore, the OR for an HbA1c levels6.1%, a FPG level of 126 mg/ dl, and a 2-h plasma glucose level200 mg/dl, according to an oral glucose tolerance test, in Korea[21], was 2.36 (95% CI 1.58–3.52,p<0.001) in current heavy smokers. In addition,
for-mer smokers showed no significantly increased risk of elevated HbA1c levels compared with never smokers. (Table 4)
Since the definition of diabetes did not include HbA1c level criteria in this study, 215 pa-tients who had HbA1c levels6.5% and FPG<126 mg/dL were included in study population.
Therefore, we performed additional logistic regression for HbA1c5.7% or6.1% using above- mentioned variables as covariates, after excluding subjects with HbA1c levels6.5%. Using never smokers as a control, current light smoking (OR 1.29, 95% CI 1.04–1.61,
Table 2. Weighted, multivariable-adjusted mean HbA1c (%) levels in Korean adults without diabetes by smoking status.
Never smoker Ex-smoker Current smoker
(<15 cigarettes/day)
Current smoker
(15 cigarettes/day)
P
Number (unweighted/ weighted)
6349/ 19105564
1912/ 6207144
1205/5130073 775/3503781
Model 1
NFG 5.44±0.01 5.41±0.01a 5.46±0.01b 5.53±0.02C 0.001
IFG 5.82±0.02 5.79±0.02 5.87±0.03 5.87±0.03 0.096
NFG+IFG 5.52±0.01 5.49±0.01a 5.54±0.01b 5.59±0.02C 0.001
Model 2
NFG 5.44±0.01 5.41±0.01a 5.46±0.01b 5.54±0.02C <0.001
IFG 5.81±0.02 5.80±0.02 5.87±0.03b 5.89±0.03 0.116
NFG+IFG 5.52±0.01 5.49±0.01a 5.54±0.01b 5.60±0.02C <0.001
a
, p<0.05 vs. never-smoker;
b, p<0.01 vs. ex-smoker; c
, P<0.01 vs. current smoker (<15 cigarettes/day)
NFG, normal fasting glucose; IFG, impaired fasting glucose Model 1, adjusted for age, sex, and fasting plasma glucose
Model 2, adjusted for heavy alcohol drinking, college graduation, hematocrit, waist circumference, and variables in Model 1
doi:10.1371/journal.pone.0126746.t002
Table 3. Regression parameters from unweighted linear regression models to predict HbA1c levels in Korean adults without diabetes (n = 10,241).
Coefficient (95% CI) P
Age (year) 0.006 (0.006–0.0067) <0.001
Women 0.060 (0.039–0.081) <0.001
Current smoking (10cm increase) 0.021 (0.003–0.039) 0.019
Heavy alcohol drinking -0.111 (-0.138- -0.084) <0.001
College graduation -0.018 (-0.032- -0.003) 0.019
Waist circumference 0.005 (0.004–0.005) <0.001
Fasting plasma glucose (mmol/l) 0.283 (0.270–0296) <0.001
Hematocrit (%) -0.001 (-0.004–0.001) 0.176
R2 0.2
p= 0.023) and current heavy smoking (OR 1.83, 95% CI 1.39–2.41,p<0.001) were associated
with HbA1c levels5.7%. (Table 5)
Discussion
In the present study using KNHANES 2011–2012 data, we observed a significant association between smoking habits and HbA1c levels in the general adult population of Korea. Current smokers had higher HbA1c levels than former and never smokers in an exposure-dependent manner, even after adjusting for several clinical parameters that might affect the result.
Table 4. Estimates of association from weighted logistic regression models to predict the risks of HbA1c5.7% or6.1% in Korean adults
with-out diabetes (n = 10,241).
For HbA1c5.7% For HbA1c6.1%
Odds ratio (95% CI) p Odds ratio (95% CI) p
Age (10 year increase) 1.52 (1.45–1.59) <0.001 1.65 (1.53–1.77) <0.001
Men 0.88 (0.71–1.08) 0.203 0.68 (0.50–0.91) 0.009
Heavy alcohol drinking 0.48 (0.37–0.64) <0.001 0.42 (0.28–0.63) <0.001
Waist circumference (5cm increase) 1.15 (1.10–1.19) <0.001 1.20 (1.14–1.26) <0.001
College graduation 0.95 (0.82–1.10) 0.482 1.18 (0.91–1.53) 0.211
Smoking <0.001 <0.001
Never smoking reference reference
Ex-smoking 0.96 (0.78–1.17) 0.675 0.83 (0.62–1.12) 0.228
Current smoking
<15 cigarettes/day 1.29 (1.04–1.60) 0.002 1.21 (0.82–1.78) 0.334
15 cigarettes /day 1.84 (1.41–2.41) <0.001 2.36 (1.58–3.52) <0.001
Hematocrit (2% increase) 0.94 (0.90–0.99) 0.011 0.93 (0.87–1.00) 0.041
Fasting plasma glucose (1mmol/l increase) 3.72 (3.29–4.21) <0.001 8.66 (7.24–10.35) <0.001
All odds ratios were from weighted analyses.
doi:10.1371/journal.pone.0126746.t004
Table 5. Estimates of association from weighted logistic regression models to predict the risks of HbA1c5.7% or6.1% in Korean adults
with-out diabetes after exclusion of subjects with HbA1c6.5% (n = 10,026).
For HbA1c5.7% For HbA1c6.1%
Odds ratio (95% CI) p Odds ratio (95% CI) p
Age (10 year increase) 1.51 (1.44–1.58) <0.001 1.62 (1.50–1.75) <0.001
Men 0.88 (0.72–1.09) 0.242 0.66 (0.48–0.91) 0.011
Heavy alcohol drinking 0.49 (0.37–0.65) <0.001 0.43 (0.27–0.68) <0.001
Waist circumference (5cm increase) 1.14 (1.10–1.18) <0.001 1.15 (1.09–1.22) <0.001
College graduation 0.94 (0.82–1.09) 0.423 1.14 (0.87–1.50) 0.334
Smoking <0.001 <0.001
Never smoking reference reference
Ex-smoking 0.97 (0.79–1.19) 0.766 0.93 (0.67–1.28) 0.644
Current smoking
<15 cigarettes/day 1.29 (1.04–1.61) 0.023 1.25 (0.82–1.90) 0.297
15 cigarettes /day 1.83 (1.39–2.41) <0.001 2.53 (1.61–4.00) <0.001
Hematocrit (2% increase) 0.94 (0.90–0.99) 0.014 0.94 (0.87–1.01) 0.082
Fasting plasma glucose (1mmol/l increase) 3.44 (3.04–3.89) <0.001 6.82 (5.60–8.30) <0.001
All odds ratios were from weighted analyses.
Previously, an association between smoking and HbA1c levels was reported among healthy subjects without diabetes. Lincolnet al. discovered that mean HbA1c levels were lowest in never smokers, intermediate in former smokers, and highest in current smokers in a European multicenter International cohort study (the EPIC-Norfolk study) [15]. Their study also re-vealed an inverse association between years since smoking cessation and HbA1c levels. Jansen
et al. also reported that smoking was independently associated with HbA1c levels in non-dia-betic Dutch adults [16]. In the Scottish Health Survey, smokers had higher Hba1c levels than did non-smokers and were twice as likely to have HbA1c levels in the pre-diabetic range (5.7–
6.4%) [22]. In a representative sample of the non-diabetic United States population, smokers had a 7% increase in HbA1c levels relative to never smokers[14].
All of the above studies were performed mainly in European and United States populations, which are both predominantly Caucasian. Furthermore, a recent meta-analysis revealed that higher HbA1c levels among current smokers are consistent in only Western population studies [17].
Nevertheless, this large population study of a racially homogeneous Korean population sug-gested that the association between smoking habits and HbA1c is also identifiable in non-Western populations without diabetes.
There are several hypotheses regarding the mechanism by which smoking increases HbA1c levels. Using data from the United States NHANES, Caloreet al. reported that cotinine is asso-ciated with increased HbA1c levels [14]. Their study suggested that the link between smoking and HbA1c is at least partly due to the effects of nicotine. Consistent with this, a previous re-port showed that nicotine increased mTOR/P70S6K activity in cultured L6 myotubes, which was associated with increased IRS-1 Ser-636 phosphorylation, reduced insulin-stimulated glu-cose uptake, and subsequent insulin resistance [23]. Eliassonet al. found that the long-term use of nicotine-containing gum was associated with insulin resistance and hyperinsulinemia in subjects without diabetes [24]. However, in another study using euglycemic-clamps, nicotine infusion affected serum insulin levels in diabetic, but not healthy, subjects [25]. Nicotine also increased isletβ-cell apoptosis via nicotinic acetylcholine receptors, leading to decreased insu-lin secretion. Mitochondrial dysfunction, oxidative stress, and inflammation all play a role in the direct toxicity induced by nicotine [26]. Taken together, these data suggest that nicotine ex-posure could negatively affect glucose metabolism by direct and/or indirect effects on insulin action, resulting in higher HbA1c levels even in non-diabetic smokers compared with never and former smokers.
Another hypothesis is that smoking could influence the formation of HbA1c indirectly, in-dependent of its effect on blood glucose. Smoking might increase the passage of glucose across the erythrocyte membrane into cells, resulting in elevated HbA1c levels [27]. Sorayaet al. sug-gested that smoking causes higher erythrocyte 2,3-diphosphoglycerate concentrations, condi-tions under which HbA1c formation is increased [17].
In addition, smoking causes increased oxidative stress and an associated increase in protein glycation, which can also increase HbA1c levels [22,28]. Conversely, antioxidant consumption and the levels of plasma antioxidants, such as vitamin C, were inversely correlated with HbA1c levels in non-diabetic individuals [29–31].
HbA1c assay in samples from smokers, regardless of the mechanism involving smoking-in-duced glucose dysregulation.
In this study, we identified many non-glycemic determinants of HbA1c levels in non-dia-betic subjects, in addition to smoking. The age-related increases in HbA1c levels reported in the current study were consistent with reports in large populations from China, Japan, and the United States [27,32–34]. These studies suggested altered rates of glycation and aging-associat-ed renal function as possible explanations of age-relataging-associat-ed increases in HbA1c levels.
Alcohol consumption, a lifestyle parameter as important as smoking, was independently and negatively correlated with HbA1c levels, consistent with previous reports [29,35,36]. Previ-ous studies suggested that moderate alcohol intake might have protective effects on glucose metabolism by lowering insulin resistance [37,38]. A meta-analysis also showed that moderate alcohol consumption decreased the relative risk for type 2 diabetes, compared to non-drinkers [39]. However, this positive effect of alcohol on glucose metabolism was attenuated in heavy drinkers, as heavy alcohol intake increased the risk of type 2 diabetes, compared to moderate alcohol intake. Such results suggest a“U-shaped”relationship between alcohol consumption and the risk of type 2 diabetes [39,40]. In the current study, the definition of heavy alcohol drinking was four or more drinks per week, which was less specific and more sensitive as a de-scriptor of high alcohol intake than the criteria of three or more drinks per day used in most previous studies [40]. Therefore, the correlation of heavy alcohol drinking with HbA1c levels between this and previous studies cannot be compared directly.
Weight circumference was also independently associated with HbA1c levels in this study. Because we included subjects with impaired FPG, some of them might have metabolic syn-drome, which commonly includes central obesity and impaired FPG. Therefore, it is possible that there might be a residual confounding effect rather than a direct causal relationship.
to be taken into account when using HbA1c levels to screen for prediabetes or diabetes. In this respect, our findings hold clinical importance from a public health point of view.
This study has some limitations. First, we could not assess the accuracy of smoking expo-sure, because this study was based on self-reported smoking habits. Second, although we ad-justed for many confounding factors, residual or hidden confounding variables could not be excluded, similar to other observational studies. We also could not draw an inference of causal-ity due to the cross-sectional design of the study.
In conclusion, current smoking was independently associated with increased levels of HbA1c in a cigarette exposure-dependent manner in a nationally representative sample of Ko-rean non-diabetic individuals. In this study, we observed an association between smoking sta-tus and HbA1c levels in non-diabetics from a non-Western population, consistent with previous findings in Western populations.
Author Contributions
Conceived and designed the experiments: DJK. Performed the experiments: DJK. Analyzed the data: DJK JWH. Wrote the paper: JWH CRK JHN KSK BDR.
References
1. International Expert Committee report on the role of the A1C assay in the diagnosis of diabetes. Diabe-tes care. 2009; 32: 1327–1334. doi:10.2337/dc09-9033PMID:19502545
2. Herman WH, Ma Y, Uwaifo G, Haffner S, Kahn SE, Horton ES, et al. Differences in A1C by race and ethnicity among patients with impaired glucose tolerance in the Diabetes Prevention Program. Diabetes care. 2007; 30: 2453–2457. PMID:17536077
3. Ziemer DC, Kolm P, Weintraub WS, Vaccarino V, Rhee MK, Twombly JG, et al. Glucose-independent, black-white differences in hemoglobin A1c levels: a cross-sectional analysis of 2 studies. Annals of In-ternal Medicine. 2010; 152: 770–777. doi:10.7326/0003-4819-152-12-201006150-00004PMID:
20547905
4. Wolffenbuttel BH, Herman WH, Gross JL, Dharmalingam M, Jiang H, Hardin DS. Ethnic differences in glycemic markers in patients with type 2 diabetes. Diabetes care. 2013; 36: 2931–2936. doi:10.2337/
dc12-2711PMID:23757434
5. Eldeirawi K, Lipton RB. Predictors of hemoglobin A1c in a national sample of nondiabetic children: the Third National Health and Nutrition Examination Survey, 1988–1994. American journal of epidemiolo-gy. 2003; 157: 624–632. PMID:12672682
6. Pani LN, Korenda L, Meigs JB, Driver C, Chamany S, Fox CS, et al. Effect of aging on A1C levels in in-dividuals without diabetes: evidence from the Framingham Offspring Study and the National Health and Nutrition Examination Survey 2001–2004. 2008; 31: 1991–1996. doi:10.2337/dc08-0577PMID:
18628569
7. Eliasson B. Cigarette smoking and diabetes. Progress in cardiovascular diseases. 2003; 45: 405–413. PMID:12704597
8. Manson JE, Ajani UA, Liu S, Nathan DM, Hennekens CH. A prospective study of cigarette smoking and the incidence of diabetes mellitus among US male physicians. The American journal of medicine. 2000; 109: 538–542. PMID:11063954
9. Cho NH, Chan JC, Jang HC, Lim S, Kim HL, Choi SH. Cigarette smoking is an independent risk factor for type 2 diabetes: a four-year community-based prospective study. Clinical endocrinology. 2009; 71: 679–685. doi:10.1111/j.1365-2265.2009.03586.xPMID:19508609
10. Willi C, Bodenmann P, Ghali WA, Faris PD, Cornuz J. Active smoking and the risk of type 2 diabetes: a systematic review and meta-analysis. JAMA: the Journal of the American Medical Association. 2007; 298: 2654–2664. PMID:18073361
11. Foy CG, Bell RA, Farmer DF, Goff DC, Wagenknecht LE. Smoking and incidence of diabetes among U.S. adults: findings from the Insulin Resistance Atherosclerosis Study. Diabetes care. 2005; 28: 2501–2507. PMID:16186287
13. Urberg M, Shammas R, Rajdev K. The effects of cigarette smoking on glycosylated hemoglobin in non-diabetic individuals. Journal of family practice. 1989; 28: 529–531. PMID:2597247
14. Clair C, Bitton A, Meigs JB, Rigotti NA. Relationships of cotinine and self-reported cigarette smoking with hemoglobin A1c in the U.S.: results from the National Health and Nutrition Examination Survey, 1999–2008. Diabetes care. 2011; 34: 2250–2255. doi:10.2337/dc11-0710PMID:21836101
15. Sargeant LA, Khaw KT, Bingham S, Day NE, Luben RN, Oakes S, et al. Cigarette smoking and glycae-mia: the EPIC-Norfolk Study. European Prospective Investigation into Cancer. International Journal of Epidemiology. 2001; 30: 547–554. PMID:11416081
16. Jansen H, Stolk RP, Nolte IM, Kema IP, Wolffenbuttel BH, Snieder H. Determinants of HbA1c in nondi-abetic Dutch adults: genetic loci and clinical and lifestyle parameters, and their interactions in the Life-lines Cohort Study. Journal of internal medicine. 2013; 273: 283–293. doi:10.1111/joim.12010PMID:
23121487
17. Soulimane S, Simon D, Herman WH, Lange C, Lee CM, Colagiuri S, et al. HbA1c, fasting and 2 h plas-ma glucose in current, ex- and never-smokers: a meta-analysis. Diabetologia. 2014; 57: 30–39. doi:10.
1007/s00125-013-3058-yPMID:24065153
18. WHO Expert Consultation. Appropriate body-mass index for Asian populations and its implications for policy and intervention strategies. Lancet (London, England). 2004; 363: 157–163.
19. Korea Centers for Disease Control and Prevention (KCDC). Korea National Health and Nutrition Exami-nation Survey. Available:http://knhanes.cdc.go.kr/. Accessed 27 June 2013.
20. Lee H, Oh JY, Sung YA, Kim DJ, Kim SH, Kim SG, et al. Optimal hemoglobin A1C Cutoff Value for Di-agnosing type 2 diabetes mellitus in Korean adults. Diabetes Res Clin Pract. 2013; 99: 231–236. doi:
10.1016/j.diabres.2012.09.030PMID:23541039
21. Ko S, Kim S, Kim D, Oh S, Lee H, Shim K, et al. 2011 clinical practice guidelines for type 2 diabetes in Korea. Diabetes & Metabolism Journal. 2011; 35: 431–436.
22. Vlassopoulos A, Lean ME, Combet E. Influence of smoking and diet on glycated haemoglobin and 'pre-diabetes' categorisation: a cross-sectional analysis. BMC Public Health. 2013; 13: 1013. doi:10.1186/ 1471-2458-13-1013PMID:24499114
23. Bajaj M. Nicotine and insulin resistance: when the smoke clears. Diabetes. 2012; 61: 3078–3080. doi:
10.2337/db12-1100PMID:23172960
24. Eliasson B, Taskinen MR, Smith U. Long-term use of nicotine gum is associated with hyperinsulinemia and insulin resistance. Circulation. 1996; 94: 878–881. PMID:8790020
25. Axelsson T, Jansson PA, Smith U, Eliasson B. Nicotine infusion acutely impairs insulin sensitivity in type 2 diabetic patients but not in healthy subjects. Journal of internal medicine. 2001; 249: 539–544. PMID:11422660
26. Xie X, Liu Q, Wu J, Wakui M. Impact of cigarette smoking in type 2 diabetes development. Acta pharma-cologica Sinica. 2009; 30: 784–787. doi:10.1038/aps.2009.49PMID:19434055
27. Higgins T, Cembrowski G, Tran D, Lim E, Chan J. Influence of variables on hemoglobin A1c values and nonheterogeneity of hemoglobin A1c reference ranges. Journal of diabetes science and technology. 2009; 3: 644–648. PMID:20144306
28. Cerami C, Founds H, Nicholl I, Mitsuhashi T, Giordano D, Vanpatten S, et al. Tobacco smoke is a source of toxic reactive glycation products. Proceedings of the National Academy of Sciences of the United States of America. 1997; 94: 13915–13920. PMID:9391127
29. Boeing H, Weisgerber UM, Jeckel A, Rose HJ, Kroke A. Association between glycated hemoglobin and diet and other lifestyle factors in a nondiabetic population: cross-sectional evaluation of data from the Potsdam cohort of the European Prospective Investigation into Cancer and Nutrition Study. The Ameri-can journal of clinical nutrition. 2000; 71: 1115–1122. PMID:10799373
30. Davie SJ, Gould BJ, Yudkin JS. Effect of vitamin C on glycosylation of proteins. Diabetes. 1992; 41: 167–173. PMID:1733805
31. Krone CA, Ely JT. Ascorbic acid, glycation, glycohemoglobin and aging. Medical hypotheses. 2004; 62: 275–279. PMID:14962639
32. Hashimoto Y, Futamura A, Ikushima M. Effect of aging on HbA1c in a working male Japanese popula-tion. Diabetes care. 1995; 18: 1337–1340. PMID:8721934
33. Pani LN, Korenda L, Meigs JB, Driver C, Chamany S, Fox CS, et al. Effect of aging on A1C levels in in-dividuals without diabetes: evidence from the Framingham Offspring Study and the National Health and Nutrition Examination Survey 2001–2004. Diabetes care. 2008; 31: 1991–1996. doi:
10.2337/dc08-0577PMID:18628569
35. Harding AH, Sargeant LA, Khaw KT, Welch A, Oakes S, Luben RN, et al. Cross-sectional association between total level and type of alcohol consumption and glycosylated haemoglobin level: the EPIC-Norfolk Study. European journal of clinical nutrition. 2002; 56: 882–890. PMID:12209377
36. Kroenke CH, Chu N, Rifai N, Spiegelman D, Hankinson SE, Manson JE, et al. A cross-sectional study of alcohol consumption patterns and biologic markers of glycemic control among 459 women. Diabetes care. 2003; 26: 1971–1978. PMID:12832298
37. Davies MJ, Baer DJ, Judd JT, Brown ED, Campbell WS, Taylor PR. Effects of moderate alcohol intake on fasting insulin and glucose concentrations and insulin sensitivity in postmenopausal women: a ran-domized controlled trial. JAMA: the Journal of the American Medical Association. 2002; 287: 2559– 2562.
38. Facchini F, Chen YD, Reaven GM. Light-to-moderate alcohol intake is associated with enhanced insu-lin sensitivity. Diabetes care. 1994; 17: 115–119. PMID:7907975
39. Koppes LL, Dekker JM, Hendriks HF, Bouter LM, Heine RJ. Moderate alcohol consumption lowers the risk of type 2 diabetes: a meta-analysis of prospective observational studies. Diabetes care. 2005; 28: 719–725. PMID:15735217
40. Carlsson S, Hammar N, Grill V. Alcohol consumption and type 2 diabetes Meta-analysis of epidemio-logical studies indicates a U-shaped relationship. Diabetologia. 2005; 48: 1051–1054. PMID:
15864527
41. Albanes D, Jones DY, Micozzi MS, Mattson ME. Associations between smoking and body weight in the US population: analysis of NHANES II. Am J Public Health. 1987; 77: 439–444. PMID:3493709
42. Bamia C, Trichopoulou A, Lenas D, Trichopoulos D. Tobacco smoking in relation to body fat mass and distribution in a general population sample. Int J Obes Relat Metab Disord. 2004; 28: 1091–1096. PMID:15197410
43. Chiolero A, Jacot-Sadowski I, Faeh D, Paccaud F, Cornuz J. Association of cigarettes smoked daily with obesity in a general adult population. Obesity (Silver Spring). 2007; 15: 1311–1318. PMID:
17495208