_____________________________
*) Corresponding author: [email protected]
doi: 10.2298/SOS1002221Z
UDK 519.718:661.842:622.785
Structure and Magnetic Investigations of Ca
1-xY
xMnO
3(x=0, 0.1, 0.2, 0.3) and Mn
4+/Mn
3+Relation Aanalysis
J. Zagorac
1*), S. Boškovi
ć
1, B. Matovi
ć
1, B. Babi
ć
-Stoji
ć
21
Vin
č
a Institute of Nuclear Sciences, Laboratory of Material Science, P. O. Box 522,
11001 Belgrade, Serbia
2
Vin
č
a Institute of Nuclear Sciences, Laboratory of Radiation Chemistry and Physics,
Belgrade, Serbia
Abstract:
Structure and magnetic features of nanostructured materials with general formula Ca1-xYxMnO3 (x = 0; 0.1; 0.2; 0.3) were investigated. Goldschmidt tolerance factor, Gt and global instability index, GII were calculated for Ca1-xYxMnO3(x = 0, 0.25, 0.5, 0.75, 1) using the software SPuDS (Structure Prediction Diagnostic Software). According to these two parameters possibility of forming perovskite structure type for Ca1-xYxMnO3 solid solution was analysed.
Substitution of Y3+ for Ca2+ provokes reduction of equivalent amount Mn4+ into Mn3+, the presence of which is a reason for many interesting magnetic, transport and structural features of doped CaMnO3. Crystal structure refinement was carried out using Rietveld analysis. Ca1-xYxMnO3 (x = 0; 0.1; 0.2; 0.3) has an orthorombic, Pnma space group that, according to Glazer´s classification belongs to a-b+a- tilt system. Influence of Y amount on Mn–O bond angles and distances, tilting of MnO6 octahedra around all three axes and octahedra deformation were analysed. Bond valence calculations (BVC) were performed to determine Mn valence state. Using EPR (electron paramagnetic resonance) magnetic measurements were performed and magnetic properties of solid solutions, orthorombicity degree of unit cell, as well as Mn4+/Mn3+ cations ratio in position B were analysed. Microstructure size-strain analysis was performed and these results are in nanometric range which is confirmed by TEM images.
Keywords: Nanostructured materials, Rietveld analysis, BVC calculations, Magnetic properties.
Introduction
The doped manganites with general formula A1-xRExMnO3, where RE is a trivalent rare earth ion, have attracted great interest because many of these materials exhibit colossal magnetoresistance phenomena [1] and acceptable levels of electrical conductivity for cathode materials used for solid oxide fuel cells operation [2].
between the octahedra will result in a cooperative tilting of the corner shared octahedra such that structure distorts to orthorombic Pnma symmetry [4]. There are different ways in which the octahedra can tilt, each leading to a different coordination environment for the A site cation.
A standard notation of octahedral tilting has been developed to describe octahedral tilting by Glazer (1972) [5]. According to Glazer S. G.Pnma belongs to a-b+a- octahedra tilt system. This symbol indicates that rotations about axes a and c are for the same angle and rotation magnitude about axis b differs. A positive superscript would denote the neighboring octahedra tilt in the same direction (in phase) and a negative superscript implies the neighboring octahedra tilt in the oposite direction (out of phase).
In order to estimate the theoretical stability of the perovskite structure, Goldschmidt tolerance factors, Gt and global instability indices, GII were calculated forCa1-xYxMnO3 solid solution, using the software SPuDS (Structure Prediction Diagnostic Software). In an ideal
cubic perovskite, the ionic radii, ri(i = A, B, O), satisfy the relation: rA+rO = 2
(
rB+rO)
. The Goldschmidt tolerance factor for perovskites is, hence, defined by:
(
)
O B
O A t
r r
r r G
+ + =
2 (1)
When the radii of the A and B site cations fulfil the requirements of the Goldschmidt tolerance factor, Gt = 1, the perovskite will be stable and have a cubic symmetry [6].
According to [7] the perovskite structure may form in oxides for which 0.89 < Gt < 1.02. Cation enters into position that results in Gt closer to 1.
It is expected from the tolerance factors that small rare earth (RE) ions with
(
RE3+)
≤0.87r Å will occupy the B site, and large RE with r
(
RE3+)
≥0.94 Å will occupy the Asite, while intermediate RE with0.87≤r
(
RE3+)
≤0.94 Å will occupy both sites with different partitioning for each ion (Fig. 1).Fig. 1. The tolerance factors tA and tB for substitution of trivalent ions on the A and B sites as afunction of the ionic radius [8].
( )
2 1 1 2 ⎭ ⎬ ⎫ ⎩ ⎨ ⎧ ⎥ ⎦ ⎤ ⎢ ⎣ ⎡ =∑
= N d GII N ii (2)
The variables involved in (2) are(di) the deviation from the valence sum rule, and N, which is the number of the atoms in the asymmetric unit. In the bond valence model the empirical correlation of equation (3) is used to determine the bond valence, sij, of a chemical bond from its lenght, Rij:
⎟⎟⎠ ⎞ ⎜⎜ ⎝ ⎛ − = B R R
sij ij
0
exp (3)
where B = 0.37 and R0is the lenght of a bond of unit valence. The values of R0 for most of the common bonds are tabulated in reference [9] and values of R0 used in the present work for calculating the valence of the bond between Mn and O are listed in tab. I.
Magnetic characterization was performed using electron paramagnetic resonance (EPR). Because of nonmagnetic character of Y, EPR is an appropriate tehnique for this study.
Tab. I. The ionic radii and R0 values used in this work for the bond between a cation and oxygen and the deviation, di, from the valence sum rule (equation 2) of the ion in the ideal perovskite structure.
Ions
A(XII)
Ca2+ Y3+
B(VI)
Mn4+ Mn3+
X(VI )
O2-
Ionic radii[Å]
[12]
1.34 1.19 0.53 0.645 1.40
R0
di [13]
1.967 2.019
0.733 1.542
1.753 1.760
0 0
Experimental procedure
0 20 40 60 80 100 0.88
0.90 0.92 0.94 0.96 0.98
0.950 0.959
0.968 Gt
GII
mas. % Y
Gt
0.1 0.2 0.3 0.4 0.5 0.6 0.7 0.8 0.9 1.0
0.259 0.360
0.452
GI
I
parameters, the experimental data for Rietveld refinement were taken afterwards in the angular range 20 – 90 º2θ, with a step width of 0.025 º2θ and 5 s per step. Structural analysis was carried out using Rietveld refinement and the program FullProf [11]. EPR measurements were performed on the CM calcined at 1100 ºC, CY2M and CY3M samples using a Varian E-line spectrometer operating at a nominal frequency of 9.5 GHz. TEM was carried out by using a JEOL JEM 2010 200 kV microscope.
Results and discussion
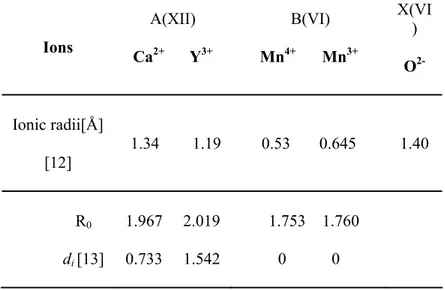
Using SpuDS we calculated Gt and global instability index GII, for all members of the investigated solid solution. For cations in position A of the perovskite structure (Ca2+ and Y3+) the program considers ionic radii for C. N. 12, and for cations in position B of investigated structure type (Mn4+ and Mn3+) octahedral enviroment. All these values, together with R0 i di that are neccesary for calculating GII , are given in table I.
SPuDS can calculate Gtand GII for 0, 25, 33, 50, 67, 75 i 100 mass. % Y. Graphical representation of Gt and GII as a function of Y content is given in Fig. 2. The calculated values for our nominal compositions were obtained using interpolation procedure (table II). Obtained values for Gt and GII satisfy conditions for existence of perovskite structure type for all synthesized oxides. Since the calculated Gtis smaller than 1 it will result in deformation of ideal cubic cell. Gt for CaMnO3 is closest to 1 and has the lowest GII indicating that this perovskite structure is less distorted and distortion increases with entering Y in the structure. CaMnO3 is orthorombic, S. G. Pnma [14, 15]. The small ionic radius of Y3+ results in a small value of the tolerance factor leading to instability of the perovskite structure. Calculated value of Gt for YMnO3 is 0.88, and that is out of range for existence of perovskite structure type for oxides. At atmospheric pressure YMnO3 crystallizes in hexagonal structure and upon annealing under high pressures can be converted to its orthorombic phase [16]. Both structures are nonperovskite. Y doped CaMnO3 is orthorombic [17, 18, 19], and as a result of Y doping Gt decreases up to the limit value for the existence of perovskite structure type. The structure can tolerate Y in CaMnO3 until 0.75 mass. % in the position A. Higher concentrations of Y provoke segregation of YMnO3. GII increases with the Y content increase. This indicates an increase of the structure instability as a consequence of the presence of cations with different size and valence.
Tab. II. Calculated values of Gtand GII for synthesized (*) perovskite phases and end members.
Composition G GII
CaMnO3* 0.97
7
0.15 8 Ca0,9Y0,1MnO
*
0.96 8
0.25 9 Ca0,8Y0,2MnO
* 0.95
9
0.36 0 Ca0,7Y0,3MnO
*
0.95 0
0.45 2
YMnO3 0.88
3
0.89 6
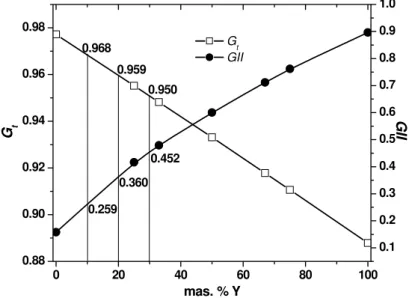
Rietveld refinement revealed that all perovskite phases are orthorombic with space group Pnma. The best fits between calculated and observed X–ray diffraction patterns for investigated samples are given in Fig 3. All allowed Bragg reflections are shown by vertical bars. By inspecting difference between the experimental and calculated profiles, good agreement can be observed. Correctness of the fit can be monitored by the reliability (R) factors that are given as inset and also indicate high reliability of the refinement results.
Fig. 3. Rietveld diagram for a) CM; b) CY1M; c) CY2M and d) CY3M sample.
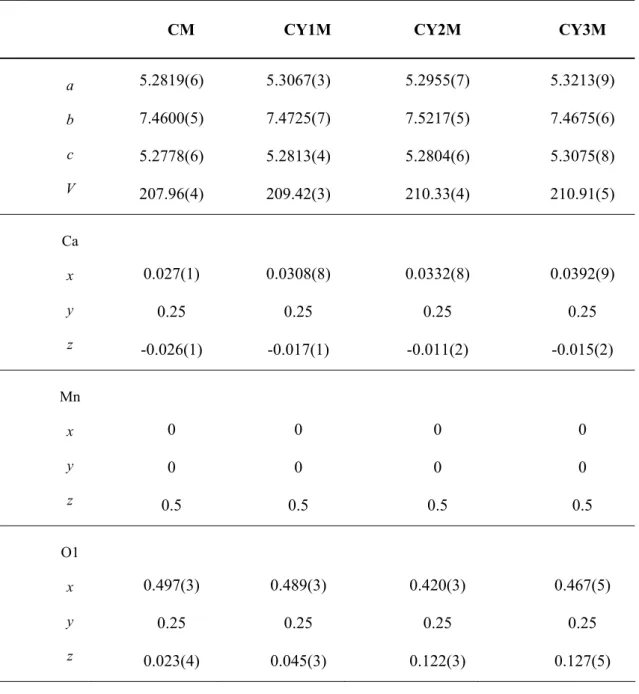
Tab. III. Unit cell parameters, unit cell volume and atomic positions for investigated samples.
CM CY1M CY2M CY3M
a b c V 5.2819(6) 7.4600(5) 5.2778(6) 207.96(4) 5.3067(3) 7.4725(7) 5.2813(4) 209.42(3) 5.2955(7) 7.5217(5) 5.2804(6) 210.33(4) 5.3213(9) 7.4675(6) 5.3075(8) 210.91(5) Ca x y z 0.027(1) 0.25 -0.026(1) 0.0308(8) 0.25 -0.017(1) 0.0332(8) 0.25 -0.011(2) 0.0392(9) 0.25 -0.015(2) Mn x y z 0 0 0.5 0 0 0.5 0 0 0.5 0 0 0.5 O1 x y z 0.497(3) 0.25 0.023(4) 0.489(3) 0.25 0.045(3) 0.420(3) 0.25 0.122(3) 0.467(5) 0.25 0.127(5)
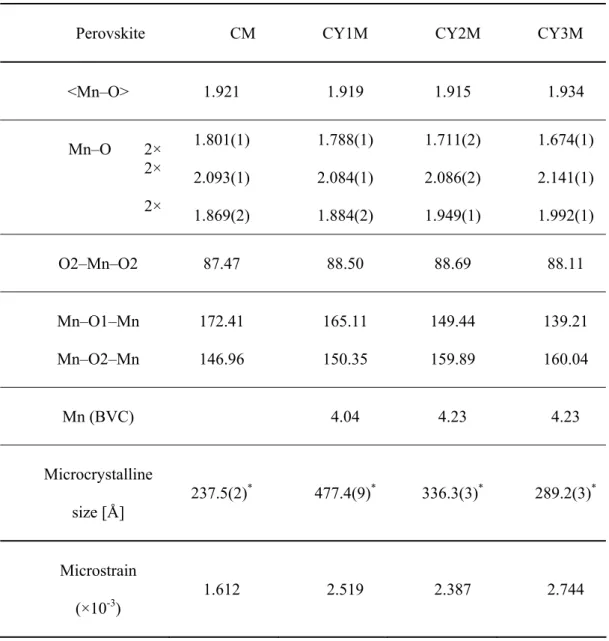
The differences in unit cell parameters and consequently in unit cell volume are the result of the different amount of Y in each of these phases. Ionic radius of Y3+ is smaller than Ca2+ (table I). As a result of entering Y in the structure, a decrease of unit cell volume may be expected. But this is not the case, since doping with Y3+ provokes reduction of equivalent amount of Mn4+ to Mn3+ with larger ionic radius. So, the increase in unit cell volume is a consequence of reduction of Mn4+ to Mn3+.
The large cations, Ca and Y occupy the 4c (x, ¼, z) position and the oxygen atoms are in two non-equivalent positions: O(1) at 4c (x, ¼, z) and O(2) at 8d (x, y, z). Refined coordinates are given in table III.
atoms. Average values of interatomic distances Mn–O change with Y amount in the structure, and has the highest value in CY3M sample, where the content of Y is largest.
Tab. IV. Interatomic distances and bond angles for investigated samples (*Values in brackets are a measure of the degree of anisotropy).
Perovskite CM CY1M CY2M CY3M
<Mn–O> 1.921 1.919 1.915 1.934
Mn–O 2× 2×
2×
1.801(1)
2.093(1)
1.869(2)
1.788(1)
2.084(1)
1.884(2)
1.711(2)
2.086(2)
1.949(1)
1.674(1)
2.141(1)
1.992(1)
O2–Mn–O2 87.47 88.50 88.69 88.11
Mn–O1–Mn
Mn–O2–Mn
172.41
146.96
165.11
150.35
149.44
159.89
139.21
160.04
Mn (BVC) 4.04 4.23 4.23
Microcrystalline
size [Å]
237.5(2)* 477.4(9)* 336.3(3)* 289.2(3)*
Microstrain
(×10-3)
1.612 2.519 2.387 2.744
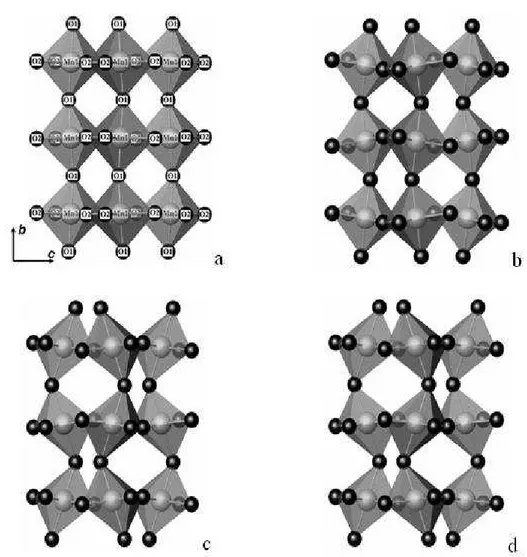
Fig. 4. Octahedra net for perovskite phase in a) CM; b) CY1M; c) CY2M and d) CY3M sample.
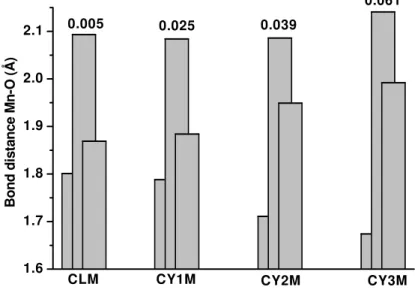
The influence of dopant concentration on octahedra deformations was analyzed. Interatomic distances Mn–O inside octahedra for all the investigated samples are shown in Fig. 5. First two bars are for interatomic Mn–O2 distance in the ac plane and here lies the longest and the shortest bond. The third bar represents Mn–O1 bond distance, in b axes direction, where the intermediate bond lies. Mn–O distances are direction dependent what results in octahedral deformation. The distortion of the octahedra is defined in the way that the deviation of the Mn–O (dn) distances with respect to the average <Mn–O> (<dn>) value is quantified [20]:
Δ=
( )
∑
=1,6[
(
−〈 〉)
〈 〉]
26 / 1
n dn d d (4)
1.6 1.7 1.8 1.9 2.0 2.1
0.061 0.039
0.025 0.005
CY3M CY2M
CY1M CLM
Bond di
st
ance
Mn-O
(
Å
)
for smaller concentrations of Y, and reason for this may lie in the existence of oxygen vacancies that also may provoke reduction of Mn4+ to Mn3+.
Fig. 5. Interatomic distance Mn–O for investigated samples.
Bond valence calculations resulted in Mn valence state that is higher than expected (Tab. IV). The presence of Mn3+ in CY1M, CY2M, CY3M perovskite phase should decrease the valence state of Mn. The valence state of Mn obtained from BVC calculations is often higher than nominal value and reason for this is strong Mn–O bond [22].
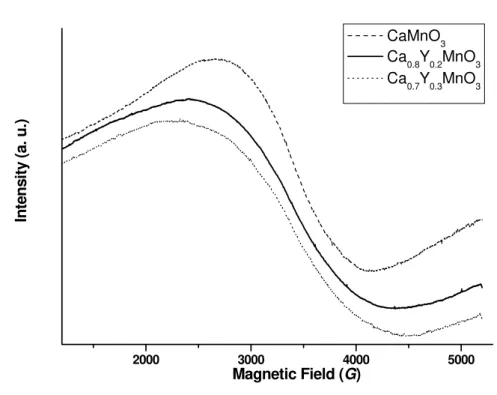
The EPR spectrum for all the samples consists of a single line with a g-factor close to 2 (Tab. V). Fig. 6 shows the EPR line at room temperature for different concentrations of Y, for the CM, CY2M and CY3M samples. The CM sample is fired at 1100 ºC in order to provoke phase transition of Ca2Mn3O8 into CaMnO3. Measured peak-to-peak line width is given also in Table V.
Tab. V. EPR line width and g factors.
Sample
CM CY2M CY3M
Line width (G) 1460 ±100 1980 ± 100 2130 ± 100
g factor 1.982 1.997 2.000
Mn ions Mn4+ (3d3) Mn4+ (3d3) Mn3+(3d4) Mn4+ (3d3) Mn3+ (3d4)
2000 3000 4000 5000
In
te
n
sity
(a
. u
.)
Magnetic Field (G)
CaMnO
3
Ca
0.8Y0.2MnO3
Ca
0.7Y0.3MnO3
Fig. 6. EPR spectra for investigated samples.
XRPD line-broadening analysis was performed using the Rietveld method in conjunction with Warren-Averbach procedure in order to get crystallite size and lattice micro strain parameters. In the present approach the grain size broadening was represented by a Lorentzian function, and micro strain broadening by a Gaussian function. Obtained crystallite sizes are in nanometric range with crystallites of about 200-500 Å and microstrain increases with increasing Y amount (Table IV). TEM images of CY1M and CY2M samples in Fig. 7 confirm these results.
Conclusions
The software SpuDS has been developed for predicting the structures of perovskite compounds and predicted structures can serve as the starting point for Rietveld refinements in the course of structural characterization of new materials. Calculating of Gt and GII can help in studying possibility of forming perovskite structure type. It also indicates the distortion from ideal cubic structure.
Influence of Y concentration onCa1-xYxMnO3 (x = 0, 0.1, 0.2, 0.3) was analysed. The increase of unit cell volume with the increase of Y amount in the structure, ionic radius of which is smaller than Ca, is an evidence for the presence of Mn3+ in the structure. The difference in Mn electronic state overcomes the difference between ionic radii of Y and Ca. Higher content of Y3+ and Mn3+ in the structure increases octahedra tilting magnitude and structure deformation. Deformation of octahedra in Ca1-xYxMnO3 (x = 0, 0.1, 0.2, 0.3) points out to the presence of some Mn3+ in its structure.
The EPR line width broadening with increasing Y content can be understood in terms of the progressive distortion of the crystalline structure. The EPR line width seems to be a physical parameter that closely follows the cell distortion in Ca1-xYxMnO3.
The obtained CY1M and CY2M powders are in nanometric range, which is confirmed by the microstructural as well as by TEM analysis.
Acknowledgments
This paper has been financially supported by the Ministry of Science and Environmental Protection of the Republic of Serbia, as a part of project No. 142003.
References
1. S. J. Hibble, S. P. Cooper, A. C. Hannon, I. D. Fawcett, M. Greenblatt, J. Phys.: Condens, Matter 11, (1999) 9221.
2. B. Raveau, A. Maignan, C. Martin, M. Hervieu, Chem. Mater. Vol.10 (1998) 2461. 3. M. W. Lufaso, P. M. Woodward, Acta Cryst. B57 (2001) 725.
4. P. M. Woodward, Acta Cryst. B 53 (1997) 32. 5. A. M. Glazer,Acta Cryst. B 28 (1972) 3384.
6. M. Mogensen, D. Lybye, N. Bonanos, P. V. Hendriksen, F. W. Poulsen, Solid State Ionics 174 (2004) 279.
7. J. M. D. Coey, M. Viret, S. Von Molnar, Adv. Phys. Vol. 48, No. 2 (1999) 167. 8. Y. Tsur, T. D. Dunbar, C. A. Randall, J. Electroceram. 7(2001) 25.
9. I. D. Brown, D. Altermatt, Acta Cryst. B 41(1985) 244.
10.S. B. Bošković , B. Z. Matović, M. D. Vlajić, V. D. Krstić, Ceram. Int. Vol. 33(1) (2007) 89.
11.J. Rodriguez-Carvajal: Collected Abstract of Powder Diffraction Meeting, Toulouse (1990) 127.
12.R. D. Shannon, Acta Cryst. A 32(1976) 751.
13.G. H. Rao, K. Barner, I. D. Drown, J. Phys.: Condens. Matter.10 (1998) L757. 14.H. Taguchi, M. Sonoda, M. Nagao, J. Solid State Chem. 137 (1998), 82-86.
15.J. Blasco, C. Ritter, J. Garcia, M. J. De Teresa, J. Perez-Cacho, R. M. Ibarra, Phys. Rev. Serie 3. B-Condens. Matter 62 (9) (2000) 5609.
17.M. Dlouha, S. Vratislav, Z. Jirak, J. Hejtmanek, K. Knizek, D. Sedmidubsky, Appl. Phys. A 74 (2002) S673.
18.P. M. Woodward, T. Vogt, D. E. Cox, A. Arulraj, C. N. R. Rao, P. Karen, A. K. Cheetham, Chem. Materi. 10 (1998) 3652.
19.S. J. Hibble, S. P. Cooper, A. C. Hannon, I. D. Fawcett, M. Greenblatt, J. Phys.: Condens. Mat. 11 (1999) 9221.
20.G. A. Maris: Structural Transition Induced by Charge and Orbital Ordering in Transition Metal Oxides. Ph. D. Thesis, (2004), University of Groningen, Netherlands.
21.M. E. Melo Jorge, A. Correia dos Santos, M. R. Nunes, Int. J. Inorg. Mater. 3 (2001) 915.
22.C. O. Paiva-Santos, R. F. C. Marques, M. Jr. Jafelicci, L. C. Varanda,Powder Diffr. 17 (2) (2002) 149.
Са р а: И ј
ј Ca1-xYxMnO3 (x=0; 0,1; 0,2; 0,3). К
ј SPuDS ( ђ )
ј , Gt , GII.
ј w
Ca1-xYxMnO3. Y3+ Ca2+
ј ј Mn4+ Mn3+, ј ј ј
,
CaMnO3. ј . Ca1-xYxMnO3 (x=0;
0,1; 0,2; 0,3) ј Pnma, ј ј ј
ј a-b+a- . ј ј
ј Y Mn– , Mn 6
ј . Mn
. К ( )
ђ ,
ј ј , Mn4+/Mn3+ ј ј
y . ј
ј ј ђ
ј .
К учн р чи: ј , ,
![Fig. 1. The tolerance factors t A and t B for substitution of trivalent ions on the A and B sites as a function of the ionic radius [8]](https://thumb-eu.123doks.com/thumbv2/123dok_br/18161526.328844/2.892.247.633.707.963/tolerance-factors-substitution-trivalent-sites-function-ionic-radius.webp)