www.nat-hazards-earth-syst-sci.net/16/2543/2016/ doi:10.5194/nhess-16-2543-2016
© Author(s) 2016. CC Attribution 3.0 License.
Contribution of storms to shoreline changes in mesotidal dissipative
beaches: case study in the Gulf of Cádiz (SW Spain)
María Puig1, Laura Del Río1, Theocharis A. Plomaritis1,2, and Javier Benavente1
1Department of Earth Sciences, CASEM, University of Cádiz, Av. República Saharaui s/n Puerto Real, Cádiz, 11510, Spain 2CIMA, University of Algarve, Campus of Gambelas, Faro, 8005-135, Portugal
Correspondence to:María Puig ([email protected])
Received: 2 June 2016 – Published in Nat. Hazards Earth Syst. Sci. Discuss.: 30 June 2016 Revised: 14 September 2016 – Accepted: 25 October 2016 – Published: 1 December 2016
Abstract. In this study an analysis of storminess and rates of shoreline change is performed and discussed jointly in four geomorphological units of the Gulf of Cádiz (SW Spain) for the period of 1956–2010. For this purpose, storm events are identified based on the following characteristics: wave height above 2.5 m, a minimum duration of 12 h and events with calm periods of less than 24 h were considered as a sin-gle event. Subsequently, energy parameters are determined in order to characterize storm-induced impacts. Conversely, geographic information system (GIS) tools are used to mea-sure shoreline changes in aerial photographs and orthopho-tographs of each site, selecting the high water line as shore-line proxy. Each geomorphological unit is divided into dif-ferent behavioural patterns according to recorded coastal changes, so that each one shows a particular behaviour.
In general the variability of shoreline changes that is ex-plained by storms and the relation between storm parame-ters and coastal changes present better results in exposed ar-eas (Cádiz and Vistahermosa) than in sheltered arar-eas (Valde-lagrana spit barrier) because the former are more sensitive to storm impacts. On the contrary, in areas where there is no relation between coastal changes and storm parameters (Valdelagrana and Sancti Petri sand spit), it is suggested that anthropogenic factors are the main forcing agents determin-ing shoreline behaviour. However, in these areas the stormi-ness also modulates coastline recession by increasing erosion when the number of storms is high.
1 Introduction
Accelerating population growth in coastal areas and the threat of climate change have greatly increased the interest of researchers in the dynamic behaviour of the shoreline (Bar-ragán and De Andrés, 2015). Aside from scientists, coastal managers also need to know how shoreline position changes over time in order to develop adequate coastal planning poli-cies.
Coastal areas are subject to a variety of hydrodynamic and geomorphological processes that occur over the short, medium and long timescales. Whether natural or man-induced, coasts all over the world are affected by a contin-uous balance between erosion–accretion processes. The con-tribution of different factors to the above processes in the medium term has been studied by numerous authors. On one hand, within natural controls, the main contributing agents are geological framework, sediment supply and wave climate (e.g. Jackson et al., 2005; Dissanayake et al., 2015; Mas-selink et al., 2016). On the other hand, within anthropogenic controls, land use transformation, coastal development and the construction of engineering structures at the coast (such as jetties) and in river basins (dams) are the major causes of shoreline erosion (e.g. Di Stefano et al., 2013; Hapke et al., 2013; Van Wesenbeeck et al., 2015).
showed that storm groups with low return periods can cause the same erosion as a single extreme storm with a high re-turn period. In this respect Plomaritis et al. (2015) showed that in the Gulf of Cádiz (SW Spain) the number of storms and their duration is related to large-scale atmospheric circu-lation patterns, namely the NAO (North Atlantic Oscilcircu-lation) and the EA (East Atlantic Pattern), and that a larger num-ber of storms increase the probability of events with a higher return period. Based on the controls above, storms produce numerous effects, which include beach and dune erosion, coastal flooding, inlet breaching and overwash. In economic terms, storm impacts can be significant and in some cases they can have devastating consequences (Ciavola et al., 2011; Kreibich et al., 2014). Thus, the development of storm hazard and vulnerability assessments is an issue of primary concern in coastal zones.
Aerial photographs and orthophotographs provide snap-shots of coastal morphology that can give an overview of the above-mentioned storm effects, and they are the most com-monly used technique in assessing medium- and long-term shoreline evolution. Furthermore, they are the basis of nu-merous models that have been developed in order to predict future shoreline changes (e.g. Cowell et al., 1995; Frazer et al., 2009; Anderson et al., 2010). In the Gulf of Cádiz, shore-line changes over the last 50 years have been studied by sev-eral authors (Benavente et al., 2006; Anfuso et al., 2007; Del Río et al., 2013). According to these studies the area exhibits overall erosional trends; however, there are particular cases of rectilinear beaches with stable or accreting patterns.
The relation between storminess and morphological re-sponse in the short term has also been widely studied in the Gulf of Cádiz (e.g. Reyes et al., 1999; Rangel-Buitrago and Anfuso, 2011a). However, until now there has been a lack of detailed studies on the contribution of storms to coastal evo-lution over the medium-term scale (years to decades; Stive et al., 2002) and on a regional scale application. This informa-tion is of great interest, given the existing uncertainty about how climate variability can induce variations in storm pat-terns. It can also be useful for erosion management purposes since in the last 2 decades, in order to mitigate coastal ero-sion impacts, a total of 90 beach nourishments have been per-formed on the sandy shores of Cádiz province (Muñoz-Perez et al., 2001, 2014).
Within this context, in the present work a comparison be-tween medium-term shoreline changes and wave climate data is undertaken in four geomorphological units located in the southern Gulf of Cádiz, and the influence of storminess in coastal evolution is analysed and discussed. For this pur-pose, storm record is obtained by combining modelled data of a hindcast database and measured data. Then shoreline changes are obtained by analysing sets of aerial photographs and orthophotographs dating between 1956 and 2010. Fi-nally, results on shoreline changes and storm record, as well as the relation between them in the study area, are presented and discussed.
Figure 1.Location map of the study area and the analysed sites I (Vistahermosa), II (Valdelagrana spit barrier), III (Cádiz) and IV (Sancti Petri sand spit).
2 Study area
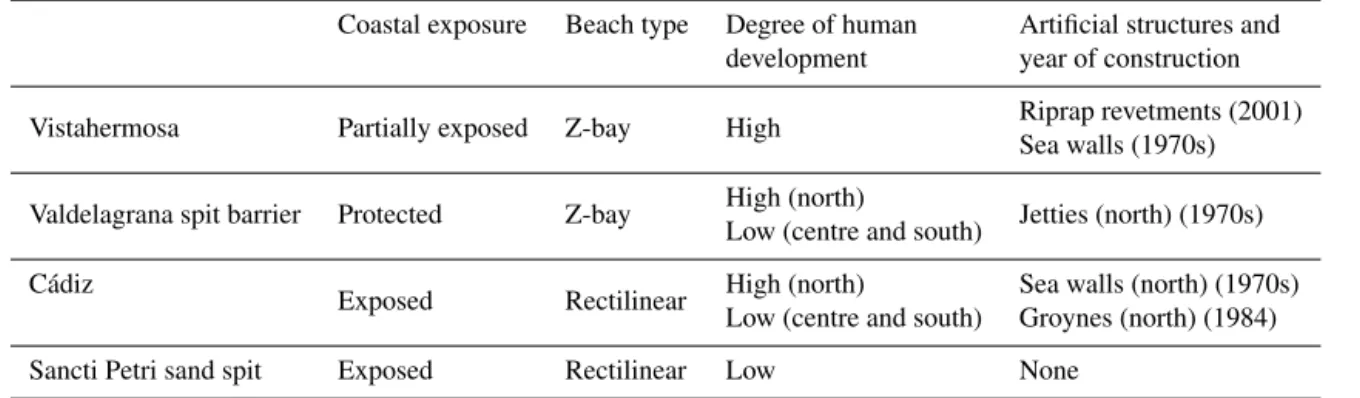
The study area consists of four geomorphological units lo-cated in the southern Gulf of Cádiz (SW Spain) (Fig. 1) with contrasting geomorphological characteristics, degree of ur-ban development and exposure to waves (Table 1): Vistaher-mosa (I), Valdelagrana spit barrier (II), Cádiz (III) and Sancti Petri sand spit (IV).
lo-Table 1.Summary of the characteristics of each geomorphological unit.
Coastal exposure Beach type Degree of human Artificial structures and development year of construction
Vistahermosa Partially exposed Z-bay High Riprap revetments (2001)
Sea walls (1970s)
Valdelagrana spit barrier Protected Z-bay High (north) Jetties (north) (1970s) Low (centre and south)
Cádiz Exposed Rectilinear High (north) Sea walls (north) (1970s)
Low (centre and south) Groynes (north) (1984)
Sancti Petri sand spit Exposed Rectilinear Low None
cated in the inner part of the bay, is a well-developed spit barrier that has recently evolved into a Z-bay due to the in-stallation and extension of the Guadalete River jetties at its northern end (Martínez-del-Pozo et al., 2001). With a general N–S orientation, it is sheltered from wave incidence because waves approaching from the west and southwest are refracted and diffracted around the Cádiz tombolo (Fig. 1). The north-ern part is heavily urbanized, while the central and southnorth-ern sectors belong to the Cádiz Bay Natural Park.
The southern units (Cádiz and Sancti Petri sand spit), with similar orientation (NNW–SSE) are situated in the outer part of the bay, thus being exposed to direct wave impact (Fig. 1). Both units consist of long and rectilinear sandy beaches and their sediment budget is connected since prevailing long-shore transport drifts southward. The geomorphological unit of Cádiz, with a length of 9 km, consists of urban and natural areas (Fig. 1). The northern beaches, which are backed by a seawall, belong to the city of Cádiz, while the southernmost beaches are in a natural area backed by low foredunes. Fi-nally, Sancti Petri sand spit is a natural zone located in the southern part of the Bay of Cádiz. It extends along 7.7 km, being also part of Cádiz Bay Natural Park. This sandy unit is backed by dune ridges and extensive salt marshes and is limited inland by the Sancti Petri tidal channel.
In the Bay of Cádiz subtidal and intertidal rocky shore platforms are present along the coast. On the one hand, sub-tidal rocky platforms appear discontinuously along the outer part of the bay (Cádiz and Camposoto). On the other hand, intertidal platforms are present at several points along Vista-hermosa, as well as in the northern sector and the natural part of the Cádiz unit (Fig. 1).
The area is mesotidal and semidiurnal with mean neap and spring tidal ranges between 1.20 and 2.96 m respectively (In-stituto Hidrográfico de la Marina, 2014). Dominant winds in the Gulf of Cádiz blow from the W-SW and E-SE. E-SE winds come from the Mediterranean Sea and have low in-fluence on coastal erosion due to their short fetch and the coastline orientation. Conversely, W-SW winds with longer fetch have greater importance (Gracia et al., 2006), espe-cially during storm periods, which are considered to be from
Figure 2.Wave height record during 1956–2010 from Cádiz buoy.
3 Methods
3.1 Wave data and storm selection
A synthetic storm record was constructed by combining wave data from the coastal wave buoy of Cádiz (Fig. 1) and those from the hindcast database of the HIPOCAS (Hind-cast of Dynamic Processes of the Ocean and Coastal Areas of Europe) project (Guedes-Soares et al., 2002). The dura-tion of the data considered in the hindcast database of the HIPOCAS project is between 1958 and 2001, and that of the coastal wave buoy of Cádiz is between 2002 and 2010. Inter-calibration of the two records for the overlapping period was undertaken with directional data (year 2001) by using a peak over threshold analysis (POT). For this purpose, the approach by Plomaritis et al. (2015) was followed, which emphasizes agreement during storms.
The storm events were identified again using POT analy-sis following the criteria described in Del Río et al. (2012), i.e. wave heights over 2.5 m and a minimum duration of 12 h; storm groups with calm periods of less than 24 h be-tween them were considered a single storm-group event. The threshold above for significant wave height coincides with the 0.95 quantile defined by Masselink et al. (2014) and with the minimum wave height threshold proposed by Ribera et al. (2011).
3.2 Storm characterization
Storm-induced impacts at the shoreline were characterized by computing different parameters, namely wave energy (E),
wave energy at high tide, wave power (P), wave erosivity
(Er), number of storms and storm duration for each storm season. A wide variety of behaviours for each parameter was covered by calculating the mean, cumulative and peak of each parameter. The rationale is that cumulative values in-clude variations in storm frequency and storm duration, while mean values reflect an average value that compresses the storm variability, and peak values show the intensity of the strongest storm during the season.
In order to calculate wave characteristics close to the shoreline and account for the different coastline orientation of the four geomorphological units described above, wave transformation due to shoaling and refraction was undertaken by using a linear wave theory (Kamphuis, 2000):
Hs, b=KsKrHo, s, (1)
whereHs, bis the significant wave height at breaking,Ks is shoaling coefficient,Kris refraction coefficient andHo, sis wave height at the wave buoy depth (21 m).
Wave energy at breaking (E) was derived from the
equa-tion proposed by Dean and Dalrymple (1991):
E=1/16ρgH2
s, b, (2)
whereρis water density andgis gravitational constant.
Sub-sequently, wave energy at the time of high tide was obtained
in order to account for the importance of the tide during storms since previous studies in the area have shown that the largest contribution to total sea level variation is the tide (Del Río et al., 2012). In the same way, wave power or wave en-ergy flux at breaking was calculated by
P =ECg. (3)
In this expression Cg=0.5(gHs, b/γ ) is the shallow wa-ter group velocity, where γ is the breaking parameter. In
the present work, McCowan’s (1894) breaking criterion was used (γ =0.78). Finally, wave erosivity (Benavente et al., 2000) was introduced to distinguish erosive conditions from accreting conditions. This parameter is indicative of the erosive potential of incident waves and is given by the prod-uct of the dimensionless fall velocity parameter () and wave
energy at breaking (E):
=Hs, b/ wTp, (4)
Er=E=kdHs, b/Tp, (5)
whereTpis peak wave period andkd=ρg/16wis a constant that includes the sediment fall velocity (w), which is a
func-tion of the median grain size (D50) and the density of sand. For the study site a density of 2.65 was considered (density of quartz).
3.3 Shoreline changes
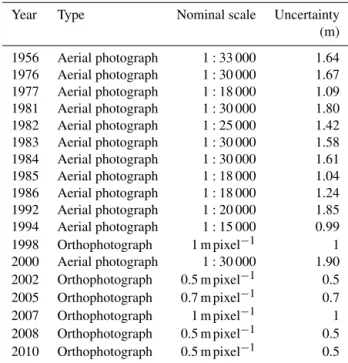
For each geomorphological unit an average of 15 aerial pho-tographs and orthophopho-tographs were used at scales ranging from 1:15 000 to 1:33 000 in order to measure changes in shoreline position over a 54-year span (1956–2010) (Ta-ble 2). Erosion–accretion rates were calculated using the methods described in detail in Del Río et al. (2013) by employing geographic information system (GIS) tools for the georeferencing of the aerial photographs, digitization of shoreline proxies, calculation of shoreline changes and de-termination of the photographs uncertainty and considering the factors that interfere with the proper interpretation and identification of the shoreline position (Del Río and Gracia, 2013). These factors are mainly related to image scale and processing techniques and involve the loss of image resolu-tion due to photo scanning and georeferencing (Fletcher et al., 2003). Regarding shoreline indicators, in order to use a common proxy at all the sites the high water line (considered as the location of the wet–dry beach contact) was used as the shoreline indicator. This proxy was also used in the cliffs of northern Vistahermosa because it coincides with the cliff foot. It was not possible to use the dune foot as a common proxy due to the absence of dunes at the backbeach in the study sites of Cádiz and Vistahermosa.
Table 2.Photographs available for the study sites.
Year Type Nominal scale Uncertainty
(m)
1956 Aerial photograph 1:33 000 1.64 1976 Aerial photograph 1:30 000 1.67 1977 Aerial photograph 1:18 000 1.09 1981 Aerial photograph 1:30 000 1.80 1982 Aerial photograph 1:25 000 1.42 1983 Aerial photograph 1:30 000 1.58 1984 Aerial photograph 1:30 000 1.61 1985 Aerial photograph 1:18 000 1.04 1986 Aerial photograph 1:18 000 1.24 1992 Aerial photograph 1:20 000 1.85 1994 Aerial photograph 1:15 000 0.99
1998 Orthophotograph 1 m pixel−1 1
2000 Aerial photograph 1:30 000 1.90 2002 Orthophotograph 0.5 m pixel−1 0.5 2005 Orthophotograph 0.7 m pixel−1
0.7
2007 Orthophotograph 1 m pixel−1 1
2008 Orthophotograph 0.5 m pixel−1
0.5 2010 Orthophotograph 0.5 m pixel−1 0.5
this, rates of shoreline change in each transect were obtained by dividing the distance between consecutive shorelines by the time interval between them.
It must be noted that calculated shoreline changes were influenced by the time interval between photographs, which tends to generate overestimated rates of shoreline change during particularly short time spans and underestimated rates during very long time spans (Dolan et al., 1991; Mann et al., 2016). This error is acknowledged here but its analysis is out of the scope of this work.
3.4 Relation between storm parameters and shoreline changes
Summarizing the method described above, a total of six storm variables (energy, energy at high tide, wave power, ero-sivity, storm frequency and storm duration) were selected in order to characterize shoreline changes. From the first four parameters, their mean, cumulative and peak were calcu-lated, giving a total of 14 variables.
Storm parameters were computed for the periods between photographs and their contribution to shoreline changes was analysed in two different ways. Firstly, the relation between storm parameters and rates of shoreline change was assessed without considering coastal exposure and storm distribution along the photographs. Secondly, coastal exposure was con-sidered (Eq. 1) in calculating the storm parameters. In ad-dition to this, a weighting factor was assigned, which in-creased linearly with the temporal proximity to the pho-tographs. The weighting factor assumes a reduced impact of the older storms in coastline retreat and is similar to the
re-covery rate approach by Frazer et al. (2009). The zero weight was given to the storm parameters dating more than 5 years before the photograph, as in the study area, beaches require several years to recover from the impacts of strong storms in the medium term (Benavente et al., 2013). Moreover, this period coincides with the mean sampling interval between consecutive photographs.
The relation between storm parameters and rates of shore-line change was assessed by means of the Pearson correlation coefficient (r), and thepvalue of<0.05 was used to check
the statistical significance of the correlation. Furthermore, for the cases of a strong relationship between storm parameters and erosion rates a linear and nonlinear fit was used and the
R2was calculated in order to estimate the explained
variabil-ity between the storm parameters and the shoreline evolution.
4 Results
4.1 Storm analysis
The effects of wave transformation due to shoaling and re-fraction and the temporal evolution of energetic parameters are shown in Fig. 3. It presents four of the six storm parame-ters that were analysed in the present study (energy, energy at high tide, number of storms and duration) for the Cádiz unit. The other parameters (wave power and wave erosivity factor) and the rest of the areas are not shown since they present very similar patterns.
The effect on coastal orientation, when wave transforma-tion is considered, does not produce large variatransforma-tions in the patterns of storm parameters; however, it increases their val-ues along the studied period (Fig. 3a, b). In both cases, energy (Fig. 3a) (and similarly wave power and erosivity) is charac-terized by a relatively stable pattern from 1956 to 1995 fol-lowed by a negative trend until 2004 and an increase over the last few years. Conversely, energy during high tide (Fig. 3b) has a large interannual variability with several remarkable peaks (i.e. 1961, 1981, 1987, 1992, 1995, 1998 and 2009).
Over the study period a total of 231 storms were recorded, with an overall duration of 351 days (Fig. 3c, d). The stormi-est years, with more than eight storms per year and over 13 days of duration, are 1958, 1963, 1996, 2003, 2009 and 2010. Nevertheless, there are other years (i.e. 1979) where the number of storms is lower than eight but with over 13 days of duration. Years with low storm record (less than two storms per year and 2 days of duration) are 1971, 1974, 1980, 1988, 1990, 1992, 1993 and 2007. Finally, the remain-ing periods present an average of four storms per year and 5 days of duration.
Figure 3. Temporal evolution of energetic parameters during the studied period: energy (E), energy at high tide (Eht), number of storms and storm duration. The dates of the available photographs are shown with vertical lines. The effect of wave transformation on Eand Eht is shown for the Cádiz site.
variable pattern (Fig. 4c, d). Nevertheless the peak of 1984– 1985 matches with the occurrences of the highest cumulative parameters.
4.2 Shoreline changes
In general, shoreline changes along the study zone show a high spatial and temporal variability. The four geomorpho-logical units present different behaviours and within each unit there are variable patterns.
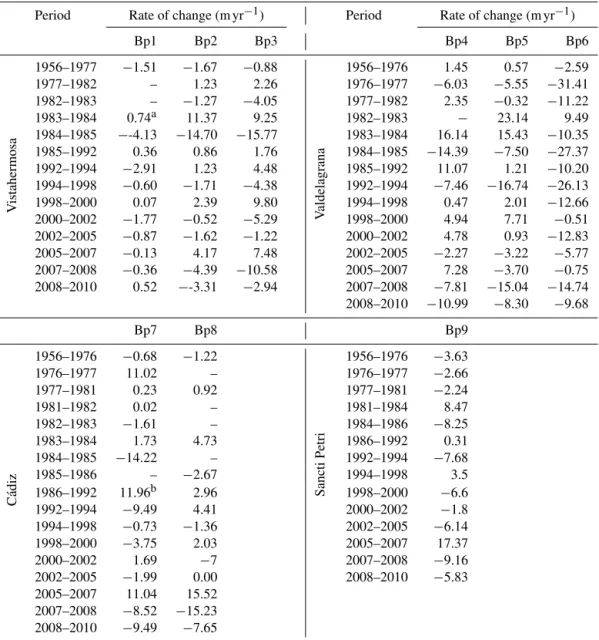
Shoreline trends along the four study sites between 1956 and 2010 are shown in Table 3 and in Figs. 5 and 6. Each one of the four units has been divided into behavioural patterns (BP hereafter) according to the general shape of the fitting curve of the shoreline trend. In the following paragraphs each BP is explained according to its mean shoreline position and rates during the period of study.
The first two behavioural patterns of Vistahermosa involve an erosional trend; however, they are separated due to the availability of aerial photographs and the alongshore vari-ability (Fig. 5a). In detail, the northern part (BP1), with an average retreat rate of −1.1 m yr−1, shows continuous ero-sion until 2005, followed by a stabilization. Further south, in Fuentebravía and in the southern part of Santa Catalina beach (corresponding to the central and southern portions of BP2),
Figure 4.Cumulative energy (EC)and wave erosivity (ErC), mean energy (EM) and energy at high tide (EhtM), peak energy (EP) and energy at high tide (EhtP) and storm duration and frequency for the periods between sets of photographs.
a comparable average retreat is recorded (−0.4 m yr−1). On the other hand, BP3, situated in the central part of Santa Catalina beach, presents the most variable trend with mean accretion rates ranging from 2.3 to 9.8 m yr−1and mean ero-sional rates from−0.9 to−15.8 m yr−1. Nevertheless, these extreme rates (−15.8 m yr−1 and 9.8 m yr−1) coincide with particularly short sampling intervals (1984–1985 and 1998– 2000) and could thus be affected by the above-mentioned overestimation.
Figure 5. Shoreline trends of Vistahermosa(a)and Valdelagrana(b)sites classified by behavioural patterns (BP). Error bars represent alongshore variability.
Table 3.Shoreline changes in the study area (arate for the period 1982–1984;brate for the period 1985–1992;crate for the period 1956– 1977;drate for the period 1981–1984;erate for the period 1984–1986 since certain aerial photographs were not available for these areas).
Period Rate of change (m yr−1) Period Rate of change (m yr−1)
Bp1 Bp2 Bp3 Bp4 Bp5 Bp6
V
istahermosa
1956–1977 −1.51 −1.67 −0.88
V
aldelagrana
1956–1976 1.45 0.57 −2.59
1977–1982 – 1.23 2.26 1976–1977 −6.03 −5.55 −31.41
1982–1983 – −1.27 −4.05 1977–1982 2.35 −0.32 −11.22
1983–1984 0.74a 11.37 9.25 1982–1983 − 23.14 9.49
1984–1985 −-4.13 −14.70 −15.77 1983–1984 16.14 15.43 −10.35
1985–1992 0.36 0.86 1.76 1984–1985 −14.39 −7.50 −27.37
1992–1994 −2.91 1.23 4.48 1985–1992 11.07 1.21 −10.20
1994–1998 −0.60 −1.71 −4.38 1992–1994 −7.46 −16.74 −26.13
1998–2000 0.07 2.39 9.80 1994–1998 0.47 2.01 −12.66
2000–2002 −1.77 −0.52 −5.29 1998–2000 4.94 7.71 −0.51
2002–2005 −0.87 −1.62 −1.22 2000–2002 4.78 0.93 −12.83
2005–2007 −0.13 4.17 7.48 2002–2005 −2.27 −3.22 −5.77
2007–2008 −0.36 −4.39 −10.58 2005–2007 7.28 −3.70 −0.75
2008–2010 0.52 −-3.31 −2.94 2007–2008 −7.81 −15.04 −14.74 2008–2010 −10.99 −8.30 −9.68
Bp7 Bp8 Bp9
Cádiz
1956–1976 −0.68 −1.22
Sancti
Petri
1956–1976 −3.63
1976–1977 11.02 – 1976–1977 −2.66
1977–1981 0.23 0.92 1977–1981 −2.24
1981–1982 0.02 – 1981–1984 8.47
1982–1983 −1.61 – 1984–1986 −8.25
1983–1984 1.73 4.73 1986–1992 0.31
1984–1985 −14.22 – 1992–1994 −7.68
1985–1986 – −2.67 1994–1998 3.5
1986–1992 11.96b 2.96 1998–2000 −6.6
1992–1994 −9.49 4.41 2000–2002 −1.8
1994–1998 −0.73 −1.36 2002–2005 −6.14
1998–2000 −3.75 2.03 2005–2007 17.37
2000–2002 1.69 −7 2007–2008 −9.16
2002–2005 −1.99 0.00 2008–2010 −5.83
2005–2007 11.04 15.52 2007–2008 −8.52 −15.23 2008–2010 −9.49 −7.65
The urban part of the Cádiz unit (BP7) shows a slight ero-sional trend from 1956 to 1985 (Fig. 6a). This is followed by an accretionary period (12 m yr−1) from 1985 to 1992 and in the last few decades this area experiences gradual erosion. Southward, the natural section of the unit (BP8) presents a roughly stable net balance considering the shoreline position of the first (1956) and the last photograph (2010). It shows a progressive accretion, with a mean rate of 5.1 m yr−1
, after an erosional behaviour (−1.2 m yr−1) that occurs during the first period between photos (1956–1977).
Finally, Sancti Petri experiences a continuous erosion (BP9) along its coast with an average retreat rate of −1.7 m yr−1, which includes erosion rates from−1.8 to−9.2 and accretion rates between 0.3 and 17.4 m yr−1(Fig. 6b).
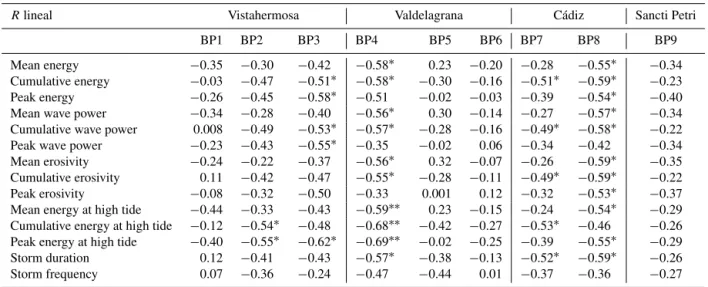
4.3 Relation between shoreline changes and storm parameters
The relation between shoreline changes and storm parame-ters, without taking into account the wave transformation and weighting, shows low correlations (r <0.5) for all the
geo-morphological units, except the exposed unit of Cádiz (BP8), where the storm duration and the cumulative parameters of energy, wave power and erosivity present significant corre-lations (r= −0.57,r= −0.56,r= −0.53 andr= −0.55 re-spectively).
cen-Table 4.Summary statistics of the correlations between shoreline changes and storm parameters (∗significance levels are
<95 %;∗∗ signif-icance levels are<99 %).
Rlineal Vistahermosa Valdelagrana Cádiz Sancti Petri
BP1 BP2 BP3 BP4 BP5 BP6 BP7 BP8 BP9
Mean energy −0.35 −0.30 −0.42 −0.58∗ 0.23 −0.20 −0.28 −0.55∗ −0.34 Cumulative energy −0.03 −0.47 −0.51∗ −0.58∗ −0.30 −0.16 −0.51∗ −0.59∗ −0.23 Peak energy −0.26 −0.45 −0.58∗ −0.51 −0.02 −0.03 −0.39 −0.54∗ −0.40 Mean wave power −0.34 −0.28 −0.40 −0.56∗ 0.30 −0.14 −0.27 −0.57∗ −0.34 Cumulative wave power 0.008 −0.49 −0.53∗ −0.57∗ −0.28 −0.16 −0.49∗ −0.58∗ −0.22 Peak wave power −0.23 −0.43 −0.55∗ −0.35 −0.02 0.06 −0.34 −0.42 −0.34 Mean erosivity −0.24 −0.22 −0.37 −0.56∗ 0.32 −0.07 −0.26 −0.59∗ −0.35 Cumulative erosivity 0.11 −0.42 −0.47 −0.55∗ −0.28 −0.11 −0.49∗ −0.59∗ −0.22 Peak erosivity −0.08 −0.32 −0.50 −0.33 0.001 0.12 −0.32 −0.53∗ −0.37 Mean energy at high tide −0.44 −0.33 −0.43 −0.59∗∗ 0.23 −0.15 −0.24 −0.54∗ −0.29 Cumulative energy at high tide −0.12 −0.54∗ −0.48 −0.68∗∗ −0.42 −0.27 −0.53∗ −0.46 −0.26 Peak energy at high tide −0.40 −0.55∗ −0.62∗ −0.69∗∗ −0.02 −0.25 −0.39 −0.55∗ −0.29 Storm duration 0.12 −0.41 −0.43 −0.57∗ −0.38 −0.13 −0.52∗ −0.59∗ −0.26 Storm frequency 0.07 −0.36 −0.24 −0.47 −0.44 0.01 −0.37 −0.36 −0.27
tral part of Valdelagrana (BP5), where the exponential corre-lation between shoreline changes and storm frequency shows better values (r= −0.60, p=0.01) than linear correlation (r= −0.44, p=0.09).
Analysing the correlation of storm parameters (Table 4), energy at high tide shows the highest values, with signifi-cant correlations in five of the BPs (BP2, BP3, BP4, BP7 and BP8). This is followed by wave power and energy, which present significant correlations with shoreline changes in four BPs (BP3, BP4, BP7 and BP8). Erosivity and storm duration show good results with three BPs (BP4, BP7 and BP8), and finally, storm frequency is not correlated with any of the BPs. On the other hand, the correlated variables are mostly cumulative parameters, followed by peak parameters and mean parameters.
On a site-by-site basis, statistical results in Vistahermosa show variable values along the unit, with the best connection appearing in the sandy beaches of BP2 with cumulative and peak energy at high tide (Fig. 7a) and in BP3 with cumula-tive and peak energy, cumulacumula-tive and peak wave power, and peak energy at high tide (Table 4). However, the variability related to storminess is low since none of these parameters exceed 50 %. On the contrary, shoreline changes in BP1 are not correlated with any of the storm parameters.
Valdelagrana is characterized by showing only strong cor-relations (BP4) with almost all storm parameters (Table 4) at its northern part, namely the mean and cumulative of energy, wave power, erosivity and energy at high tide, the peak of en-ergy at high tide and storm duration (Fig. 7b). Within these parameters, peak energy at high tide explains the variability of shoreline changes (48 %) better than the rest of the param-eters. Moreover, if periods with intensive shoreline accretion and low energy are removed from the record, the percentage
of shoreline changes explained by peak energy at high tide increases to 58 %.
Regarding the Cádiz area, rates of shoreline change in the urban part (BP7) are better correlated with the cumulative of energy, wave power, erosivity and energy at high tide, and with storm duration (Table 4), while the natural part of the unit (BP8) presents significant correlation with almost all pa-rameters except the peak of wave power, the cumulative of energy at high tide and storm frequency (Fig. 7c). The vari-ation of shoreline changes that is explained by the correlated parameters does not exceed 35 %; however, if periods with low energy and shoreline accretion are extracted from the data set, almost 50 % of shoreline changes are explained by storm duration (47 %) and cumulative erosivity (40 %). The rest of the correlated parameters increase slightly but explain less than 40 % of shoreline changes.
Finally, storm parameters at Sancti Petri sand spits (BP9) explain a small percentage of shoreline variability because the correlations are very poor (Table 4), with none of the parameters being statistically significant along the section (Fig. 7d).
5 Discussion
5.1 Storm record and shoreline changes
Figure 7.Examples of scatter plots of the correlation analysis for the study sites. Peak energy at high tide (EhtP) is shown for the Vistaher-mosa, Valdelagrana and Sancti Petri units, while storm duration is shown for the Cádiz unit.
different pattern, which is not related to NAO index. In fact, this parameter is mainly related to the tide state rather than to wave height.
Storm record along the periods between photographs (Fig. 4) also matches the years of high storm power index (i.e. the energy content of each storm) obtained by Rangel-Buitrago and Anfuso (2011b) in the Bay of Cádiz and by Almeida et al. (2011), who analyse storminess in Faro, Por-tugal, located in the western Gulf of Cádiz. Nevertheless, ac-cording to these studies, other years with a high storm record (1987 and 1989), which correspond to the sampling period 1985–1992 in the present work, are not reflected in the ob-tained results. This may be related to the fact that other years included in that period have a low storm power index (i.e. 1988, 1990, 1991 and 1992) (Rangel-Buitrago and Anfuso, 2011b).
Regarding rates of shoreline change, the present work evaluates new datasets by recording a wide variety of sholine trends along the Bay of Cádiz and confirms the re-sults of previous works. Significant accretionary and ero-sional rates have previously been reported in the northern and southern sections of Valdelagrana respectively (Benavente et al., 2006) due to the construction of jetties in the mouth of the Guadalete River and subsequent changes in the diffrac-tion control point of the headland–bay system. Other pat-terns, such as the stable trend along the natural part of Cádiz
and the erosional rates of Fuentebravía and Sancti Petri, have also been mentioned in previous works (Del Río et al., 2012).
5.2 Correlation analysis
Storm influence on coastal changes has been largely de-scribed in the literature (e.g. Houser et al., 2008; Castelle et al., 2015). The present work analyses this effect in different areas of the Bay of Cádiz. In general, there are better cor-relations between coastline changes and storm parameters in exposed areas (BP2 and BP3 of Vistahermosa and BP7 and BP8 of Cádiz) than in sheltered areas (BP5 and BP6 of Valde-lagrana spit barrier). However, Sancti Petri sand spit and the northern part of Valdelagrana (BP4) constitute an exception to this since the first one is an exposed unit and presents low correlation values, while the second one is a sheltered sec-tor and shows strong correlations between shoreline changes and storm parameters (Table 4). In the areas where corre-lations are significant, the effects of severe storms on sedi-ment budget can be mainly related to the offshore transport of beach sediments, which are mobilized back to the beach by fair weather waves during the following years (Benavente et al., 2013).
and BP7 of Cádiz, is explained by storms. Moreover, this proportion is increased when periods with intensive shore-line accretion and low energy are removed from the statisti-cal analysis. The shoreline rates of these periods are related to human interventions in some areas, such as the massive nourishment that was carried out in 1991 on the Cádiz urban beach (Muñoz-Perez et al., 2001), which could be respon-sible for the intensive accretion recorded between 1986 and 1992 in BP8.
The correlated variables are mostly cumulative and peak parameters, especially the energy and energy at high tide. This is due to the fact that in dissipative beach systems, like the ones described here, the total erosion is frequently asso-ciated with the largest storms because the recovery processes are slow and there is very little inter-storm recovery in gen-eral(Coco et al., 2014). Furthermore, it must be taken into consideration that in most cases only the extreme events (that are represented in cumulative and peak parameters) are capa-ble of promoting coastline retreat that persists for a duration of time long enough to be captured by the temporal resolution of aerial photos. When tide state is considered (i.e. parame-ters at high tide), the correlation values improve. This agrees with Del Río et al. (2012), who highlighted the importance of tide-related sea level variations in the Bay of Cádiz, where the percentage of surge variability is only a small fraction of the tidal variability, which actually controls the position of the waterline during storm events. In addition to this, on dis-sipative coasts like the study zone, with a relative tidal range (RTR) of 3 and a dimensionless fall velocity parameter ()
of 5.4, surf and swash processes that promote erosion dur-ing storms, are dominant only close to the sprdur-ing high water mark (Masselink and Short, 1993).
The fact that shoreline changes correlate with a specific parameter at each site shows that there is no relation between parameters and site characteristics. For instance, the urban unit of Vistahermosa (BP2) and the natural part of Cádiz (BP7), which have similar wave exposure, exhibit meaning-ful correlations with different parameters (Table 4), meaning that the behaviour of each unit is influenced by local factors. Regarding correlation results (Table 4) and analysing each unit one by one, the poor correlation of the northern part of Vistahermosa (El Almirante beach) (BP1) could be ex-plained by geological setting since cliffs are constituted by soft sands and marls. This vulnerable material is affected by hydric erosion and landslide processes (Del Río et al., 2009), so cliff retreat is continuous after each storm event, even dur-ing low-energy periods. On the other hand, the strong cor-relation obtained in BP2 and BP3 could be expected since this area is highly exposed to wave attack. However, storms explain only between 30 and 38 % of the shoreline variabil-ity in these areas and it may be because in the northern part of BP2 (Fuentebravia beach) storm contribution is over im-posed on the effects of the harbour at the Rota NATO base (located immediately northwest of the unit, see Fig. 1), which interrupts sediment transport southward and generates strong
downdrift erosion (Cooper et al., 2009). Consequently, at this beach nourishment works have repeatedly been carried out between 1992 and 2010, being replenished a total of twelve times (Muñoz-Perez et al., 2001, 2014).
In the central and southern sectors of Valdelagrana (BP5 and BP6), the low percentage of coastline variability ex-plained by storms and the low correlation values between shoreline changes and storm parameters suggest that, besides being protected from wave incidence, there are other fac-tors affecting shoreline changes during the analysed periods. As explained above, the most important interventions that triggered significant changes in this area include the build-ing of jetties in the Guadalete River mouth, which led to extreme erosion in the southernmost sector of Valdelagrana (Martínez-del-Pozo et al., 2001). Nevertheless, a certain cor-relation was expected in the BP5 of the unit, as it is the sector of Valdelagrana most exposed to wave attack and it is situated in the central part of the Z-bay (pivoting zone), where the lowest shoreline variation in rotational movement occurs and the net longshore transport is close to zero (Short and Mas-selink, 2001). Conversely, the strong correlation observed in the northern part of this area (BP4) indicates that this sector is more susceptible to storms than to the accretionary effects of the aforementioned jetties.
In the urban part of Cádiz (BP7), the low percentage of variability explained by storms is due to several factors. First, two groynes were constructed at the northern and southern limits of Santa Maria Beach (Fig. 6) in the 1980s and length-ened in the 1990s, in order to counteract beach sand loss. Later on (1997–1998) a submerged breakwater was built at a depth of 3 m in front of Santa Maria Beach. Finally, a to-tal of seven nourishments were performed between 1991 and 2010 along the whole urban beach (Muñoz-Perez et al., 2001, 2014). All these interventions have had an important impact on shoreline evolution regardless of storm events. As for the natural part of the Cádiz unit (BP8), it presents strong corre-lations with peak parameters and parameters that depend on storm duration (i.e. cumulative variables), so there is a clear relation between storminess and shoreline changes. How-ever, due to the proximity to the urban area located updrift, other factors could contribute to shoreline change, especially the aforementioned massive nourishment carried out at the urban beach in 1991, with a total volume of 2 000 000 m3 (Muñoz-Perez et al., 2001). In fact, if the period containing this intervention (1986–1992) is removed from the analysis, half of the shoreline variability is explained by storms.
It is clear from the above results that, apart from the re-lationship between storminess and shoreline change, shore-line position in the study area can be affected by other natu-ral factors, such as coastal bathymetry and orientation, geo-logical framework and hydrodynamic conditions. According to Del Río et al. (2013), in the external Bay of Cádiz the presence of subtidal rocky shore platforms along the coast plays an important role in influencing patterns of shoreline change (Fig. 1). Depending on their length and location, they produce erosion–accretion processes as they modify diffrac-tion and refracdiffrac-tion wave patterns. The effects of erosion could be shown in the Sancti Petri sand spit, in the north-ern part of BP9, because the headland at its northnorth-ernmost end (Figs. 1, 6b) would act as a natural groyne obstructing sand movement. Conversely, there are other areas that de-spite presenting rocky shore platforms have not recorded a clear erosion pattern. This occurs in the natural part of Cádiz (BP8), where the largest platform of the study area appears (Fig. 1). A reason for this could be that the gaps observed in the rocky platform cause variable behaviour, generating ero-sion where wave energy is concentrated and accumulation in the shadow areas. This effect is visible on the coastal mor-phology of BP8, such as the embayments of El Caido and La Leona (accretion–recession) (Fig. 6a).
On the contrary, stabilization or accumulation should be recorded next to Sancti Petri tidal inlet (BP9) and at the northern and southern ends of Vistahermosa (BP1 and BP2) since the platform located downdrift could act as a groyne capturing sand from longshore drift in both cases. Neverthe-less, both areas show an erosion pattern in the medium-term behaviour. In Vistahermosa this trend could be related to the sediment deficit provoked by the aforementioned jetties at the Rota NATO base, which in the northern area (El Almi-rante beach) would also be added to the above-mentioned weakness of the cliffs. Conversely, the erosion of the south-ern part of Sancti Petri (BP9) could be related to the dynam-ics of a sandy shoal that appears at the south of Punta del Bo-querón due to the longshore sediment transport and the com-plex tidal currents existing in this area (Del Río et al., 2013).
5.3 Considerations on the methodology
The methods used in the present work give a sense of how storm parameters contribute to shoreline evolution in the Gulf of Cádiz during the period of study. The success of shoreline change analysis depends fundamentally on the ac-curacy of photographs and the precision in measuring coastal changes (Moore, 2000). Image quality can also influence shoreline position, increasing alongshore variability shown by error bars in Figs. 5 and 6. On the other hand, selected shoreline proxies can be a source of error since the position of the high water line is affected by meteorological (wind and wave) conditions, tidal effects and beach seasonality. The latter is especially significant for the period between 1956 and 1976, because the first aerial photographs of the record
(1956) were taken in winter; this way, sections with strong seasonal differences in beach slope (Cádiz, Sancti Petri sand spit and Vistahermosa) (Del Río et al., 2013) have variable positions of the high water line. The remaining shorelines correspond to photographs taken during the summer, thus avoiding beach seasonality error. In addition to this, artificial nourishments carried out in the area also affect the position of the high water line. The most distinctive example is the above-mentioned massive replenishment performed in the urban beach of Cádiz, which caused a shoreline advance of approximately 80 m during the 1990s. Nevertheless and de-spite the considerations above, due to the need for a common shoreline proxy between the different study sites, the high water line was accepted as representative of shoreline posi-tion, in accordance with authors such as Crowell et al. (1997) and Gorman et al. (1998).
On the other hand, as previously mentioned, the sampling interval of photographs can increase uncertainty associated with this methodology. Short periods between photographs can produce overestimation of the rates of shoreline change (e.g. the accretion rate of 9.8 m yr−1 observed in BP3 of Vistahermosa between 1998 and 2000, Fig. 5a). Conversely, long periods between photographs tend to smooth the vari-ability of changes (Dolan et al., 1991; Mann et al., 2016), thus yielding lower rates (e.g. the erosion rate of−0.7 m yr−1 observed in BP7 of Cádiz between 1956 and 1976 (Fig. 6a).
Finally, it is important to remark that aerial photographs represent snapshots of the coastline; thus, storms occurring shortly before the photographs should have more impact on the coastline. This fact has been accounted for in the weight-ing procedure done in the present work, where a linear dis-tinction of 5 years has been considered, based on the tem-poral proximity of the storms to the photographs. Although there are slight differences in post-storm recovery processes between intermediate and dissipative beaches in the Bay of Cádiz, beach recovery takes years to occur (Benavente et al., 2013). Thus, this period of 5 years has been considered as representative in this respect. Moreover, as previously men-tioned, it is the mean sampling interval between consecutive photographs. In this sense, the weighting procedure has re-markably modified the results of correlations in long inter-vals (i.e. 1956–1976) while having a negligible effect during short intervals (i.e. 2000–2002 and 2005–2007).
6 Conclusions
In this work four beaches of the Bay of Cádiz with diverse characteristics of wave exposure and human development were analysed in order to assess the contribution of storms in recorded shoreline changes. In general, it has been found that although there is a correlation between shoreline changes and storm variables, the latter explain a low percentage of this variability as in most of the sites whereR2is lower than
0.5. However, it has been found that in some areas when pe-riods with intensive shoreline accretion and low energy are removed from the statistical analysis, their system variability is explained by storminess (i.e. northern part of Valdelagrana spit barrier and southern part of Cádiz). These periods coin-cide in the case of Cádiz with years when human interven-tions significantly altered natural shoreline behaviour.
The energetic parameters of the storms were found to be more correlated with shoreline changes at exposed areas than at embayed beaches. Tide consideration was decisive as sta-tistical results improved considerably. On the other hand, these storm-related rates of shoreline change were specific to a particular parameter at each site, which suggests that each area is influenced by local behaviour. The most strongly cor-related parameters were cumulative parameters (cumulative energy, wave power, erosivity and energy at high tide) and peak parameters (peak energy, erosivity and energy at high tide).
Finally, it is suggested that anthropogenic factors are the main forcing agents determining shoreline behaviour in the study area, together with other natural factors, such as ge-ological framework, which controls coastal bathymetry and orientation (e.g. the distribution of rocky shore platforms and sandy shoals along the study zone). However, even in the ab-sence of correlation between coastal changes and storm pa-rameters, storminess contributes to modulate shoreline reces-sion, with increasing erosion during periods when the num-ber of storms is higher.
This work highlights that in geomorphologically complex areas with variable types of uses and management plans, the response of the coast to storm events and patterns is not uni-form. Selected areas with different characteristics cover a wide range of behaviours and responses (more or less sen-sitive) to storm events. This relation between storminess and shoreline change can contribute to the prediction of short-and medium-term coastal variations. In this respect, further research will be focused on the analysis of short-term beach evolution, in order to assess the response rate of each site to specific storm events and compare it with the results obtained in this work.
7 Data availability
Aerial photographs and orthophotographs from the study area are directly downloadable at http://ws041. juntadeandalucia.es/medioambiente/dlidar/index.action.
Wave data are provided by Puertos del Estado under request at www.puertos.es/en-us/oceanografia/Pages/portus.aspx. Shoreline measurements and correlation results will be uploaded to the RODIN repository of the University of Cádiz (currently under negotiation).
Author contributions. María Puig undertook the analysis of the data and the preparation of the paper with contributions from all co-authors. Theocharis A. Plomaritis and Javier Benavente contributed to the analysis of wave climate and LR contributed to the analysis of shoreline rates.
Acknowledgements. This work is a contribution to the research group RNM-328 of the Andalusian Research Plan (PAI), the project RNM-6547 funded by the Regional Government of Andalusia and the projects GERICO (CGL 2011-25438) and ADACOSTA (CGL2014-53153-R) funded by the Spanish Ministry of Economy and Competitiveness. M. Puig was supported by the FPI grant (BES-2012-053175) associated with the project above. T.A. Plomaritis received funding through the RISC-KIT (Resilience-Increasing Strategies for Coasts–toolKIT) project, supported by the European Community’s Seventh Framework Programme through contract no. 603458. The authors thank Puertos del Estado for providing the wave data.
Edited by: P. Tarolli
Reviewed by: two anonymous referees
References
Almeida, L. P., Ferreira, Ó., Vousdoukas, M. I., and Dodet, G.: His-torical variation and trends in storminess along the Portuguese South Coast, Nat. Hazards Earth Syst. Sci., 11, 2407–2417, doi:10.5194/nhess-11-2407-2011, 2011.
Anderson, T. R., Frazer, L. N., and Fletcher C. H.: Transient and persistent shoreline change from a storm, Geophys. Res. Lett., 37, L08401, doi:10.1029/2009GL042252, 2010.
Anfuso, G., Domínguez, L., and Gracia, F. J.: Short and medium-term evolution of a coastal sector in Cadiz, SW Spain, Catena, 70, 229–242, 2007.
Barragán, J. M. and De Andrés, M.: Analysis and trends of the world’s coastal cities and agglomerations, Ocean Coast. Man-age., 114, 11–20, 2015.
Benavente, J., Gracia, F. J., and López-Aguayo, F.: Empirical model of morphodynamic beachface behaviour for low-energy mesoti-dal environments, Mar. Geol., 167, 375–390, 2000.
Benavente, J., Del Río, L., Gracia, F. J., and Martínez-del-Pozo, J. A.: Coastal flooding hazard related to storms and coastal evo-lution in Valdelagrana spit (Cadiz Bay Natural Park, SW Spain), Cont. Shelf Res., 26, 1061–1076, 2006.
Benavente, J., Del Río, L., Plomaritis, T. A., and Menapace, W.: Impact of coastal storms in a sandy barrier (Sancti Petri, Spain), J. Coast. Res., SI65, 666–671, 2013.
Pro-ceeding of the XIII Reunión Nacional de Geomorfología, 9–12 September 2014, Cáceres, Spain, 548–551, 2014.
Bertin, X., Bruneau, N., Breilh, J. F. O., Fortunato, A. B., and Karpytchev, M.: Importance of wave age and resonance in storm surges: The case Xynthia, Bay of Biscay, Ocean Model., 42, 16– 30, 2012.
Castelle, B., Marieu, V., Bujan, S., Splinter, K. D., Robinet, A., Sénéchal, N., and Ferreira, S.: Impact of the winter 2013–2014 series of severe Western Europe storms on a double-barred sandy coast: Beach and dune erosion and megacusp embayments, Geo-morphology, 238, 135–148, 2015.
Ciavola, P., Ferreira, O., Haerens, P., Van Koningsveld, M., Ar-maroli, C., and Lequeux, Q.: Storm impacts along European coastlines. Part 1: The joint effort of the MICORE and ConHaz Projects, Environ. Sci. Policy, 14, 912–923, 2011.
Coco, G., Senechal, N., Rejas, A., Bryan, K. R., Capo, S., Parisot, J. P., Brown, J. A., and MacMahan, J. H. M.: Beach response to a sequence of extreme storms, Geomorphology, 204, 496–501, 2014.
Cooper, J. A. G., Anfuso, G., and Del Río, L.: Bad beach manage-ment: European perspectives, Geol. Soc. Am. Bull., 460, 167– 179, 2009.
Cowell, P. J., Roy, P. S., and Jones R. A.: Simulation of large-scale coastal change using a morphological behaviour model, Mar. Geol., 126, 45–61, 1995.
Crowell, M., Douglas, B. C., and Leatherman, S.: On forecasting fu-ture US shoreline positions: a test of algorithms, J. Coastal Res., 13, 1245–1255, 1997.
Davidson, M. A., Splinter, K. D., and Turner, I. L.: A simple equi-librium model for predicting shoreline change, Coastal Eng., 73, 191–202, 2013.
Davis, R. A. and Hayes, M. O.: What is a wave-dominated coast?, Mar. Geol., 60, 313–329, 1984.
Dean, R. G. and Dalrymple, R. A.: Water Wave Mechanics for Engineers and Scientist, World Scientific Publishing, Singapore, 1991.
Del Río, L. and Gracia, F. J.: Error determination in the photogram-metric assessment of shoreline changes, Nat. Hazards, 65, 2385– 2397, 2013.
Del Río, L., Gracia, F. J., and Benavente, J.: Mass movements and cliff retreat along the SW Spanish coast, J. Coastal Res., SI56, 717–721, 2009.
Del Río, L., Plomaritis, T. A., Benavente, J., Valladares, M., and Ribera, P.: Establishing storm thresholds for the Spanish Gulf of Cádiz coast, Geomorphology, 143, 13–23, 2012.
Del Río, L., Gracia, F. J., and Benavente, J.: Shoreline change pat-terns in sandy coasts. A case study in SW Spain, Geomorphol-ogy, 196, 252–266, 2013.
Dissanayake, P., Brown, J., and Karunarathna, H.: Impacts of storm chronology on the morphological changes of the Formby beach and dune system, UK, Nat. Hazards Earth Syst. Sci., 15, 1533– 1543, doi:10.5194/nhess-15-1533-2015, 2015.
Di Stefano, A., De Pietro, R., Monaco, C., and Zanini A.: Anthro-pogenic influence on coastal evolution: A case history from the Catania Gulf shoreline (eastern Sicily, Italy), Ocean Coast. Man-age., 80, 133–148, 2013.
Dolan, R., Fenster, M. S., and Holme, S. J.: Temporal analysis of shoreline recession and accretion, J. Coastal Res., 7, 723–744, 1991.
Ferreira, Ó.: Storm groups versus extreme single storms: predicted erosion and management consequences, J. Coastal Res., SI42, 221–227, 2005.
Fletcher, C., Rooney, J., Barbee, M., Lim, S., and Richmond, B. M.: Mapping shoreline change using digital ortophotogrammetry on Maui, Hawaii, J. Coastal Res., SI38, 106–124, 2003.
Frazer, L. N., Anderson, T. R., and Fletcher, C. H.: Modeling storms improves estimates of long term shoreline change, Geophys. Res. Lett., 36, L20404, doi:10.1029/2009GL040061, 2009.
Gorman, L., Morang, A., and Larson, R.: Monitoring the coastal en-vironment. Part IV: Mapping, shoreline changes, and bathymetric analysis, J. Coastal Res., 14, 61–92, 1998.
Gracia, F. J., Del Río, L., Alonso, C., Benavente, J., and Anfuso, G.: Historical evolution and present state of the coastal dune systems in the Atlantic coast of Cadiz (SW Spain): palaeoclimatic and environ-mental implications, J. Coastal Res., SI48, 55–63, 2006. Guedes-Soares, C., Weisse, R., Carretero, J. C., and Alvarez, E.: A 40 years hindcast of wind, sea level and waves in European wa-ters, Proc. 21st International Conference on Offshore Mechanics and Arctic Engineering Engineering (paper OMAE2002-28604), ASME, Oslo, 2002.
Hapke, C. J., Kratzmann, M. G., and Himmelstoss, E. A.: Geomor-phic and human influence on large-scale coastal change, Geo-morphology, 199, 160–170, 2013.
Houser, C., Hapke, C., and Hamilton, S.: Controls on coastal dune morphology, shoreline erosion and barrier island response to ex-treme storms, Geomorphology, 100, 223–240, 2008.
Instituto Hidrográfico de la Marina: Anuario de mareas, Ministerio de Defensa, Madrid, 2014.
Jackson, D. W. T., Cooper, J. A. G., and Del Río, L.: Geological control of beach morphodynamic state, Mar. Geol., 216, 297– 314, 2005.
Kamphuis, J. W.: Introduction to coastal engineering and manage-ment. Advanced series on ocean engineering, World Scientific Publishing, Singapore, 16, 437 pp., 2000.
Kreibich, H., Van den Berg, J. C. J. M., Bouwer, L. M., Bubeck, P., Ciavola, P., Green, C., Hallegatte, S., Logar, I., Meyer, V., Schwarze, R., and Thieken, A. H.: Costing natural hazards, Na-ture Climate Change, 4, 303–306, 2014.
Mann, T., Bayliss-Smith, T., and Westphal, H.: A geomorphic in-terpretation of shoreline change rates on reef islands, J. Coastal Res., 32, 500–507, 2016.
Martínez-del-Pozo, J. A., Anfuso, G., and Gracia, F. J.: Recent evo-lution of a tidal delta in Cádiz Bay (SW Spain) due to human interventions, in: Proceedings of MEDCOAST’01, Hammamet, Tunisia, 1425–1433, 2001.
Masselink, G. and Short, A. D.: The effect of tide range on beach morphodynamics and morphology: A conceptual beach model, J. Coastal Res., 9, 785–800, 1993.
Masselink, G., Austin, M., Scott, T., Poate, T., and Russell, P.: Role of wave forcing, storms and NAO in outer bar dynamics on a high-energy, macro-tidal beach, Geomorphology, 22, 76– 93, 2014.
Masselink, G., Scott, T., Poate, T., Russell, P., Davidson, M., and Conley, D.: The extreme 2013/2014 winter storms: hydrody-namic forcing and coastal response along the southwest coast of England, Earth Surf. Proc. Land., 41, 378–391, 2016.
Moore, L. J.: Shoreline mapping techniques, J. Coastal Res., 16, 111–124, 2000.
Morton, R. A.: Factors controlling storm impacts on coastal barriers and beaches: a preliminary basis for near real-time forecasting, J. Coastal Res., 18, 486–501, 2002.
Muñoz-Perez, J. J., López de San Román-Blanco, B., Gutiérrez-Mas, J. M., Moren, L., and Cuena, G. J.: Cost of beach mainte-nance in the Gulf of Cadiz (SW Spain), Coast. Eng., 42, 143–153, 2001.
Muñoz-Perez, J. J., Román-Sierra, J., Navarro-Pons, M., da Graça Neves, M., and del Campo, J. M.: Comments on ”Confirma-tion of beach accre”Confirma-tion by grain-size trend analysis: Camposoto beach, Cádiz, SW Spain” by E. Poizot et al. (2013), Geo-Mar. Lett., 34, 75, doi:10.1007/s00367-013-0344-0, 2014.
Plomaritis, T. A., Benavente, J., Laiz, I., and Del Río, L.: Variability in storm climate along the Gulf of Cadiz: the role of large scale atmospheric forcing and implications to coastal hazards, Clim. Dynam., 45, 2499–2514, 2015.
Puertos del Estado: Extremos máximos de oleaje (altura signif-icante). Boya de Cádiz, periodo 1983–2005, Banco de Datos Oceanográficos de Puertos del Estado, Madrid, 2006.
Rangel-Buitrago, N. and Anfuso, G.: Morphological changes at Levante Beach (Cadiz, SW Spain) associates with storm events during the 2009–2010 winter season, J. Coastal Res., SI64, 1886–1890, 2011a.
Rangel-Buitrago, N. and Anfuso, G.: Coastal storm characterization and morphological impacts on sandy coasts, Earth Surf. Proc. Land. 36, 1997–2010, 2011b.
Reyes, J., Martins, J., Benavente, J., Ferreira, O., Gracia, F., Alveirinho-Dias, J., and López-Aguayo, F.: Gulf of Cadiz beaches: a comparative response to storm events, Boletín-Instituto Español de Oceanografía, 15, 221–228, 1999.
Ribera, P., Gallego, D., Pena-Ortiz, C., Del Rio, L., Plomaritis, T. A., and Benavente, J.: Reconstruction of Atlantic histori-cal winter coastal storms in the Spanish coasts of the Gulf of Cadiz, 1929–2005, Nat. Hazards Earth Syst. Sci., 11, 1715–1722, doi:10.5194/nhess-11-1715-2011, 2011.
Short, A. D. and Masselink, G.: Embayed and structurally con-trolled beaches, in: Handbook of Beach and Shoreface Morpho-dynamics, edited by: Short, A. D., John Wiley& Sons, Chich-ester, 230–250, 2001.
Stive, M. J. F., Aarninkhof, S. G. J., Hamm, L., Hanson, H., Larson, M., Wijnberg, K. M., Nicholls, R. J., and Capobianco, M. Vari-ability of shore and shoreline evolution, Coast. Eng., 47, 211– 235, 2002.
Thieler, E. R., Himmelstoss, E. A., Zichichi, J. L., and Ergul, A.: Digital Shoreline Analysis System (DSAS) Version 4.0 – An Ar-cGIS Extension for Calculating Shoreline Change, Woods Hole, Massachusetts, U.S. Geological Survey Open-File Report, 2008– 1278, 2009.