in
Produc t ion Engine e ring
2012, No 3 (7), pp 12‐17
Abstract:
For the calcula on of emission of air pollutants generated by ships in port it is needed, besides other things, knowledge of the load factor of marine auxiliary engines. The value of this factor in the reports of global organiza ons, dealing with air pollutants emission from ships, is determined mainly on interviews with chief engineers on board. The paper presents the method of assessment of this factor based on iden fica on tests of marine electric power systems carried out by the authors. The obtained in this way results are compared with the values given in the global organiza ons reports.
ASSESSMENT
OF
MARINE
AUXILIARY
ENGINES
LOAD
FACTOR
IN
PORTS
INTRODUCTION
The load factor of marine auxiliary engines is one of the basic informa on for the calcula on of air pollutants emis‐ sion generated by ships. The load factors for different types of ships, determining the results of emission calcula ons, are provided in various reports with greater or less approxi‐ ma on.
For auxiliary engines, reports of the world's organiza‐ ons, dealing with air pollutants emissions, present state‐ ments of load factors depending on the type of vessel and opera ng condi ons [1, 2, 3]. These statements are pre‐ pared on the basis of data collected from registers of ships, log book records and interviews with captains of ships, chief engineers and officers of pilot sta ons.
Table 1 provides a summary of auxiliary engines to the main engine power ra os and auxiliary engine load factors in port – hoteling mode (based on the [2]).
Determined in such a manner auxiliary engines load factors are not very precise. This is mainly due to the lack of empirical data on real opera ng load values of marine elec‐ tric power systems [4]. The data in the various types of re‐ ports sent periodically by chief engineers to ship owning companies technical services, supervising the opera on of
ships, are too residual, as the authors wrote in the paper [5]. In addi on, the load of marine genera ng sets read from power meters built in Main Switch Board (MSB) or marine power plant alarm system control panel in Engine Control Room (ECR) is not equivalent to the load of auxilia‐ ry engines. The load of auxiliary engine must be calculated taking into account the engine excess power factor to gen‐ erator and the efficiency of generator. Unfortunately, in the case of data collected by the ship classifica on socie es, there is no informa on on the efficiency of generators, the auxiliary engines excess power factors to generators or auxiliary engines con nuous power, but only a nominal value of genera ng sets ac ve power, understood as the ac ve power of generators. Therefore, auxiliary engines load factors given in table 1 corresponds more to the load factor of genera ng sets (generators).
Therefore, the authors developed a method for deter‐ mining the load factors of marine auxiliary engines in ports in hoteling mode for different types of ships based on iden‐
fica on tests of marine electric power systems load. De‐ scrip on of the method and the results are presented be‐ low.
Grzegorz NICEWICZ, Dariusz TARNAPOWICZ Mari me University of Szczecin
Key words: air pollutants emissions from ships in ports, auxiliary engines load factor
Ship Type Average Propulsion Engine (kW)
Average Auxiliary Engines
Auxiliary to Propul‐ sion Ra o
Auxiliary Engine Load Factor in port – hotel‐
ing mode
Power Each (kW) Total Power (kW) Engine Speed
Auto Carrier 10700 983 2850 Medium 0.266 0.24
Bulk Carrier 8000 612 1776 Medium 0.222 0.22
Container Ship 30900 1.889 6800 Medium 0.220 0.17
Passenger Ship 39600 2.340 11000 Medium 0.278 0.64
General Cargo 9300 612 1776 Medium 0.191 0.22
Miscellaneous 6250 580 1.680 Medium 0.269 0.22
RORO 11000 983 2850 Medium 0.259 0.30
Reefer 9600 975 3900 Medium 0.406 0.34
Tanker 9400 735 1985 Medium 0.211 0.67
Therefore, the authors developed a method for deter‐ mining the load factors of marine auxiliary engines in ports in hoteling mode for different types of ships based on iden‐ fica on tests of marine electric power systems load. De‐ scrip on of the method and the results are presented be‐ low.
IDENTIFICATION TESTS OF MARINE ELECTRIC POWER SYS‐ TEMS LOAD
The reasons for undertaking the iden fica on test of marine electric power systems load and the problems ari‐ sing from their conduct were widely described by authors in [4]. In connec on with the implementa on of the inter‐ na onal project: BSR InnoShip: Bal c Sea Coopera on for Reducing Emissions ship and port through knowledge and innova on in the Mari me University of Szczecin, there was a need to use the results of iden fica on tests of mari‐ ne electric power systems load to determine the empirical load factor of marine auxiliary engines.
In the Mari me University of Szczecin the iden fica on tests of marine electric power systems (MEPS) load were carried out on various types of transport vessels opera ng by foreign and domes c ship‐owners. The study were con‐ ducted in the years 2002‐2007, registering the load of MEPS in all typical opera ng states for a given ship and in different condi ons of climate and weather. There were analyzed 14 types of vessels, that had sister units, built in the years 1977‐2005: three of them in the years 1977‐1980, two in the years 1980‐1990, four in the period from 1990 to 2000 and five a er 2000. Ships built before 1977 and cove‐ red by iden fica on tests of marine electric power systems load were not included in the analysis, although they are currently s ll in opera on, assuming that the age of the ship may not exceed 30 years. The vessels were built in shipyards in Bulgaria, China, France, Japan, Yugoslavia, South Korea, Germany, Norway, Poland and Taiwan.
14 types of vessels includes six various size container ships (7500 TEU‐1100 TEU), two types of semicontainer ships, three types of bulk carriers and one type of general cargo vessel, tanker DP2 and chemical tanker. Total length of the vessels ranges from 72 m to 300 m. Power ra ng of main engines ranges from 1 470 kW to 69 440 kW. As the main propulsion unit on ten types of vessels was used a low
‐speed engine and a medium speed engine on remaining four vessels. As a propeller in ten cases was used fixed screw propeller and in the other cases control pitch propel‐ ler. Direct drive of propeller was used on nine types of ships and indirect drive on the other five (four geared‐down drives and one hydrodynamic coupling). In addi on, one of the vessels was equipped in emergency propulsion by using sha generator as an electric motor.
Eleven ships were equipped with thrusters. In most ca‐ ses (nine ships) there was installed a single bow thruster. Only on two types of vessels (one of the container ships and tanker DP2) there were bow and stern thrusters. On ten ships the thrusters drive was realized by means of elec‐ tric motor. In one case the thruster was equipped with hy‐ draulic drive.
Some of the analyzed types of ships were equipped with cargo handling equipment, allowing the handling of cargo at ports without an adequate technological background.
Con nuous recording of changes in MEPS load on ves‐ sels not equipped with modern computer systems aided
marine power plant opera on is impossible. O en, even if such a system exists, access to the data recorded is limited. On older systems not equipped with hard drives, like HMS 3000, the current load value is displayed on the control panel, but is not stored in system memory. Systems with built‐in hard drives do not allow an ordinary user – an engi‐ neer – to copy data directly from hard drive to removable media, but they required for this opera on registered pas‐ sword of system serviceman. Due to the fact that at the same me, the system records a number of significant pa‐ rameters in marine power plant opera on, even with to‐ day's hard drive capacity, hard drive free space is rapidly filling. In prac ce, to avoid periodic replacement of hard drives, collected data is automa cally reset at specified intervals.
For these reasons, it is necessary to simplify MEPS load registra on. MEPS load changes during the established hours can be treated as realiza ons of the stochas c pro‐ cess and characterized by one specific value – the maxi‐ mum consumed power during par cular hour. The maxi‐ mum power demand must be realized by genera ng sub‐ system of MEPS, otherwise a cargo ship will not be able to implement all the tasks. Selec ng any other single load value of MEPS, registered during considered realiza ons of the stochas c process (except the minimum value), involves only general informa on about the changes of power demand, because it should be treated as the cur‐ rent value of the load. However, even the es ma on of the average load during the established hour on the basis seve‐ ral or tens current values of the load or knowledge of the minimum and the maximum values of power demand se‐ ems to be burdened with significant error. This is due to irregular process of load changes for the established hour.
The value of the maximum power demand in MEPS oc‐ curring in consecu ve opera ng hours is a random variable. Such a defini on of the random variable corresponds to the concept of the peak load Ps for a given hour, commonly
used in the power industry. Assignment of this random variable to consecu ve specified me intervals (established opera ng hours) is known as the empirical me series [6].
Selec on of an hour as a me interval seems to be jus ‐ fied for several prac cal reasons. First of all, it allows to conduct observa ons of the load by an Engine Room crew member in a way that does not impede the process of ma‐ rine power plant opera on and is quite comfortable for the observer, especially when it is not possible to use automa‐
c load records due to lack of advanced monitoring system. It also allows to track and present the dynamics of the load changes during the following hours of observa on and ena‐ bles assignment of consecu ve opera ng hours to the re‐ spec ve occurred opera ng states, that have the greatest impact on the load of MEPS. In the steady opera ng states, during the sea voyage, mooring at a port without a usage of marine handling equipment, dri , or stop at the anchorage, the load of MEPS does not change drama cally in the follo‐ wing hours, as opposed to dynamic opera ng states, when the rapid changes in the load take place due to usage of thrusters or ship‐handling equipment and switching on the other large power receivers.
observed peak load. Therefore, it is necessary to round the dura on of the vessel opera ng states to the full hours. Due to the fact, that the me limits of opera ng states are in prac ce contractual, it does not cause large errors, espe‐ cially if usually the period of observa on of MEPS loads lasts a few months and the number of hours varies from several hundred to several thousand.
Moreover, when considering the empirical me series, it is impossible to give precise moments of switching on and off genera ng sets or sha generators from the main bus bars of MSB. Thus, there is also a need to round their ope‐ ra ng me to the full hours.
The adopted methodology does not allow to analyze the dynamic phenomena occurring in MEPS during the synchro‐ niza on of generators and load‐sharing between genera ng sets in the parallel opera ng mode.
For the measurements of the ac ve power, generated by marine electric power sta on, it was used the measuring apparatus, that was standard equipment of the vessel. It is covered by the supervision of classifica on socie es and meets the imposed requirements. Moreover, in the case of modern ships, it meets the requirements of full redundancy of measurements. The value of the current load of genera‐
ng sets can be recorded by means of power meters loca‐ ted in ECR, local control panels of genera ng sets and on the bridge.
DETERMINATION OF THE AUXILIARY ENGINES LOAD FAC‐ TOR ON THE BASIS OF THE IDENTIFICATION TESTS OF MA‐ RINE ELECTRIC POWER SYSTEMS LOAD
The values of par cular genera ng set load, defined as ac ve power measured on the MSB bus bars, were given as frac ons of the generator rated ac ve power. To determine the auxiliary engine load factor it is necessary to take into account the efficiency of the generator and the auxiliary engine excess power factor to the rated ac ve power of the generator.
When ship stays in port, generally only one genera ng set is in stand‐alone opera on. Although in case of cargo handling opera on, carried out by means of ship’s cargo handling facili es, the parallel opera on of at least two genera ng sets is needed. The empirical distribu on of ge‐ nera ng sets load, obtained during stand‐alone opera on in ports, for ships in the study, were presented by means of Box‐and‐Whisker plots on fig. 1. In the case of vessels with genera ng sets of different rated ac ve power, fig. 1 shows the distribu ons for genera ng sets of higher rated output (GS HRO), and fig. 2 shows the distribu ons for genera ng sets of lower rated output (GS LRO).
Due to the illustra on of the achieved loads distribu‐ ons of the genera ng sets by means of Box‐and‐Whisker plot introduced by Tukey in 1979 it is easy to compare their measures of loca on, dispersion and asymmetry, that is their minimal and maximal values, median and the upper and lower quar les. The diversity of values of the peak load of the genera ng sets is es mated by means of comparing the length of four consecu ve segments defining 25% of the registered peak load value. The variety of 50% of the most typical load values is proved by the box height of the plot adequate to the inter‐quar le range. But asymmetry of the whole distribu on is evaluated by comparing so called whiskers. If the upper whisker is longer than the bo om one the distribu on is characterized by the right‐hand side asymmetry and analogically, if the bo om whisker is longer than the upper one the distribu on has le ‐hand side asymmetry. Asymmetry among 50% of the most typical peak load values is assessed due to the analysis of median loca on. If the median is closer to the upper (third) quar‐
le, represented by the upper side of the Box‐and‐Whisker plot the distribu on of the peak loads in the middle part is le ‐hand asymmetric and analogically, if the median is clos‐ er to the bo om (first) quar le represented by the bo om side of the Box‐and‐Whisker plot the distribu on of the peak loads in the middle part is right‐hand asymmetric.
Fig. 2. The empirical distribu ons of genera ng sets of lower rated output load, obtained during stand‐alone opera on in ports, pre‐ sented by means of Box‐and‐Whisker plots
The empirical distribu ons of genera ng sets peak load, presented in fig. 1 and 2, were the basis for the analysis of auxiliary engines load, discussed later in this work.
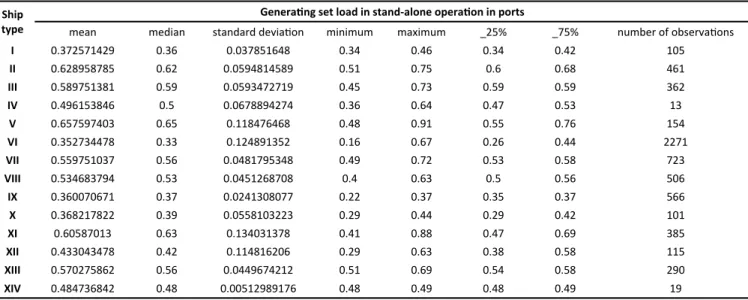
The sta s cs of genera ng sets load distribu ons are presented in table 2, and the sta s cs for genera ng sets of lower rated output are presented in table 3.
Genera ng subsystems of MEPS on ships in the study differ significantly in auxiliary engine excess power to rated
ac ve power of generator. Auxiliary engine excess power factor to generator (αNM) ranges from 1.05 to 1.62. The lowest values of the factor were recorded in ships built a er 2000. A detailed lis ng of the values of the factor we‐ re summarized in table 4. In case of ships, where more than one type of genera ng set was installed, respec vely more than one value of the factor was given in table 4.
Ship type
Genera ng set load in stand‐alone opera on in ports
mean median standard devia on minimum maximum _25% _75% number of observa ons
I 0.372571429 0.36 0.037851648 0.34 0.46 0.34 0.42 105
II 0.628958785 0.62 0.0594814589 0.51 0.75 0.6 0.68 461
III 0.589751381 0.59 0.0593472719 0.45 0.73 0.59 0.59 362
IV 0.496153846 0.5 0.0678894274 0.36 0.64 0.47 0.53 13
V 0.657597403 0.65 0.118476468 0.48 0.91 0.55 0.76 154
VI 0.352734478 0.33 0.124891352 0.16 0.67 0.26 0.44 2271
VII 0.559751037 0.56 0.0481795348 0.49 0.72 0.53 0.58 723
VIII 0.534683794 0.53 0.0451268708 0.4 0.63 0.5 0.56 506
IX 0.360070671 0.37 0.0241308077 0.22 0.37 0.35 0.37 566
X 0.368217822 0.39 0.0558103223 0.29 0.44 0.29 0.42 101
XI 0.60587013 0.63 0.134031378 0.41 0.88 0.47 0.69 385
XII 0.433043478 0.42 0.114816206 0.29 0.63 0.38 0.58 115
XIII 0.570275862 0.56 0.0449674212 0.51 0.69 0.54 0.58 290
XIV 0.484736842 0.48 0.00512989176 0.48 0.49 0.48 0.49 19
Table 2 The sta s cs of genera ng sets load distribu ons obtained for stand‐alone opera on in ports
Table 3 The sta s cs of genera ng sets load distribu ons obtained for stand‐alone opera on in ports (for genera ng sets of lower rated out‐
put – GS LRO)
Ship type
Genera ng set load in stand‐alone opera on in ports – GS LRO
mean median standard devia on minimum maximum _25% _75% number of observa ons
I 0.604823944 0.62 0.075277841 0.43 0.78 0.59 0.64 284
In order to determine the auxiliary engine load factor, it is necessary to take into account the efficiency of the gen‐ erator and the auxiliary engine excess power factor to rated ac ve power of the generator in the individual genera ng set. This requires the knowledge of the technical data of auxiliary engines and generators in genera ng sets. Assum‐ ing the efficiency of generators ƞG=0,95 [7], auxiliary engine load factor is given by formula:
where:
LFAE – load factor of auxiliary engine,
LFGS – load factor of genera ng set (generator), ƞG – efficiency of generator (0,95),
αNM – auxiliary engine excess power factor to generator.
As the load factor of the genera ng set (generator) LFGS was proposed the value of mean or median presented in table 2 and 3. By using the formula (1) auxiliary engine load factor can be now calculated. Calculated in that way the empirical values of the auxiliary engine load factor were presented in table 5 and 6.
∙ (1)
Table 4 Auxiliary engine excess power factor (αNM) to ac ve power of generator in genera ng sets on ships covered by iden fica on tests of
MEPS load
Ship type Year of built Auxiliary engine excess power factor to generator
I ‐ container ship 7500 TEU 2004 1.05
1.05
II ‐ container ship 7500 TEU 2005 1.05
1.05
III ‐ container ship 5500 TEU 1999 1.40
IV ‐ container ship 3050 TEU 2001 1.05
V ‐ container ship 2200 TEU 2003 1.06
VI ‐ container ship 1100 TEU 1982 1.21
VII ‐ semicontainer ship 1986 1.62
VIII ‐ semicontainer ship 1979 1.25
IX ‐ bulk carrier 1993 1.60
X ‐ bulk carrier 2003 1.10
XI ‐ bulk carrier 2000 1.09
XII ‐ general cargo vessel 1979 1.46
XIII ‐ tanker DP2 1993 1.07
XIV ‐ chemical tanker 1979 1.11
1.26
Table 5 Auxiliary engine load factor in port on ships covered by iden fica on tests of MEPS load
Auxiliary engine load factor in port – LFAE
Ship type mean median
I ‐ container ship 7500 TEU 0.374 0.361
II ‐ container ship 7500 TEU 0.631 0.622
III ‐ container ship 5500 TEU 0.443 0.444
IV ‐ container ship 3050 TEU 0.497 0.501
V ‐ container ship 2200 TEU 0.653 0.645
VI ‐ container ship 1100 TEU 0.307 0.287
VII ‐ semicontainer ship 0.364 0.364
VIII ‐ semicontainer ship 0.450 0.446
IX ‐ bulk carrier 0.237 0.243
X ‐ bulk carrier 0.352 0.373
XI ‐ bulk carrier 0.585 0.608
XII ‐ general cargo vessel 0.312 0.303
XIII ‐ tanker DP2 0.561 0.551
XIV ‐ chemical tanker 0.460 0.455
Auxiliary engine of lower rated output load factor in port – LFAE
Ship type mean median
I ‐ container ship 7500 TEU 0.606 0.622
II ‐ container ship 7500 TEU 0.596 0.571
For small values of the auxiliary engine excess power factor αNM (1.05‐1.10), i.e. when the diesel engine rated power was fairly well adjusted to the rated ac ve power of generator in genera ng set and with efficiency of generator at 0.95, it can be assumed that the engine load is equal to the generator load.
If there is a need to express the auxiliary engine load factor in percent of its rated power, then the formula (1) takes the form:
and the values given in tables 5 and 6 must be mul plied by 100.
CONCLUSIONS
Presented in table 5 and 6, the auxiliary engine load factors in port for ships covered by iden fica on tests of marine electric power system load, are higher than the val‐ ues given in table 1. However, it is necessary to note that the values given in table 1 were analyzed sta s cally for a big number of similar units, while the data in tables 5 and 6 relate to specific individual ships or sister ships. These fac‐ tors may be higher due to the usage of the ship’s cargo han‐ dling equipment in ports, which some of the analyzed ships were equipped with.
The proposed method for determining the auxiliary en‐ gines load factors in ports is certainly more reliable than the methods of data collec on based on interviews with chief engineers. In the long me perspec ve, access to data on genera ng sets load will be facilitated with the use of universal already on board the satellite communica ons and computer systems for monitoring marine power plant opera on, including marine electric power system. With the implementa on of the relevant administra ve rules, port authori es would automa cally receive data from a ship on genera ng sets load and fuel consump on, while
the ship stays in port, and with knowledge of the genera‐ tors efficiency and the values of auxiliary engines excess power factors to generators, precisely define the actual auxiliary engines load factors and emissions of air pollu‐ tants, which are generated.
REFERENCS
[1] European Commission: Quan fica on of emissions from ships associated with ship movements between ports in the European Community. Final Report. Entec UK Limited. July 2002.
[2] U.S. Environmental Protec on Agency: Current Meth‐ odologies in Preparing Mobile Source Port‐Related Emission Inventories. Final Report. Prepared by IFC INTERNATIONAL. April 2009.
[3] Dalsøren S. B., Eide M.S., Endresen Ø., Mjelde A., Gravir G., Isaksen I.S.A.: Update on emissions and en‐ vironmental impacts from the interna onal fleet of ships. The contribu on from major ship types and ports. Atmospheric Chemistry and Physics Discussions (ACPD). 8, 2008. s. 18323‐18384.
[4] Matuszak Z., Nicewicz G.: Assessment of Hitherto Ex‐ is ng Iden fica on Tests of Marine Electric Power Systems Loads. Polish Journal of Environmental Stud‐ ies. Vol. 18, No. 2A, 2009, pp 110‐116.
[5] Matuszak Z., Nicewicz G.: Ocena obciążeń okrętowych systemów elektroenergetycznych na podstawie da‐ nych eksploatacyjnych w dokumentach okrętowych. SYSTEMS Journal of Transdisciplinary Systems Science. Vol. 13, Special Issue 2/2, 2008, pp 34‐39.
[6] Matuszak Z., Nicewicz G.: Wykorzystanie szeregów czasowych do analizy obciążeń izolowanych systemów elektroenergetycznych. Ekonomika i Organizacja Przedsiębiorstwa. Nr 6 (701), 2008. s. 92.
[7] Cichy, M., Kowalski, Z., Maksimow, J.I., Roszczyk, S.: Statyczne i dynamiczne własności okrętowych zespo‐
łów prądotwórczych. Wydawnictwo Morskie. Gdańsk 1976.
∙ ∙ % (2)
Artykuł w polskiej wersji językowej dostępny na stronie internetowej czasopisma.
The ar cle in Polish language version available on the web‐ site of the journal
dr inż. Grzegorz Nicewicz Mari me University of Szczecin Faculty of Mari me Engineering Department of Technical Mechanics
ul. Wały Chrobrego 1‐2, 70‐500 Szczecin, POLAND e‐mail: g.nicewicz@am.szczecin.pl
dr inż. Dariusz Tarnapowicz Mari me University of Szczecin Faculty of Mari me Engineering
Department of Marine Electrical Engineering and Electronics ul. Wały Chrobrego 1‐2, 70‐500 Szczecin, POLAND
![Table 1 provides a summary of auxiliary engines to the main engine power ra os and auxiliary engine load factors in port – hoteling mode (based on the [2])](https://thumb-eu.123doks.com/thumbv2/123dok_br/18137597.326044/1.910.62.823.1019.1215/table-provides-summary-auxiliary-engines-auxiliary-factors-hoteling.webp)