TCD
7, 2007–2028, 2013Spatial-temporal dynamics of chemical
composition of surface snow
T. V. Khodzher et al.
Title Page
Abstract Introduction
Conclusions References
Tables Figures
◭ ◮
◭ ◮
Back Close
Full Screen / Esc
Printer-friendly Version
Interactive Discussion
Discussion
P
a
per
|
Dis
cussion
P
a
per
|
Discussion
P
a
per
|
Discussio
n
P
a
per
|
The Cryosphere Discuss., 7, 2007–2028, 2013 www.the-cryosphere-discuss.net/7/2007/2013/ doi:10.5194/tcd-7-2007-2013
© Author(s) 2013. CC Attribution 3.0 License.
Geoscientiic Geoscientiic
Geoscientiic Geoscientiic
Open Access
The Cryosphere
Discussions
This discussion paper is/has been under review for the journal The Cryosphere (TC). Please refer to the corresponding final paper in TC if available.
Spatial-temporal dynamics of chemical
composition of surface snow in East
Antarctic along the transect Station
Progress-Station Vostok
T. V. Khodzher1, L. P. Golobokova1, Y. A. Shibaev2, V. Y. Lipenkov2, and J. R. Petit3
1
Limnological Institute SB RAS, Irkutsk, Russia 2
Arctic Antarctic Research Institute, St. Petersburg, Russia 3
Laboratory of Glaciology and Environmental Geophysics, Grenoble, France
Received: 27 February 2013 – Accepted: 11 March 2013 – Published: 15 May 2013
Correspondence to: T. V. Khodzher ([email protected])
TCD
7, 2007–2028, 2013Spatial-temporal dynamics of chemical
composition of surface snow
T. V. Khodzher et al.
Title Page
Abstract Introduction
Conclusions References
Tables Figures
◭ ◮
◭ ◮
Back Close
Full Screen / Esc
Printer-friendly Version
Interactive Discussion
Discussion
P
a
per
|
Dis
cussion
P
a
per
|
Discussion
P
a
per
|
Discussio
n
P
a
per
|
Abstract
This paper presents data on chemical composition of the Antarctic snow sampled dur-ing the 53rd Russian Antarctic Expedition (RAE, 2008) along the first tractor traverse (TT) from Station Progress to Station Vostok (East Antarctica). Snow samples were obtained from the cores drilled at 55.3, 253, 337, 369, 403, 441, 480, 519, 560, 618, 5
819, and 1276 km from Station Progress. Data on horizontal and deep distribution of chemical components in the snow provide evidence of spatial and temporal variations of conditions for the snow cover formation along the transect under study. Sea salt was the main source for chemical composition of snow cover near the ice edge. Concen-trations of marine-derived components decreased further inland. A hypothesis was put 10
forward that some ions in the snow cover of the central part of East Antarctica were likely to be of continental origin. Elevated concentrations of sulphate ions of continental origin were recorded in some profiles of the transect at a depth of 130–150 cm which was attributed to buried signals of the Pinatubo volcano eruption (1991).
1 Introduction
15
Snow cover in Antarctica is a distinctive indicator of the current state of the environ-ment. Chemical analysis of snow composition shows distinct layers with traces of diff er-ent natural and technogenic sources (e.g. sea salt, continer-ental dust, volcano eruptions, forest fires, emissions from different heat sources, metallurgic enterprises, transport, etc.). Antarctica is supposed not to be subject to global transfer of impurities due to 20
its remoteness and isolation by a water filter for thousands of kilometres from other continents (Legrand et al., 1988). Sea salt is a dominant contributor to the chemical snow composition in Antarctica. Concentrations of Na+ and other ions in the fresh snow samples collected on the Terra Nova coast in East Antarctica are close to the components in the sea-water (Prodi et al., 2008). Spatial variations of incoming compo-25
TCD
7, 2007–2028, 2013Spatial-temporal dynamics of chemical
composition of surface snow
T. V. Khodzher et al.
Title Page
Abstract Introduction
Conclusions References
Tables Figures
◭ ◮
◭ ◮
Back Close
Full Screen / Esc
Printer-friendly Version
Interactive Discussion
Discussion
P
a
per
|
Dis
cussion
P
a
per
|
Discussion
P
a
per
|
Discussio
n
P
a
per
|
collected along the 350 km transect from the shelf glacier edge (Dronning Maud Land) decreased with the increase of distance from the coast by about 64 %/100 km (K ¨ark ¨as et al., 2005). There are numerous factors affecting chemical composition of the Antarc-tic snow: width, distance from the coast, relief, seasonal variability, etc. (Legrand et al., 1988; Cincinelli et al., 2001; Bertle et al., 2005; Udisti et al., 2005). Compounds may 5
penetrate further inland together with fine-dispersed aerosols and acid forming gases. Fine aerosol fraction prevails among other size fractions contributing 86 % of the ionic budget. High content of sulphate and elevated acidity are recorded in this fraction (Pic-cardi et al., 1996; Udisti et al., 1999; Cincinelli et al., 2001; Udisti et al., 2005). The most probable sources of sulphate (SO2−
4 ) are continental or stratospheric (Delmas et
10
al., 1982; Legrand et al., 1988; Zielinski et al., 1997). Elevated concentrations of non-sea-salt sulphate (nss-SO2−
4 ) are registered in the snow layers with buried signals of
volcano eruptions (Legrand et al., 1988; Zielinski et al., 1997). Studies performed on James Ross Island revealed frequent formation of hydrochloric acid in the atmosphere (Aristarain and Delmas, 2002).
15
Parker et al. (1982) gave detailed description of sources and mechanisms explaining fluctuations of NO−
3 concentrations in the Antarctic snow. Cyclicity was determined in
the variations of this ion content with the same periodicity (11, 22, and 66 yr) which is characteristic of variability in solar activity and intensity of aurora polaris (Olson, 1980). Studies on chemical composition of the snow cover performed at different distances 20
from the continent margin allow the researchers to analyse factors affecting the for-mation of snow cover in Antarctica and to specify rates of snow accumulation. The analysis of vertical profiles of snow thickness makes it possible to trace variability of these factors within time scales. The first detailed studies of the snow samples (up to 150 cm of the snow core) collected along the track traverse (TT) from Station Progress 25
TCD
7, 2007–2028, 2013Spatial-temporal dynamics of chemical
composition of surface snow
T. V. Khodzher et al.
Title Page
Abstract Introduction
Conclusions References
Tables Figures
◭ ◮
◭ ◮
Back Close
Full Screen / Esc
Printer-friendly Version
Interactive Discussion
Discussion
P
a
per
|
Dis
cussion
P
a
per
|
Discussion
P
a
per
|
Discussio
n
P
a
per
|
2 Materials and methods
Snow was sampled into special polypropylene containers (Corning Inc., USA) from the cores drilled at 55.3, 253, 337, 369, 403, 441, 480, 519, 560, 618, 911, and 1276 km from Station Progress with the resolution of 10 cm up to a depth of 100–150 cm (Ta-ble 1). The samples were frozen and transported to the Scientific Expedition Vessel 5
Academician Fedorov, and then in thermo-insulating boxes by plain to Limnological Institute of the Siberian Branch of the Russian Academy of Sciences (LIN SB RAS), Irkutsk, Russia.
The samples delivered to the laboratory were melted in a laminar box at room temperature. Solutions were filtered through acetate-cellulose filters of 0.2 µm. An-10
ions (NO−
3 and SO 2−
4 ) were analysed using a high-performance liquid chromatograph
Milichrom A-02 (Russia), cations (Na+, K+, Mg2+, and Ca2+) and aluminium (Al) using a mass-spectrometer with induced coupled plasma ICP-MS (Agilent 7500 ce, USA) (Khodzher et al., 2011).
Laboratory inter-comparison of snow samples from East Antarctica was performed 15
at two laboratories: Laboratory of Glaciology and Environmental Geophysics (LGGE, Grenoble, France) and Laboratory of Hydrochemistry and Atmospheric Chemistry (LIN SB RAS, Irkutsk, Russia). In total, both laboratories analysed 94 samples of snow water for major ions using ion chromatography. Concentrations of anions SO2−
4 , NO
−
3, Cl
−and
cations Na+, K+, Ca2+, Mg2+were measured at LIN SB RAS on an ICS-3000 (Dionex, 20
USA) using analytical columns IonPac CS12A and IonPac AS19. Six Cation Standard II and Seven Anion Standard II (Dionex, USA) were used as reference elements. The volume of injected material for cations was 500 µL, for anions – 3000 µL, and the rate of eluent ejection was 250 µL min−1(Weiss, 2005). Analyses performed at two labora-tories showed identical dynamics in concentration changes from sample to sample and 25
TCD
7, 2007–2028, 2013Spatial-temporal dynamics of chemical
composition of surface snow
T. V. Khodzher et al.
Title Page
Abstract Introduction
Conclusions References
Tables Figures
◭ ◮
◭ ◮
Back Close
Full Screen / Esc
Printer-friendly Version
Interactive Discussion
Discussion
P
a
per
|
Dis
cussion
P
a
per
|
Discussion
P
a
per
|
Discussio
n
P
a
per
|
components determined (for SO2−
4 about 70–150 ppb and for Na
+ less than 40 ppb),
one can conclude that the analysis results of the same samples carried out by two independent laboratories were consistent.
3 Results
3.1 Spatial distribution of chemical components in the surface (0–10 cm) snow
5
layer
An important characteristic of chemical composition of the surface Antarctic snow is total concentration of dissolved components – ions of Na+, K+, Mg2+, Ca2+, and SO2−
4 .
Arithmetical mean value of concentrations (210 ppb) was used for comparison of these dissolved components in the 0–100 cm snow layer of the cores under study. For exam-10
ple, in the 0–10 cm layer, the total concentration of dissolved components was higher than the mean value at 55.3, 337, 560, and 1276 km from Station Progress. Maximal ionic concentrations (about 260 ppb) were recorded in the snow near the coast and at 560 km from the coast. Further inland from site 55.3 km to site 519 km, ionic concen-trations decreased in the surface snow layer by approximately 30 %/70 km along the 15
tractor transect. Minimal ionic concentrations (95 ppb) were registered at 519 km from the coast (Fig. 2). It was almost 2 times lower than that of dissolved components in the surface snow at approximately the same distances from the coast in Dronning Maud Land (K ¨ark ¨as et al., 2005). The rise of ionic concentration was observed at a distance of 560 km from the ice edge, remaining higher (210 ppb) than the mean value further 20
inland (Fig. 2).
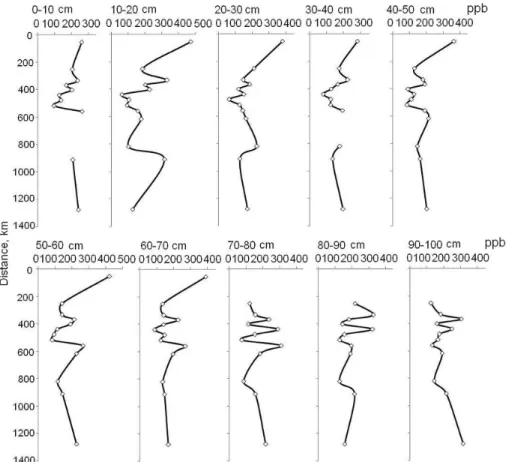
3.2 Vertical distribution of chemical components in the 10–100 cm snow layer
TCD
7, 2007–2028, 2013Spatial-temporal dynamics of chemical
composition of surface snow
T. V. Khodzher et al.
Title Page
Abstract Introduction
Conclusions References
Tables Figures
◭ ◮
◭ ◮
Back Close
Full Screen / Esc
Printer-friendly Version
Interactive Discussion
Discussion
P
a
per
|
Dis
cussion
P
a
per
|
Discussion
P
a
per
|
Discussio
n
P
a
per
|
70–100 cm depth intervals in the cores drilled at 337, 560, and 1276 km. Maximal ionic concentrations were recorded in the coastal snow at a depth of 10–20 cm (472 ppb) and 50–60 cm (472 ppb). Minimal ionic values (lower than the arithmetic mean value) were found in all layers at 480 and 519 km (Fig. 2). At the site profile of 560 and 618 km, a rise in ionic concentrations was registered in the surface snow layers and in the snow 5
collected from different depths. Then the total ions decreased in snow at a distance of 819 km from the ice edge, being lower than the arithmetic mean value, and increased again at 911 and 1276 km (Station Vostok) from the ice edge.
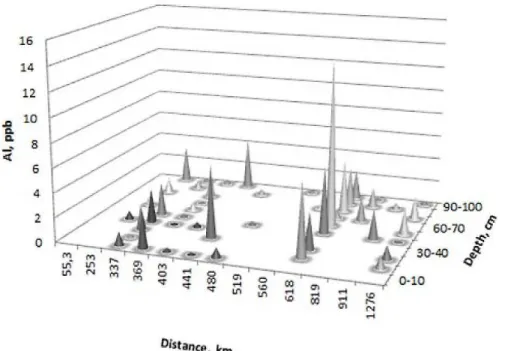
3.3 Distribution of alkaline and alkaline-earth components in the surface snow
Concentration of some alkaline and alkaline-earth components in snow is shown in 10
Tables 2–5 and in a matrix diagram for sodium (Fig. 3). On the whole, the distribution pattern of components was similar. However, the qualitative trends were not always in positive correlation. Distribution of Na+ concentrations is shown as an example in Fig. 3. Its content was maximal at the coastal sampling site varying from 120 to 220 ppb. The decrease was recorded at 253, 519, and 819 km and insignificant rise at 337–369 15
and 560–618 km from Station Progress. A similar pattern of concentration distribution was revealed for Mg2+ with its maximum in the coastal area. Unlike Na+ and Mg2+, the highest concentrations of Ca2+ and K+ were observed in snow at 253, 480, 560, 618 km, and 1276 km.
3.4 Sulphate distribution in the surface snow
20
As in case with the distribution of alkaline and alkaline-earth elements, the decrease in sulphate concentrations was also observed in the snow at 519 km from the coast and its rise at the more remote sites. This trend was the most visual in the 0–70 cm layer. Minimal content of sulphate was recorded in the 20–50 cm layer. In the deeper layers (70–100 cm), the trend of the sulphate content decrease in snow was expressed 25
TCD
7, 2007–2028, 2013Spatial-temporal dynamics of chemical
composition of surface snow
T. V. Khodzher et al.
Title Page
Abstract Introduction
Conclusions References
Tables Figures
◭ ◮
◭ ◮
Back Close
Full Screen / Esc
Printer-friendly Version
Interactive Discussion
Discussion
P
a
per
|
Dis
cussion
P
a
per
|
Discussion
P
a
per
|
Discussio
n
P
a
per
|
were higher than at the neighbouring sites (819 and 911 km). In the snow cores drilled at 253, 560, and 1276 km (examined up to 1.5 m), high sulphate concentrations were registered in the 130–150 cm layer. The maximal value of sulphate ion (511 ppb) was recorded at 253 km.
4 Discussion
5
As stated above, components in the Antarctic snow are emitted with aerosols from the atmosphere (sea salt, continental dust, and products of volcano eruptions) or they are generated by photochemical reactions involving gases (Olson, 1980; Delmas et al., 1982; Parker et al., 1982; Legrand et al., 1988). Sea surface is a powerful source for aerosol input into the atmosphere. It is noteworthy that there is a microlayer of less than 10
150 µm in which the concentrations of dissolved components are much higher than in the lower layers due to surfactants (Shevchenko, 2006). Marine aerosols formed as a result of bubble destruction at the “water-air” interface cause the emergence of particles of a submicron fraction with a diameter of less than 0.3 µm which can be transferred at hundreds or thousands of kilometres from the source. Those aerosols formed as 15
a result of evaporation of water drops are much larger in diameter, and their sizes correspond to those of a coarse-dispersion fraction. These particles are accumulated close to the source (Ivlev and Dovgalyuk, 1999). Taking into account this fact, aerosols formed both as a result of bubble destruction and evaporation of sea water could be a source of elevated concentrations of Na+ in the snow at a distance of 55.3 km from 20
Station Progress. Multiple decrease of Na+ content in the snow core drilled at 253 km, compared to that in the snow core at 55.3 km, attests to the reduction of contribution of marine aerosols to chemical composition of snow further in land. Our data on the decrease of the sea factor effect are consistent with the results of other studies (Bertle et al., 2005; Prodi et al., 2008).
25
TCD
7, 2007–2028, 2013Spatial-temporal dynamics of chemical
composition of surface snow
T. V. Khodzher et al.
Title Page
Abstract Introduction
Conclusions References
Tables Figures
◭ ◮
◭ ◮
Back Close
Full Screen / Esc
Printer-friendly Version
Interactive Discussion
Discussion
P
a
per
|
Dis
cussion
P
a
per
|
Discussion
P
a
per
|
Discussio
n
P
a
per
|
e.g. aluminosilicates coming with the continental dust the solubility of which increases in weak-acid solutions of snow (Sklyarov, 2001; Glinka, 2002). The pH value of snow water ranged from 4.2 to 5.2 in all cores studied.
The content of aluminium in the majority of snow samples equalled analytic zero. However, in some of the samples, particularly in the snow core drilled at 618 km from 5
Station Progress with low pH (4.2–4.6), the Al content reached up to 10 ppb (Fig. 5). An attempt was made to determine possible continental sources of components from this element and from high concentrations of calcium and magnesium in snow samples.
The input of continental dust to the Antarctic continent is more likely to be attributed to the air mass transfer during cyclonic processes. It is known that cyclones bring-10
ing air masses to Antarctica are generated more often on the south-eastern coast of South America, South Africa, and Australia. Further inland, they reach 60–65◦S where they usually regenerate. Deep north-western cyclones become high and nonmobile be-tween 80 and 95◦E and can cover vast territories of the continent. Their shift along the meridian is 5–8◦ (Pogosyan, 1972). Wind speed increases in the frontal zones caus-15
ing the penetration of air masses further inland. This fact probably explains the rise of component concentrations in the snow cores drilled at 560 and 618 km from Station Progress located between 73◦58′–74◦23′S and 82◦50′–84◦02′E.
The origin of sulphate in the Antarctic snow is attributed to both sea salt and gas phase modifications in the atmosphere (Glinka, 2002; Zielinski et al., 1997). Volcanic 20
sulphate emission may be also referred to the potentially substantial source of conti-nental sulphate (Ivlev and Dovgalyuk, 1999).
The concentration of sea-salt (ss-SO2−
4 ) and non-sea-salt (nss-SO 2−
4 ) sulphate were
calculated using the known formulae:
[ss−SO24−]=[SO42−]−[nss−SO24−]; (1)
25
TCD
7, 2007–2028, 2013Spatial-temporal dynamics of chemical
composition of surface snow
T. V. Khodzher et al.
Title Page
Abstract Introduction
Conclusions References
Tables Figures
◭ ◮
◭ ◮
Back Close
Full Screen / Esc
Printer-friendly Version
Interactive Discussion
Discussion
P
a
per
|
Dis
cussion
P
a
per
|
Discussion
P
a
per
|
Discussio
n
P
a
per
|
where [SO2−
4 ] is SO 2−
4 concentration in snow; [Na
+] is Na+ concentration in snow (the
initial concentrations are given in µEq/1) (EMEP, 1996).
Figure 4 shows variations of sea-salt and non-sea-salt sulphate in the Antarctic snow along the Progress-Vostok transect. The highest concentrations of sea-salt sulphate were recorded in the snow at 55.3 km from Station Progress. Further inland, the con-5
centrations of sea-salt sulphate decreased in the snow water. Elevated concentrations of non-sea-salt sulphate were registered within the 130–150 cm layer in the snow core collected to the 150 cm depth. Maximal nss-SO2−
4 concentrations were observed at a
depth of 140–150 cm at 253 km from Station Progress. At 560 km from this station the peak of its concentration was recorded in the 130–140 cm layer, whereas at 1276 km 10
– within 120–130 cm. Areas with high concentrations of nss-SO2−
4 are marked in grey
in Fig. 4. Maximal sulphate concentrations fixed within these deep intervals are most likely evident of buried signals of the Pinatubo eruption in June of 1991 on the Philip-pines with the volcanic explosivity index (VEI) 6 (Newhall and Self, 1982).
5 Conclusions
15
Detailed chemical analysis of the Antarctic snow composition was performed for the first time at the transect Station Progress-Station Vostok at a distance from 55.3 to 1276 km from the ice edge. Marine-derived components are the main contributors to chemical snow composition near the coast and at a distance of up to 400 km further inland. They affect spatial and time variations of snow composition at the profile under 20
study. However, their influence diminishes at a distance of 519 km from the coast. Fur-ther inland, additional sources of component input in the snow cover appear in East Antarctica, which cause a threefold rise of total concentrations of dissolved compo-nents at 560–618 km from the ice edge. The elevated content of compocompo-nents in the atmosphere in this area may be attributed to prevailing paths of cyclonic air masses 25
TCD
7, 2007–2028, 2013Spatial-temporal dynamics of chemical
composition of surface snow
T. V. Khodzher et al.
Title Page
Abstract Introduction
Conclusions References
Tables Figures
◭ ◮
◭ ◮
Back Close
Full Screen / Esc
Printer-friendly Version
Interactive Discussion
Discussion
P
a
per
|
Dis
cussion
P
a
per
|
Discussion
P
a
per
|
Discussio
n
P
a
per
|
of this supposition. The signals of the Pinatubo volcanic eruption (1991), judging by elevated concentrations of non-sea-salt sulphate (nss-SO2−
4 ) in the snow cores up to a
depth of 150 cm, can serve as a time marker.
Acknowledgements. This work was supported by Programme of DES RAS No. 119 and RFBR
Project No. 10-05-93109.
5
References
Aristarain, A. and Delmas, R.: Snow chemistry measurements on James Ross Island (Antarctic Peninsula) showing sea-salt aerosol modifications, Atmos. Environ., 36, 765–772, 2002. Bertle, N., Mayewski, P. A., Aristarain, A., Barrett, P., Becagli, S., Bernardo, R., Bo, S., Xiao,
C., Curran, M., Qin, D., Dixon, D., Ferron, F., Fischer, H., Frey, M., Frezzotti, M.; Fundel, F.,
10
Genthon, C., Gragnani, R., Hamilton, G., Handley, M., Hong, S., Isaksson, E., Kang, J., Ren, J., Kamiyama, K., Kanamor, S., K ¨ark ¨as, E., Karl ¨of, L., Kaspari, S., Kreutz, K., Kurbatov, A., Meyerson, E., Ming, Y., Zhang, M., Motoyama, H., Mulvaney, R., Oerter, H., Osterberg, E., Proposito, M., Pyne, A., Ruth, U., Sim ˜oes, J., Smith, B., Sneed, S., Teinil ¨a, K., Traufetter, F., Udisti, R., Virkkula, A., Watanabe, O., Williamson, B., Winther, J. G., Li, Y., Wolff, E., Li, Z.,
15
and Zielinski, A.: Snow chemistry across Antarctica, Ann. Glaciol., 41, 167–179, 2005. Cincinelli, A., Desideri, P. G., Lepri, L., Checchini, L., Bubba, M. D., and Udisti, R.: Marine
contribution to the chemical composition of coastal and inland Antarctic snow, Int. J. Environ. Anal. Chem., 79, 283–299, 2001.
Delmas, R. J., Barnola, J. M., and Legrand, M.: Gas-derived aerosol in central Antarctic snow
20
and ice: the case of sulphuric and nitric acids, Ann. Glaciol., 3, 71–76, 1982.
Ekaikin, A. A., Lipenkov, V. Ya., Pettit, J. R., and Masson-Delmotte, V.: Fifty-year cycle in changes of accumulation and isotopic composition of snow at Station Vostok, MSU, 94, 163– 173, 2003.
EMEP: Manual for sampling and chemical analysis. Cooperative Programme for Monitoring and
25
Evaluation of the Long-range Transmission of Air Pollutants in Europe. NILU: EMEP/CCC-Report 1/95, Reference: 0-7726, EMEP, 176 pp., 1996.
Glinka, N .L.: General Chemistry, M.: Integral-Press, 728 pp., 2002.
Ivlev, L. S. and Dovgalyuk, Yu. A.: Physics of atmospheric aerosol particles, St.P.: Izd-vo St.P.SU, 256 pp., 1999.
TCD
7, 2007–2028, 2013Spatial-temporal dynamics of chemical
composition of surface snow
T. V. Khodzher et al.
Title Page
Abstract Introduction
Conclusions References
Tables Figures
◭ ◮
◭ ◮
Back Close
Full Screen / Esc
Printer-friendly Version
Interactive Discussion
Discussion
P
a
per
|
Dis
cussion
P
a
per
|
Discussion
P
a
per
|
Discussio
n
P
a
per
|
K ¨ark ¨as, E., Teinil ¨a, K., Virkkula, A., and Aurela, M.: Spatial variations of surface snow chemistry during two austral summers in western Dronning Maud Land, Antarctica, Atmos. Environ., 39, 1405–1416, 2005.
Khodzher, T. V., Golobokova, L. P., Osipov, E. Yu., Artemyeva, O. V., Maslennikova, M. M., Lipenkov, V. Ya., Shibaev, Yu. A., Belozerova, O. Yu., and Likhoshway, E. V.: Evidences of
5
volcanic eruptions of Tambora and Krakatau (XIX) according to chemical and electron mi-croscopy studies of snow-firn cores from Station Vostok (Antarctica), Ice Snow, 1, 105–113, 2011.
Legrand, M., Lorius, C., Barkov, N. I., and Petrov, V. N.: Vostok (Antarctica) ice core: Atmo-spheric chemistry changes over the last climatic cycle (160,000 years), Atmos. Environ., 22,
10
317–331, 1988.
Newhall, C. A. and Self, S.: The volcanic explosivity index (VEI): An estimate of the explosive magnitude for historical volcanism, J. Geophys. Res., 87, 1231–1238, 1982.
Olson, S.: Solar tracks in the snow, Science News, 118, 313–316, 1980.
Parker, B. C., Zeller, E. J., and Gow, A. J.: Nitrogenous chemical composition of Antarctic ice
15
and snow, Antarctic J. US, 14, 80–82, 1982.
Piccardi, G., Casella, F., and Udisti, R.: Non-sea-salt contribution of some chemical species to the snow composition at Terra Nova Bay (Antarctica), Int. J. Environ. Anal. Chem., 63, 207–223, 1996.
Pogosyan, H. P.: Total atmospheric circulation, L.: Hydrometeoizdat, 393 pp., 1972.
20
Prodi, F., Belosi, F., Santachiara, G., Contini, D., Di Matteo, L., and Grasso, F.: Chemical com-position and shape of snow crystals in Antarctica, Il Nuovo Cimento C, 031, 157–173, 2008. Shevchenko, V. P.: Effect of aerosols on the environment and marine sedimentation in the Arctic,
M.: Nauka, 226 pp., 2006.
Sklyarov, E. V. (Ed.): Interpretation of geochemical data, Internet Engineering, 288 pp., 2001.
25
Udisti, R., Becagli, S., Castellano, E., Travers, R., Vermigli, S., and Piccardi, G.: Sea spray and marine biogenic seasonal distribution to snow composition at Terra Nova Bay (Antarctica), Ann. Glaciol., 29, 77–83, 1999.
Udisti, R., Becagli, S., Benassai, S., Castellano, E., Fattori I., Massimo, I., Migliori, A., and Traversi, R.: Atmosphere-snow interaction by a comparison between aerosol and uppermost
30
snow-layers composition at Dome C (East Antarctica), Ann. Glaciol., 39, 1, 53–61, 2005. Weiss, J.: Handbook of ion chromatography, Wiley-VCH, http://books.google.ru, 461–547,
TCD
7, 2007–2028, 2013Spatial-temporal dynamics of chemical
composition of surface snow
T. V. Khodzher et al.
Title Page
Abstract Introduction
Conclusions References
Tables Figures
◭ ◮
◭ ◮
Back Close
Full Screen / Esc
Printer-friendly Version
Interactive Discussion
Discussion
P
a
per
|
Dis
cussion
P
a
per
|
Discussion
P
a
per
|
Discussio
n
P
a
per
|
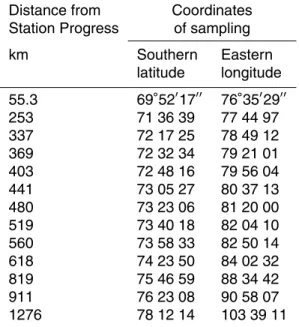
Table 1.Coordinates of snow sampling along the first tractor transect from Station Progress to
Station Vostok (East Antarctica), February of 2008.
Distance from Coordinates Station Progress of sampling
km Southern Eastern
latitude longitude
55.3 69◦52′17′′ 76◦35′29′′
253 71 36 39 77 44 97
337 72 17 25 78 49 12
369 72 32 34 79 21 01
403 72 48 16 79 56 04
441 73 05 27 80 37 13
480 73 23 06 81 20 00
519 73 40 18 82 04 10
560 73 58 33 82 50 14
618 74 23 50 84 02 32
819 75 46 59 88 34 42
911 76 23 08 90 58 07
TCD
7, 2007–2028, 2013Spatial-temporal dynamics of chemical
composition of surface snow
T. V. Khodzher et al.
Title Page
Abstract Introduction
Conclusions References
Tables Figures
◭ ◮
◭ ◮
Back Close
Full Screen / Esc
Printer-friendly Version
Interactive Discussion
Discussion
P
a
per
|
Dis
cussion
P
a
per
|
Discussion
P
a
per
|
Discussio
n
P
a
per
|
Table 2.Concentrations of Na+in snow water along the tractor transect from Station Progress
to Station Vostok, February of 2008, ppb.
Distance Snow layer
km cm
0–10 10–20 20–30 30–40 40–50 50–60 60–70 70–80 80–90 90–100
55.3 126 187 169 123 171 193 222
253 22 12 25 12 11 24 36 7 13 24
337 72 37 37 57 74 24 35 21 66 25
369 53 31 34 65 88 58 41 33 8 82
403 45 46 28 22 31 28 29 35 41 51
441 20 15 34 31 28 23 18 12 10 26
480 16 18 16 11 16 8 8 9 6 25
519 5 5 6 13 7 4 11 11 15 15
560 15 15 21 43 37 27 31 17 22 13
618 12 40 29 40 41 53 32 47
819 5 37 22 7 7 14 8 3 9
911 16 27 16 18 27 18 14 10 11 38
TCD
7, 2007–2028, 2013Spatial-temporal dynamics of chemical
composition of surface snow
T. V. Khodzher et al.
Title Page
Abstract Introduction
Conclusions References
Tables Figures
◭ ◮
◭ ◮
Back Close
Full Screen / Esc
Printer-friendly Version
Interactive Discussion
Discussion
P
a
per
|
Dis
cussion
P
a
per
|
Discussion
P
a
per
|
Discussio
n
P
a
per
|
Table 3.Concentrations of Mg2+in snow water along the tractor transect from Station Progress to Station Vostok, February of 2008, ppb.
Distance Snow layer
km cm
0–10 10–20 20–30 30–40 40–50 50–60 60–70 70–80 80–90 90–100
55.3 6.2 8.4 6.9 6.1 8.4 1.2 1.7
253 2.8 1.9 3.7 2.2 1.3 2.5 3.3 1.3 1.6 3.3
337 2.3 1.1 0.9 2.0 1.7 1.2 2.1 1.9 2.3 1.7
369 2.1 0.9 1.3 2.4 3.4 1.2 1.0 0.6 0.0 2.3
403 1.6 1.1 0.3 0.4 0.9 0.5 0.4 0.9 1.2 1.6
441 2.3 2.6 1.7 3.2 2.9 2.5 2.0 4.2 3.3 2.5
480 1.8 2.4 1.8 1.4 1.6 1.3 1.7 0.6 1.1 2.5
519 1.0 0.8 1.4 1.6 1.2 1.2 1.4 1.8 1.7 2.5
560 2.5 2.1 1.7 1.6 2.3 2.4 3.0 2.4 2.3 1.5
618 6.3 7.4 6.3 1.1 3.3 8.1 5.6 4.9
819 0.5 1.6 1.2 0.7 3.6 1.1 1.3 3.8 0.9
911 1.6 3.5 1.4 3.4 3.1 2.2 1.9 1.3 1.9 2.7
TCD
7, 2007–2028, 2013Spatial-temporal dynamics of chemical
composition of surface snow
T. V. Khodzher et al.
Title Page
Abstract Introduction
Conclusions References
Tables Figures
◭ ◮
◭ ◮
Back Close
Full Screen / Esc
Printer-friendly Version
Interactive Discussion
Discussion
P
a
per
|
Dis
cussion
P
a
per
|
Discussion
P
a
per
|
Discussio
n
P
a
per
|
Table 4.Concentrations of K+ in snow water along the tractor transect from Station Progress
to Station Vostok, February of 2008, ppb.
Distance Snow layer
km cm
0–10 10–20 20–30 30–40 40–50 50–60 60–70 70–80 80–90 90–100
55.3 1.2 2.4 1.7 1.3 2.1 2.2 2.1
253 3.6 3.2 2.5 2.2 2.5 1.3 2.6 2.3 3.1 3.1
337 2.4 1.0 1.3 2.5 2.2 0.0 0.0 0.0 0.7 0.0
369 2.4 1.3 1.0 1.2 1.5 1.6 1.2 1.0 1.7 1.8
403 1.3 1.6 0.9 0.7 0.7 1.0 1.1 0.8 1.0 1.4
441 1.9 0.1 0.5 0.3 0.0 0.8 0.0 0.1 0.8 1.5
480 1.1 3.0 0.2 0.8 2.1 4.2 1.9 3.6 4.7 0.1
519 0.2 0.9 1.1 1.2 2.6 3.0 0.4 0.7 0.7 0.1
560 2.6 0.2 1.4 1.4 2.2 3.0 3.1 3.8 4.0 0.1
618 2.6 3.1 0.7 3.1 1.9 2.8 1.0 3.3
819 0.0 0.0 0.0 0.0 0.0 1.6 0.0 1.3 1.6
911 0.0 1.0 0.9 1.1 0.7 0.4 0.9 0.0 1.7 3.7
TCD
7, 2007–2028, 2013Spatial-temporal dynamics of chemical
composition of surface snow
T. V. Khodzher et al.
Title Page
Abstract Introduction
Conclusions References
Tables Figures
◭ ◮
◭ ◮
Back Close
Full Screen / Esc
Printer-friendly Version
Interactive Discussion
Discussion
P
a
per
|
Dis
cussion
P
a
per
|
Discussion
P
a
per
|
Discussio
n
P
a
per
|
Table 5.Concentrations of Ca2+in snow water along the tractor transect from Station Progress to Station Vostok, February of 2008, ppb.
Distance Snow layer
km cm
0–10 10–20 20–30 30–40 40–50 50–60 60–70 70–80 80–90 90–100
55.3 7 28 12 17 21 16 26
253 28 11 23 11 19 20 13 24 29 16
337 11 9 8 14 24 12 12 3 29 13
369 12 7 24 6 11 10 3 2 0 20
403 1 4 2 6 2 9 7 2 9 9
441 8 6 27 2 10 12 2 16 15 17
480 16 11 10 9 31 27 37 18 10 16
519 11 2 16 17 14 17 17 19 14 26
560 34 31 21 43 37 38 30 40 26 22
618 23 13 16 38 26 22 28 22
819 8 10 8 7 7 5 0 9 14
911 6 12 3 16 20 12 12 5 8 10
TCD
7, 2007–2028, 2013Spatial-temporal dynamics of chemical
composition of surface snow
T. V. Khodzher et al.
Title Page
Abstract Introduction
Conclusions References
Tables Figures
◭ ◮
◭ ◮
Back Close
Full Screen / Esc
Printer-friendly Version
Interactive Discussion
Discussion
P
a
per
|
Dis
cussion
P
a
per
|
Discussion
P
a
per
|
Discussio
n
P
a
per
|
– –
–
Fig. 1.Laboratory inter-comparison of the results on concentrations of SO2−
4 and Na
+ in snow
TCD
7, 2007–2028, 2013Spatial-temporal dynamics of chemical
composition of surface snow
T. V. Khodzher et al.
Title Page
Abstract Introduction
Conclusions References
Tables Figures
◭ ◮
◭ ◮
Back Close
Full Screen / Esc
Printer-friendly Version
Interactive Discussion
Discussion
P
a
per
|
Dis
cussion
P
a
per
|
Discussion
P
a
per
|
Discussio
n
P
a
per
|
Fig. 2.Dynamics of total ion concentrations (Na+, K+, Mg2+, Ca2+, and SO2−
TCD
7, 2007–2028, 2013Spatial-temporal dynamics of chemical
composition of surface snow
T. V. Khodzher et al.
Title Page
Abstract Introduction
Conclusions References
Tables Figures
◭ ◮
◭ ◮
Back Close
Full Screen / Esc
Printer-friendly Version
Interactive Discussion
Discussion
P
a
per
|
Dis
cussion
P
a
per
|
Discussion
P
a
per
|
Discussio
n
P
a
per
|
Fig. 3.Matrix diagram of Na+concentrations in snow at the Progress-Vostok transect (February
TCD
7, 2007–2028, 2013Spatial-temporal dynamics of chemical
composition of surface snow
T. V. Khodzher et al.
Title Page
Abstract Introduction
Conclusions References
Tables Figures
◭ ◮
◭ ◮
Back Close
Full Screen / Esc
Printer-friendly Version
Interactive Discussion
Discussion
P
a
per
|
Dis
cussion
P
a
per
|
Discussion
P
a
per
|
Discussio
n
P
a
per
|
Fig. 4.Sea-salt (ss) and non-sea-salt (nss) sulphate in snow at the Progress-Vostok transect.
TCD
7, 2007–2028, 2013Spatial-temporal dynamics of chemical
composition of surface snow
T. V. Khodzher et al.
Title Page
Abstract Introduction
Conclusions References
Tables Figures
◭ ◮
◭ ◮
Back Close
Full Screen / Esc
Printer-friendly Version
Interactive Discussion
Discussion
P
a
per
|
Dis
cussion
P
a
per
|
Discussion
P
a
per
|
Discussio
n
P
a
per
|