ISSUES CONCERNING OCCURRENCE OF FLOODS
ON THE VEDEA RIVER
TOMA FLORENTINA-MARIANA1 , BARBU ION2
ABSTRACT. Aspects of flood occurrence on the Vedea River. This study addresses several aspects of floods on the Vedea River, located in the Central Romanian Plain, located between Olt and Argeú rivers. Data recorded in the most important hydrological stations (Buzeúti, Văleni, Alexandria) along the Vedea River were used, for a period of 40 years (1970-2009). Flood generating conditions, their typology and parameters were analyzed. Cavis software developed by specialists from INHGA Bucharest was employed, in order to draft the flood hydrographs and calculate the floods parameters. Also, we calculated the multi-annual and seasonal frequencies of flood occurrence. There are two main conclusions emerging from specific analysis. First, the most floods occur in late winter and early spring while the least are specific to autumn season. Second conclusion is that the highest flash floods recorded along the Vedea River are associated to heavy rainfall periods and they occurred in late spring and early summer.
Keywords: highflood, frequency,Cavis software,Vedea River.
1. INTRODUCTION
Although aspects on the floods on the Vedea River itself have not been analyzed, some studies covering the whole country (MustăĠea, A 2005), the Romanian Plain (Haraga St., NiĠulescu, M.1973) or only of the large river in southern Romania as Olt (Dumitrescu, V. 1976) or IalomiĠa (Lăzărescu, D., ğuca, I. 1976) were made. Some authors studied exceptional highfloods as case studies: 1972 (Trufaú, V. and Vrabie, C. 1973, Diaconu, C., Lăzărescu D., MociorniĠa, C., 1972), 1975 (Zăvoianu, I., Podani, M. 1977).
Located in the central part of the Romania Plain, between the Olt and Arges rivers (Teleorman Plain), Vedea springs from Piedmond Cotmeana (Morăreúti). The superior course of the river goes through the lower hills while the middle and inferiour course flows through the plains. It crosses the counties of Arges, Olt and Teleorman, having a total length of 224 km. After passsing through Pietroúani village it flows into the Danube River.
Vedea Basin was the sbject of many points of view papers: morphologically (Vâlsan,G 1914,1917), hydrological characteristics (MociorniĠa,C. and Popovici, V.1979, Zaharia,L. 1993, 2004) or impact of deforestation and environmental pollution (Marin,I. 1997).
1
Drd Facultatea de geografie Universitatea Babeú Bolyai Cluj Napoca/ Liceul Pedagogic ,,Mircea Scarlat” Alexandria, [email protected]
2
Since the Vedea River was less studied, both in terms of water issues and aspects of floods occurrence, we considered appropriate to study in this paper the floods generating conditions, their frequency and floods hydograph characteristics.
2. DATA AND METHODS
2.1. Data
Hourly and daily data from the three main hydrological stations along the Vedea River (Buzeúti, Văleni and Alexandria) were used in order to identify the highest floods in the area. The period considered covered 40 years (1970-2009).
Data were provided by the Vedea and Argeú Water Branch
Fig 1. Vedea River
2.2. Methods
In order to draw the flood hidrograph and to calculate the parameters of the singular floods the CAVIS softwere developed by researchers in the National Hydrology and Water Management Institute in Bucharest was employed. The separation of singular floods from composite floods was made using the same application.
CAVIS softwere is an application developped under Windows, with two main modules: input data management module and calculation of singular flood wave specific elements module.
growth
-Tc
(hours),
time of decreasing Td (hours
), total time of the flood Tt (hours
),initial base flood discharge flow
Qbi (m3/s), final discharge flow of the flood Qbf (m3/s), minimum and maximum threshold variation of the basic flow Qbmin, Qbmax, maximum discharge of direct flow QmaxV (m3/s), maximum discharge flow of the flood Qmax (m3/s), the growth volume of direct flow WcV (mil. m3), the growth volume of the flood Wc (mil. m3), the decrease volume of the direct flow WdV (mil. m3), the decreasing volume of the flood Wd (mil. m3);- total volume of the direct flow WtV (mil. m3), computed as: WtV = WcV + WdV
- total volume of flood Wt (mil. m3):
Wt = Wc + Wd - shape coefficient of the direct flow hydrograph (
J
V):J
V = WtV / (QmaxV • Tt)- shape coefficient of the flood (
J
):Gamma = Wt / (Qmax • Tt)
-HsV(mm) elapsed layer (layer drained volume equivalent) of direct flow, computed as:
HsV = WtV / S
-Hs (mm) - layer drained since the flood beginning, computed with: Hs = Wt / S
There are five models available with this softwere one can choose from, in order to determine the flow of single flood
:
-constant model Qb(t) = Qbi;
- model with constant slope Qb(t) = Qb(t-
¨t) + ¨Qbc
- concave model:
- recursive model:
- generalized-model
where
-QmaxTime, QbiTime, QbfTime, QbminTime, QbmaxTime –
is the time of
Qmax
,
Qbi
,
Qbf
,
Qbmin
ú
i
Qbmax
;
-¨Qbc, ¨Qbd – increase or decrease the rate of basic discharge flow; A – coefficient; ¨t – time step.
¯ ® ' ' ' ' ] , ( , ) ( ] , [ , ) ( ) ( QbfTime QmaxTime t Qbc t t Qb QmaxTime QbiTime t Qbd t t Qb t Qb ) ( ) 1 ( ) ( )
(t A Q t A Qb t t
Qb '
° ¯ ° ® ' ' ' ' ' ' ] , ( , ) ( ] , ( , ) ( ] , [ , ) ( ) ( QbfTime QbmaxTime t Qbd t t Qb QbmaxTime QbminTime t Qbc t t Qb QbminTime QbiTime t Qbd t t Qb t Qb ) ( ) 1 ( ) ( )
(t A Q t A Qb t t
To make delimitation of the monowave flood from a multiwaves flood, an exponential realtion is used , both for growth and decreasing periods of the flood. It suggests the input and the output of water in the hydrographic basin.
For the growth branch:
For the decreasing branch:
where:
- Ac is the power of the basic exponential function (Euler number with an approximate value e = 2,71828).
3. RESULTS
Flash floods are considered as risk phenomena due to the destroying force they develop. It is manifested by a sudden increase of the flow of the river in a short period of time. They are caused by melting snow, heavy rains or the combination of both causes.
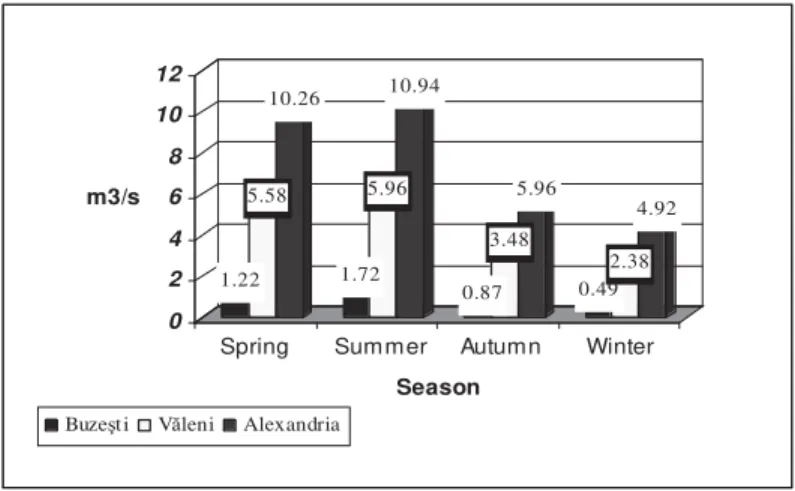
Both peak flow and flood duration depend on the physical and geographical conditions that generate flow: amount, duration and intensity of rainfall, basin slope, area and topography as well as geology (Fig.2).
1.22 5.58
10.26
1.72 5.96
10.94
0.87 3.48
5.96
0.49 2.38
4.92
0 2 4 6 8 10 12
m3/s
Spring Summer Autumn Winter
Season
Buzeút i Văleni Alexandria
Figure 2. Seasonal average flow
Generally, topography influences the flood parameters by its features:
massiveness
, slope and altitude. However, in the analyzed region, low slopes of the relief gives the flow a little speed. It affects the time for concentration and propagation of the flood. On the other hand, the high rate of infiltration allows partially the absorption of the rain water and causes the mitigation of the flood volume. In addition to this, as a result of high temperature regime, intense evaporation adds, especially during the warm season (April-September).Ac
e
t
t
Q
t
Qb
(
)
(
'
)
Ad
e t t Q t
37.25
40.19
12.73
9.80
0 5 10 15 2 0 2 5 3 0 3 5 4 0 4 5
%
Wint er Spring Summer Aut umn
S e a so n
Analyzing seasonal flood frequency it was revealed that most floods occured in spring (40.19%) and winter (37.25%). The lowest frequency was specific to summer (12.37%) and autumn with only 9.80% of total flood occurred on the Vedea River( Table 1,Fig.3).
Table 1. Frequency of seasonal floods occurred on the Vedea River
An analysis of the floods produced along the Vedea River highlights that the most numerous winter floods were recorded at Alexandria station (18 floods), while during spring the numbers of floods recorded were equal at Alexandria and Buzeúti stations (14 cases).
Figure 3. Frequency of seasonal floods
Summer and autumn floods had the lowest frequencies (5 and respectively, 3 cases). During autumn, floods are diminished due to the small amounts of rainfall associated with summer drought.
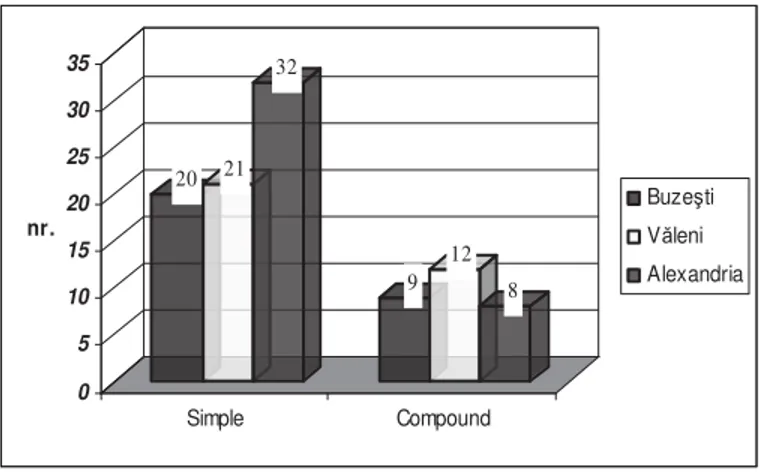
Another issue of this study was the analyze of the floods typology according to the type of the hydrograph. Thus, 73 monowave flood events representing 71.56% of the total number of floods, and 29 multiwaves floods, representing 28.43% of the total number of floods occurred on the Vedea River, were identified (Table2).
Table 2. The total duration of the floods occurred on the Vedea River
Season Nr crt Hydrometric
station
Spring Summer Autumn Winter
1. Buzeúti 8 14 4 3
2. Văleni 12 13 4 4
3. Alexandria 18 14 5 3
4. Total 38 41 13 10
5. Frequency 37.25% 40.19% 12.73% 9.80%
Number of flood duration in hours Nr.
crt.
River Hydrometric station
0-5 h 5-12 h 12-100 h 100-450 h
Văleni 1 8 16 -
Buzeúti - 1 28 2
1 Vedea
The highest number of simple floods (32 out of 73) was recorded at Alexandria observation point located in the lower part of the river, where the plain is wide and floods are diminishing due to existing facilities along the River. The most numerous multiwave floods were identified at Văleni station, located on the middle course of the Vedea River, 12 out of 29 (Fig.4).
20 21 32
9 12
8
0 5 10 15 20 25 30 35
nr.
Simple Compound
Buzeúti Văleni Alexandria
Figure 4. Types of floods according to the hydrograph
Considering the suddeness, generally floods are classified as slow, fast or torrential (Loat, R.Petrascheck, A., 1997).
Most floods occurring on the Vedea River belong to the slow category (72 floods), specific to low areas, and have a relatively long growth time, resulting in significant water flows and volumes. A large number of such floods were recorded at Văleni station, and the lowest at Buzeúti station. At Buzeúti, where characteristic are the fast and torrential floods were specific generally with the growth time less than 12 hours.
The most important aspects of floods occurred on the Vedea River are those that analyze the characteristic elements of the flood. For a better illustration we chose the largest flood flow at each station. Thus, the flood recorded at the Alexandria station in 1972, that recorded at Buzeúti station in 1995, and that recorded at Văleni station in 2005. (Table 3)
At Buzeúti station, during 23-24 may 1995 flood, the maximum discharge flow was 345 m3 /s and it was 3.75 times higher than danger threshold (92 m3 /s) (Fig.5).
At Alexandria, in 1972, during the flood occured from 4 till 13 october 1972, the highest historical discharge flow was recorded (935 m3 /s). It was more than 2 times higher than danger threshold (462m3 /s).
At Văleni station, the danger threshold (807 m3 /s) was not reached during the highest flood recorded from 2 till 5 july 2005.
Considering flood time parameters, one can see that at Buzeúti, time of growth and time of decreasing are almost similarly (15h and respectively, 17 h), while at Alexandria in 1995, where, because of the multiwave characteristic, the time of growth (118h) was longer compared to that of decrease (86 h). The total time of the highfloods also varied very much in the area, from 32 h at Buzeúti till 204 h, at Alexandria.
Table 3. The characteristic elements of the great flood of waves
Analysis of the specific features of flood waves has revealed the occurence of the highest floods at Alexandria station, located in the lower course of Vedea River. The station is located about 40 km before the river flows into the Danube, and the flow rate is high, after collecting all the tributaries. The duration of the floods is long since the slope of the river is reduced and the area of the basin is large (3246 km2).
345
0 25 50 75 100 125 150 175 200 225 250 275 300 325 350
1 8 15 22 29 36
m3
/s
Q (m3/s)
Figure 5. 1995 flood hydrograph station hidromertica Buzesti-Vedea
Nr. crt.
Characteristic elements
Hydrometric station Buzeúti
Hydrometric station Văleni
Hydrometric station Alexandria
1. Year 1995 2005 1972
2. F (m) 495 1724 3246
3. Qmax (m3 /s) 345 751 935
4. Wc (mil. m3 ) 3.2 2.9 213
5. Wd (mil. m3 ) 10.8 60.5 160.8
6. Wt(mil. m3 ) 14.0 83.4 373.8
7. Hs (mm) 28.3 48.4 118.7
8. Gamma 0.35 0.44 0.56
9. Qbi (m3 /s) 0.96 5.16 12.5
10. Qbf (m3 /s) 24.4 63.5 153.5
11. Tc (h) 15 18 118
12. Td (h) 17 51 86
13. Tt (h) 32 69 204
Danger discharge flow
4. CONCLUSIONS
The conclusions to be drawn from the study of floods occurred on the Vedea River during the analyzed period are the following:
- most floods occur in winter and spring seasons when the huge amounts of precipitations cause higher flow rates.
- simple floods are much more numerous than compound floods (more than double).
- in terms of duration, most are slow, similarly to other plain area;
- the most important floods were recorded at Alexandria located downstream; - The highest floods that occurred in the analized period of 40 years were
recorded in 1972, 1995 and 2005.
REFERENCES
1.Diaconu, C., Lăzărescu D., MociorniĠa, C., (1972) Aspecte hidrologice ale viiturilor pe unele râuri interioare, din primăvara anului 1970, Simpozionul Cauze úi efecte ale apelor mari din mai-iunie 1970, Bucureúti
2.Dumitrescu, V. (1976) Apele excepĠionale din iulie 1975 în bazinul râului Olt, Studii úi cercetări, partea a II-a, hidrologie XLV, Bucureúti
3.Haraga,ùt., NiĠulescu, M.(1973) ConsideraĠii privind viitura din octombrie 1972 pe râurile din sudul Ġării, Studii de hidrologie, XLI, Bucureúti
4.Lăzărescu, D., ğuca, I. (1976) Apele excepĠionale din iulie 1975 în bazinul hidrografic IalomiĠa ,Studii úi cercetări, partea a II-a, hidrologie XLV, Bucureúti
5.Loat, R., Petrascheck, A., Consideration of Flood Hazards for Activities with Spatial Impact, FOWM, FOSP, FOEFL Berna,1997 (http://www.bafu.admin.ch) 6.Marin, I.,(1997) Impactul defriúare-poluare asupra mediului în Bazinul
hidrografic Vedea, Comunicări de geografie, Bucureúti
7.MociorniĠa, C., Popovici, V., (1979) Aspecte deosebite privind caracteristicile hidrologice din spaĠiul Olt-Vedea-Teleorman, Studii úi cercetări, partea a II-a, hidrologie, XLVII, Bucureúti
8.MustăĠea, A., (2005) Viituri ExcepĠionale pe Teritoriul României, Editura Onesta 94, Bucureúti
9.Trufaú,V., Vrabie, C., (1973) Viiturile din octombrie 1972 pe râurile din Oltenia, Analele UniversităĠii Bucureúti, seria Geografie, anul XXII, Bucureúti 10.Vâlsan, G.,(1914) EvoluĠia Câmpiei Române între Olt úi Argeú, Buletinul
SocietăĠii Române de Geografie, Bucureúti
11.Vâlsan, G.,(1917) InfluenĠele climatice în morfologia Câmpiei Române,
Institutul de Geologie, Bucureúti
12. Zaharia, L.,(1993), Câteva observaĠii asupra scurgerii medii a unor râuri tribu-tare Dunării româneúti, Analele UniversităĠii Bucureúti, Geografie, Bucureúti 13.Zaharia, L.,(2004), Water resources of Rivers in Romania, Analele UniversităĠii
Bucureúti, Geografie, Bucureúti