AMTD
6, 1409–1460, 2013Kr interference during carbon isotope analysis
J. Schmitt et al.
Title Page
Abstract Introduction
Conclusions References
Tables Figures
◭ ◮
◭ ◮
Back Close
Full Screen / Esc
Printer-friendly Version Interactive Discussion
Discussion
P
a
per
|
Dis
cussion
P
a
per
|
Discussion
P
a
per
|
Discussio
n
P
a
per
Atmos. Meas. Tech. Discuss., 6, 1409–1460, 2013 www.atmos-meas-tech-discuss.net/6/1409/2013/ doi:10.5194/amtd-6-1409-2013
© Author(s) 2013. CC Attribution 3.0 License.
Atmospheric Measurement
Techniques
Open Access
Discussions
Geoscientiic Geoscientiic
Geoscientiic Geoscientiic
This discussion paper is/has been under review for the journal Atmospheric Measurement Techniques (AMT). Please refer to the corresponding final paper in AMT if available.
On the interference of
86
Kr
2
+
during
carbon isotope analysis of atmospheric
methane using continuous flow
combustion – isotope ratio mass
spectrometry
J. Schmitt1, B. Seth1, M. Bock1, C. van der Veen1, L. M ¨oller2, C. J. Sapart3, M. Prokopiou3, T. Sowers3, T. R ¨ockmann3, and H. Fischer4
1
Climate and Environmental Physics, Physics Institute, & Oeschger Centre for Climate Change Research, University of Bern, Sidlerstrasse 5, 3012 Bern, Switzerland
2
Alfred Wegener Institute for Polar and Marine Research, Bremerhaven, Germany
3
Institute for Marine and Atmospheric research Utrecht, Utrecht University, Princetonplein 5, 3584CC Utrecht, The Netherlands
4
AMTD
6, 1409–1460, 2013Kr interference during carbon isotope analysis
J. Schmitt et al.
Title Page
Abstract Introduction
Conclusions References
Tables Figures
◭ ◮
◭ ◮
Back Close
Full Screen / Esc
Printer-friendly Version Interactive Discussion
Discussion
P
a
per
|
Dis
cussion
P
a
per
|
Discussion
P
a
per
|
Discussio
n
P
a
per
|
Received: 12 January 2013 – Accepted: 4 February 2013 – Published: 7 February 2013
Correspondence to: J. Schmitt ([email protected])
AMTD
6, 1409–1460, 2013Kr interference during carbon isotope analysis
J. Schmitt et al.
Title Page
Abstract Introduction
Conclusions References
Tables Figures
◭ ◮
◭ ◮
Back Close
Full Screen / Esc
Printer-friendly Version Interactive Discussion
Discussion
P
a
per
|
Dis
cussion
P
a
per
|
Discussion
P
a
per
|
Discussio
n
P
a
per
Abstract
Stable carbon isotope analysis of methane (δ13C of CH4) on atmospheric samples
is one key method to constrain the current and past atmospheric CH4 budget. A
fre-quently applied measurement technique is gas chromatography isotope ratio mass spectrometry coupled to a combustion-preconcentration unit. This report shows that
5
the atmospheric trace gas krypton can severely interfere during the mass spectromet-ric measurement leading to significant biases inδ13C of CH4if krypton is not sufficiently
separated during the analysis. The effect comes about by the lateral tailing of the peak
of doubly charged86Kr in the neighbouringm/z, 44, 45, and 46 Faraday cups.
Accord-ingly, the introduced bias is dependent on the chromatographic separation, the Kr to
10
CH4 mixing ratio in the sample, the mass spectrometer source tuning as well as the
detector configuration and can amount to up to several permil inδ13C. Apart from
tech-nical solutions to avoid this interference we present correction routines to a posteriori remove the bias.
1 Introduction
15
Methane is the third most important greenhouse gas besides water vapour and CO2.
The isotopic composition of atmospheric methane (CH4) provides important constraints
on globally integrated CH4sources and sinks. Both the concentration and the isotopic
composition of atmospheric CH4 in the past have been reconstructed from trapped
bubbles in ice cores as well as from the interstitial air in snow pack (firn) on polar
20
glaciers (Miller et al., 2002; Schaefer et al., 2006; Fischer et al., 2008; Kai et al., 2011; Levin et al., 2011; Sowers, 2011; Sapart et al., 2012). Originally, the dual inlet tech-nique coupled to an isotope ratio mass spectrometer (IRMS) was used (Stevens and Rust, 1982; Lowe et al., 1991). With the advent of the continuous flow (CF) technique (Matthews and Hayes, 1978), a growing number of groups have developed systems
25
AMTD
6, 1409–1460, 2013Kr interference during carbon isotope analysis
J. Schmitt et al.
Title Page
Abstract Introduction
Conclusions References
Tables Figures
◭ ◮
◭ ◮
Back Close
Full Screen / Esc
Printer-friendly Version Interactive Discussion
Discussion
P
a
per
|
Dis
cussion
P
a
per
|
Discussion
P
a
per
|
Discussio
n
P
a
per
|
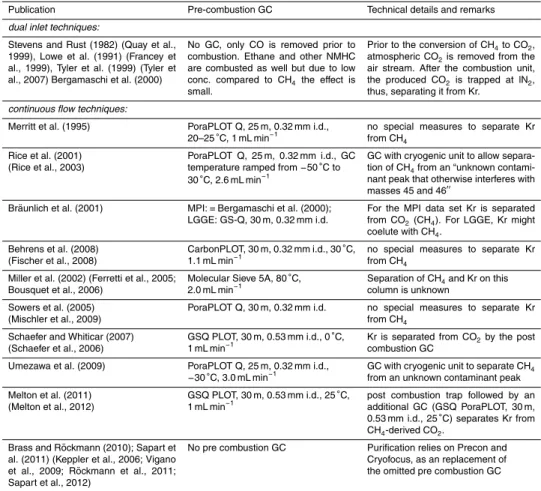
ice core samples (Merritt et al., 1995; Rice et al., 2001; Miller et al., 2002; Ferretti et al., 2005; Sowers et al., 2005; Schaefer and Whiticar, 2007; Behrens et al., 2008; Umezawa et al., 2009; Melton et al., 2011; Sapart et al., 2011). An overview of these
techniques is provided in Table 1. The general procedure for δ13C-CH4 analysis on
air samples using the CF-IRMS technique usually involves several steps to separate
5
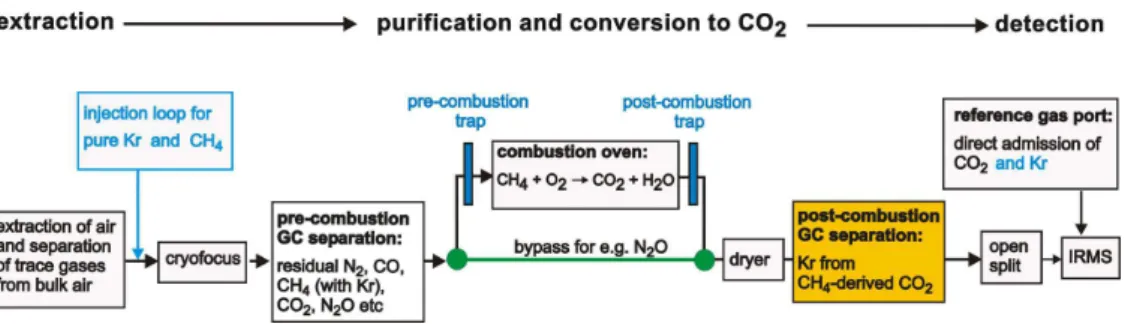
a large number of major and trace atmospheric components (see general scheme in Fig. 1). For ice core samples, an additional extraction step either by dry or melt
ex-traction has to be performed first. The purified CH4 is then admitted to a combustion
interface where CH4is converted to CO2, which is subsequently measured in the IRMS.
Here, the most abundant isotopologues of CO2 are measured using Faraday cups for
10
the mass to charge ratios (m/z) 44, 45 and 46. From these ion beam intensities, the
δ13C of CH4 is then calculated applying a correction for the isobaric contribution at
m/z45 due to the presence of12C17O16O (Craig, 1957).
The separation of CH4 from the bulk air components (N2, O2and Ar) and also from
minor components like CO is a delicate task. Usually, gas chromatography (GC) is used
15
to separate CH4from CO, N2, and CO2, which would otherwise interfere with the mass
spectrometric detection. In this respect, an interference with the atmospheric trace gas krypton has not yet been considered during the method development. The noble gas
krypton (Kr) has a natural atmospheric abundance of 1099±9 ppb (Aoki and Makide,
2005) and consists of many stable isotopes, with the most abundant being84Kr with
20
57 % and86Kr with 17 %. Although Kr is a trace gas, for several types of samples Kr is
as or even more abundant than CH4, e.g. for stratospheric samples (Rice et al., 2003;
R ¨ockmann et al., 2011) and air extracted from ice cores. Its atmospheric mixing ratios remained fairly constant over timescales of 100 000 yr with assumed changes being
<1 % between glacial and interglacial climate states due to ocean solubility effects
25
(Headly and Severinghaus, 2007; Ritz et al., 2011).
The physico-chemical properties of CH4and Kr are very similar making them hard to
separate one from another. Similar boiling points (Kr=119 K and CH4=111 K) make
AMTD
6, 1409–1460, 2013Kr interference during carbon isotope analysis
J. Schmitt et al.
Title Page
Abstract Introduction
Conclusions References
Tables Figures
◭ ◮
◭ ◮
Back Close
Full Screen / Esc
Printer-friendly Version Interactive Discussion
Discussion
P
a
per
|
Dis
cussion
P
a
per
|
Discussion
P
a
per
|
Discussio
n
P
a
per
difficult. To ensure a sufficient separation of CH4from Kr, the GC has to be operated at sub ambient temperatures (Sch ¨upbach et al., 2009) or at high flow rates (50 mL STP
min−1) with a packed column at 25°C (Burford and Bremner, 1972). Since none of the
Kr isotopes produces an ion that has exactly the same mass as the target ions with
m/z44,m/z45 andm/z46, Kr has not been regarded an issue duringδ13C analysis
5
of CH4until now.
Here we show that the doubly charged Kr isotope86Kr2+actually does interfere with
the measurement of δ13C of CH4 if Kr reaches the ion source together with the CO2
peak derived from CH4combustion. The magnitude of the
86
Kr2+ interference depends
on the preconcentration and GC separation of the Kr/CH4 mixture, the mass
spec-10
trometer and its source settings. We will show that the bias introduced by this
interfer-ence can be as large as 2 ‰ when dealing with samples with low CH4concentrations
(<400 ppb). The Kr interference scales with the atmospheric CH4mixing ratio since Kr
is a well mixed, inert atmospheric constituent with an atmospheric mixing ratio that is
assumed to vary by only <1 % between glacial and interglacial climate (Headly and
15
Severinghaus, 2007; Ritz et al., 2011).
We demonstrate how this interference comes about and how this issue can be resolved. Initially, we discuss ways to identify Kr anomalies in chromatograms from
δ13CH4analyses. In the second part of the manuscript we highlight techniques to
cor-rect for the Kr interference and compare these techniques.
20
Section 2 provides a brief overview on the setup of the four analytical systems where
we identified the Kr interference. In Sect. 3,δ13CH4chromatograms from the four
an-alytical systems illustrate the common features and differences of the Kr interference.
In Sect. 4, we describe tests that can be performed to determine if and where Kr inter-feres in the chromatogram. In further experiments we injected Kr into the GC flow and
25
directly into the IRMS to quantify the Kr impact onδ13CH4. It will be shown that the
interference in all three Faraday cups results from the 86Kr2+ ion beam, which has a
nominalm/zof 43 and has a broad, blurred tail that reaches all three Faraday cups. We
AMTD
6, 1409–1460, 2013Kr interference during carbon isotope analysis
J. Schmitt et al.
Title Page
Abstract Introduction
Conclusions References
Tables Figures
◭ ◮
◭ ◮
Back Close
Full Screen / Esc
Printer-friendly Version Interactive Discussion
Discussion
P
a
per
|
Dis
cussion
P
a
per
|
Discussion
P
a
per
|
Discussio
n
P
a
per
|
Finally, Sect. 5 presents a suite of possible solutions to either separate Kr from CH4
or CH4-derived CO2, or correct for this effect in existing data sets. While the paper is
structured in these consecutive steps, the reader might profit from a first quick look at
Figs. 3 and 7. Note that for practical reasons we use the term CH4 peak that
corre-sponds to the CO2peak from the original CH4 peak. Additionally,δ13C denotes δ13C
5
of a CH4sample without specifying it.
2 Experimental setup and air samples
For the measurements and experiments described in this paper we used four different
analytical systems. They are named after the institutes or cities in which they were developed; AWI (Alfred Wegener Institute for Polar and Marine Research), Bern
(Uni-10
versity of Bern), IMAU (Institute for Marine and Atmospheric research Utrecht), and PSU (Penn State University), respectively.
2.1 AWI system
The AWI system is described in detail by Behrens et al. (2008) and was used to
gen-erate aδ13CH4dataset covering the last deglaciation (Fischer et al., 2008) as well as
15
a new dataset covering the last glacial (M ¨oller et al., 2012). In short, the pre-purified
CH4sample (together with Kr) is cleaned up on a 30-m CarbonPLOT column at 30◦C
with a flow rate of ca. 1.1 mL min−1. The detector is an Isoprime IRMS equipped with
five Faraday cups: a universal triple collector form/z44, 45 and 46 to calculateδ13C
of CH4and two additional cups form/z28 andm/z32 for monitoring the efficiency of
20
the O2and N2separation of the trapping system. The five Faraday cups are connected
to the following feedback resistors: 5×10⁸Ω (“N2 cup”, m/z28), 1×10
9
Ω (“O2 cup”,
m/z32), 5×10⁸Ω (major m/z44), 5×10¹⁰Ω (minor1, m/z45), 1×10¹¹Ω (minor2,
AMTD
6, 1409–1460, 2013Kr interference during carbon isotope analysis
J. Schmitt et al.
Title Page
Abstract Introduction
Conclusions References
Tables Figures
◭ ◮
◭ ◮
Back Close
Full Screen / Esc
Printer-friendly Version Interactive Discussion
Discussion
P
a
per
|
Dis
cussion
P
a
per
|
Discussion
P
a
per
|
Discussio
n
P
a
per
2.2 Bern system
The Bern system is an updated and more versatile follow-up device compared to the AWI system and its description is currently in preparation. While the AWI system is
con-structed to measure onlyδ13C of CH4, the Bern system can analyse a larger suite of
trace gases (CH4, N2O and its stable isotopologues, xenon, ethane, propane, methyl
5
chloride). For that reason the Bern system is equipped with additional technical fea-tures allowing special experiments to be performed, e.g. a bypass valve for the
com-bustion oven, and additional valves to inject CH4 and Kr mixtures in helium (He) onto
the GC system (Fig. 1). Like the AWI system, the Bern system uses a 30-m
Carbon-PLOT column, at 30◦C with a flow rate of ca. 1.0 mL min−1. The Bern system uses
10
the identical Isoprime IRMS equipped with five Faraday cups: The raw data from the mass spectrometer measurements was processed using our in-house isotope software (Bock et al., 2010; Schmitt et al., 2011). After the identification of the Kr interference, two additional traps (pre-combustion trap and post-combustion trap) were installed to get rid of the Kr interference (Sect. 5.3). This new system is referred to as updated
15
Bern system.
2.3 IMAU system
A detailed description of the IMAU system is described elsewhere (Brass and R ¨ockmann, 2010; Sapart et al., 2011). A special feature of this system is that it lacks the pre-combustion GC common in other systems (Fig. 1). The IMAU system uses a
20
Thermo Finnigan Delta plus XP as detector. After the Kr interference was identified, the system was modified to remove the interference (Sect. 5.2). As shown in Fig. 1,
a GC was added after the conversion of CH4 to CO2 (post-combustion GC) and this
AMTD
6, 1409–1460, 2013Kr interference during carbon isotope analysis
J. Schmitt et al.
Title Page
Abstract Introduction
Conclusions References
Tables Figures
◭ ◮
◭ ◮
Back Close
Full Screen / Esc
Printer-friendly Version Interactive Discussion
Discussion
P
a
per
|
Dis
cussion
P
a
per
|
Discussion
P
a
per
|
Discussio
n
P
a
per
|
2.4 PSU system
The measurements done at PSU use the system described earlier in Sowers et al. (2005). The mass spectrometer is a Finnigan MAT 252. Modifications to remove the Kr interference are in process.
2.5 Air samples
5
All four labs measured a set of three cylinders, which were part of an international round robin study. These cylinders were filled at Niwot Ridge, Colorado in 2007 to
varying CH4 concentrations with a balance of ultra high purity air (no CH4) to mimic
the preindustrial period (∼900 ppb), the last glacial period (∼380 ppb) and the present
day (1870 ppb). The cylinders were then measured at NOAA to confirm the CH4
val-10
ues (GLA, cylinder no. CA01179=372 ppb, PI, cylinder no. CC71560=904 ppb, and
PD, cylinder no. CA03560=1831 ppb). While the CH4 concentration is different, the
Kr concentrations of all cylinders should be at natural abundance (1099 ppb), as the
GLA and PI cylinders were produced by diluting atmospheric air with CH4-free air.
The three cylinders have therefore the following CH4/Kr mixing ratios [CH4/Kr]. 0.33
15
(GLA), 0.82 (PI) and 1.69 (PD), thus [CH4/Kr] covers a range of factor 5. Additionally,
cylinder CA08289 (NOAA, Boulder) is used at Bern as a working standard containing
1508.2 ppb CH4and IMAU used a natural whole air working standard “GRO” Groningen
air with 1967.7 ppb CH4for the experiments where pure Kr is added.
3 First hints and visual inspection of chromatograms
20
The possible existence of an interfering compound during the IRMS analysis ofδ13C of
CH4on air samples was first described in 2001 when Rice et al. (2001) described “an
unknown contaminant peak”. As the contaminant could not be identified, it remained unclear if this was only a problem of their specific set-up or if it is a general feature of air samples. We believe that this unknown contaminant peak was Kr. In hindsight, it is
AMTD
6, 1409–1460, 2013Kr interference during carbon isotope analysis
J. Schmitt et al.
Title Page
Abstract Introduction
Conclusions References
Tables Figures
◭ ◮
◭ ◮
Back Close
Full Screen / Esc
Printer-friendly Version Interactive Discussion
Discussion
P
a
per
|
Dis
cussion
P
a
per
|
Discussion
P
a
per
|
Discussio
n
P
a
per
unfortunate that this interference was not resolved as subsequent groups developed
new systems forδ13C analysis on CH4 for air and ice core samples did not account
for the Kr interference. This led to the current situation where many systems do not
properly separate this “contaminant peak” from CH4, while others managed to separate
this interfering substance (Schaefer and Whiticar, 2007; Umezawa et al., 2009; Melton
5
et al., 2011).
The search for an interfering substance during δ13C analysis of air samples was
started during the interlaboratory intercalibration exercise involving both air cylinders
and glacial ice samples. The observed δ13C differences scaled with CH4 mixing
ra-tios and were as large as 2 ‰ for low CH4 samples (e.g. CH4<400 ppb). While the
10
co-elution of CH4 and Kr and the generation of a m/z43 peak due to 86Kr2+ was
recognised during the development phase of the Bern system, it was the addition of Kr
to a natural air sample (GRO) at IMAU that confirmed the Kr interference onδ13C. The
effects on the measured δ13C and δ18O values were significant and scaled linearly
with the Kr amount added. For each 1 ppm Kr addition, theδ13C values andδ18O
val-15
ues of the spiked air sample shifted by 0.79 ‰ and by 7.2 ‰ towards heavier values, respectively. This experiment clearly showed that Kr did interfere and could explain a large part of the discrepancies between the labs. However, it was unclear whether the
observed effect was specific for this system or if other systems were affected as well.
Additionally, the nature of this interference had to be elucidated in order to come up
20
with technical solutions and correction routines for older data sets.
Since the ion current intensities of this interference are difficult to visualize in the
chromatograms themselves, we chose to use the ratio of ion currents to identify the
position of the Kr peak relative to the CH4peak. Commercial IRMS software packages
usually provide graphs of the ion current ratios only for the measured total ion current
25
ratios, i.e. the combined intensities for the sample peak and the background. When the interference in one of the ion current ratios is very pronounced it is possible to identify it in the total ion current ratios (Rice et al., 2001; Schaefer and Whiticar, 2007).
AMTD
6, 1409–1460, 2013Kr interference during carbon isotope analysis
J. Schmitt et al.
Title Page
Abstract Introduction
Conclusions References
Tables Figures
◭ ◮
◭ ◮
Back Close
Full Screen / Esc
Printer-friendly Version Interactive Discussion
Discussion
P
a
per
|
Dis
cussion
P
a
per
|
Discussion
P
a
per
|
Discussio
n
P
a
per
|
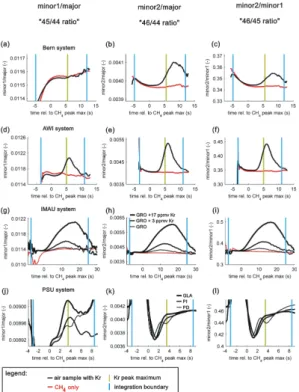
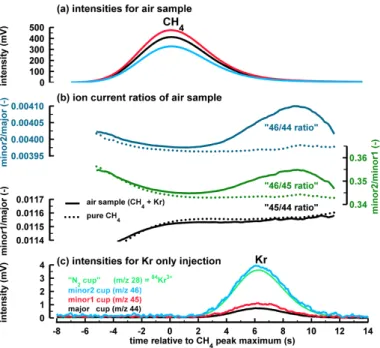
well separated. However, when the two peaks strongly overlap, the influence is less visible. A more sensitive way to identify such interferences in chromatograms is to inspect ion current ratio plots where the background signal has been subtracted from the measured signal to yield the signal of the sample peak only. The plots of this paper show ion current ratios which were corrected for the background signal. Figure 2 shows
5
the three ion current ratios for the time interval around the CH4 peak. The retention
time of the CH4 peak maximum is defined as 0 s. Throughout the paper we label the
three ion current ratios according to the involved Faraday cups and the m/zof the
ions which are commonly detected in this cup at CO2tuning: minor1/major (“45/44”),
minor2/major (“46/44”), and minor2/minor1 (“46/45”). Note the m/z pairs are put in
10
parenthesis (e.g. “45/44”) to indicate that only the target ions produced by CO2strictly
adhere to this rule. It will be shown in this paper that a small fraction of them/z43 beam
(86Kr2+) tails all the way into all three cups (major, minor1 and minor2). For the Bern,
AWI and IMAU system air samples containing Kr (Fig. 2 black lines) are compared with
pure CH4samples (Fig. 2 red lines). For the systems where it was explicitly determined
15
(see below and Figs. 3 and 4), the position of the Kr peak relative to the CH4 peak is
marked for orientation. As can be seen for all four systems, most ion current ratios
of samples containing Kr deviate from the ratios of pure CH4. While these anomalies
are well pronounced in all three ratios for the AWI system and resemble a Gaussian shape, the Bern system exhibits no visible anomaly for the “45/44 ratio”, which will be
20
discussed later. In the IMAU case, where Kr was added to a natural air in increasing amounts, one sees that the anomalies become larger with more Kr added. Note that the large anomalies are only the result of large amounts of Kr to an air sample (3-times or 17-(3-times the Kr amount of a natural sample (GRO). The anomalies of the natural air sample (GRO) are small and hard to detect without prior knowledge. In
25
AMTD
6, 1409–1460, 2013Kr interference during carbon isotope analysis
J. Schmitt et al.
Title Page
Abstract Introduction
Conclusions References
Tables Figures
◭ ◮
◭ ◮
Back Close
Full Screen / Esc
Printer-friendly Version Interactive Discussion
Discussion
P
a
per
|
Dis
cussion
P
a
per
|
Discussion
P
a
per
|
Discussio
n
P
a
per
appearance of this anomaly is specific for each of the four systems and depends on chromatographic separation and properties of the IRMS itself. These anomalies in the ion current ratios can be hidden especially when the background is not subtracted. It requires a careful comparison of the ratios from the natural air sample with those from pure CH4to recognise this matrix effect.
5
4 Experiments and results
4.1 Simple experiment to identify Kr in the chromatogram
The visual inspection of the chromatograms described above revealed that an inter-fering compound that we believe is Kr produces anomalies in the ion current ratios. Here we go one step further and provide a test to identify whether the retention time of
10
Kr overlaps with the CH4peak. As mentioned above, the behaviour of Kr and CH4on
GC columns is similar and can result in overlapping peaks with Kr eluting only a few
seconds after CH4. The following experiment uses the fact that for the electron
ener-gies used in the ion source of the IRMS (e.g. 80 eV for the Bern system) ions with two (and sometimes three) electrons removed are also produced (Denifl et al., 2002; King
15
and Price, 2008). Since the optical system of the IRMS separates ions according to
their mass to charge ratio (m/z), heavy isotopes like86Kr can be readily transformed
into m/z43 86Kr2+ ions that strike the imaging plane close to the major ion Faraday
cups. Therefore,86Kr2+ ions can be easily monitored by shifting the accelerating
volt-age (AV) to higher values, e.g. 4030 V instead of 3975 V for the CO2focusing for the
20
Bern Isoprime so that them/z4386Kr2+ ions are detected in the normal m/z44 cup.
The m/z43 beam (86Kr2+) falls into the major cup, while the m/z45 beam (mostly
13
C16O16O) falls into minor2 monitoring the position of the CH4peak. This focusing test
has the advantage that it can be run on any system with any natural air sample without
modifications to the CH4separation system. The results of these focusing experiments
25
AMTD
6, 1409–1460, 2013Kr interference during carbon isotope analysis
J. Schmitt et al.
Title Page
Abstract Introduction
Conclusions References
Tables Figures
◭ ◮
◭ ◮
Back Close
Full Screen / Esc
Printer-friendly Version Interactive Discussion
Discussion
P
a
per
|
Dis
cussion
P
a
per
|
Discussion
P
a
per
|
Discussio
n
P
a
per
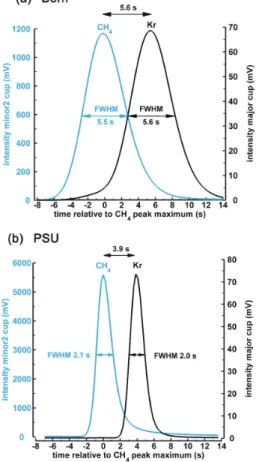
|
CH4 from Kr is about 6 s for the Bern system. Since the peak width (FWHM) for both
CH4and Kr is also 5–6 s, both peaks do overlap considerably (Fig. 3a) but the overlap
is system dependent. From this experiment we can derive the following conclusions. First, a considerable amount of doubly charged Kr ions are produced within the source
of the IRMS. Second,86Kr2+ ions allow identifying the retention time of Kr and illustrate
5
that the GC conditions of the Bern and PSU systems are insufficient to separate Kr
from CH4. Third, the position of the Kr peak and the observed anomalies seen in the
ion current ratios (Fig. 2) are similar and suggest that Kr causes these anomalies.
4.2 Injections of pure Kr into GC flow
The visual peak inspection and the overlap of CH4and Kr from the focusing exercise
10
point to Kr as the source of the interference. However, at this stage it remains unclear
how Kr might interfere with theδ13C measurement since a direct isobaric effect seems
unlikely as none of the Kr isotopes are expected to fall into the given Faraday cups
at their nominalm/z or m/2z (for doubly charged ions) ratios. One possible
mecha-nism generating these anomalies could be that the presence of Kr in the ion source
15
changes the relative ionisation efficiency of the CO2 isotopologues in the sense of
“Ionisation Quench” coined by Meier-Augenstein et al. (2009) In dual inlet applications such matrix interactions of gases in the ion source are commonly termed “chemical
slope” (Severinghaus et al., 2003) and refer to differences in the composition of
sam-ple and standard gas mixture. While correcting for this effect is common practice, the
20
underlying processes in the ion source are poorly understood.
Alternatively, a more direct effect of Kr could be invoked if deflected Kr ions fell into the Faraday cups. Again, the closest conceivable candidate is the doubly charged Kr
isotope86Kr2+ withm/z43. A simple test to distinguish between these two possibilities
is the injection of pure Kr. If the pure Kr does not produce a positive signal by itself then
25
the interference relies on the interaction of CO2and Kr in the ion source in the sense
AMTD
6, 1409–1460, 2013Kr interference during carbon isotope analysis
J. Schmitt et al.
Title Page
Abstract Introduction
Conclusions References
Tables Figures
◭ ◮
◭ ◮
Back Close
Full Screen / Esc
Printer-friendly Version Interactive Discussion
Discussion
P
a
per
|
Dis
cussion
P
a
per
|
Discussion
P
a
per
|
Discussio
n
P
a
per
Kr ions are deflected from their expected flight path to fall into Faraday cups with up to
3 units higherm/zvalues.
To perform this experiment a mixture of pure Kr in He was injected via the injec-tion loop into the GC flow of the Bern system (see Fig. 1). The amount of injected Kr represents ca. 10 mL STP natural air, thus, a similar amount as is used in our routine
5
ice core measurements. The injected Kr is cryofocused first and then sent to the pre-combustion GC (Fig. 1). After the Kr peak left the GC, the flow passes a dryer before
admitting it to the ion source of the IRMS (operated at CO2configuration). Note that the
combustion oven is bypassed in this experiment to prevent the generation of a small
CO2 peak from trace amounts of residual CH4 present in the He flow. The results of
10
this experiment are shown in Fig. 4, together with the measurement of a natural air sample. Kr itself produces signals in all Faraday cups at a retention time of ca. 6 s after
the usual CH4 peak maximum (Fig. 4c). This result supports the idea that Kr alone
produces the signals detected in the three cups. A comparison with the signal inten-sities of the air sample (Fig. 4a) shows that the Kr inteninten-sities are clearly too small to
15
be directly seen in the air sample itself, e.g. for the minor2 cup the Kr signal is 4 mV at its maximum while for the air sample the minor2 signal is ten times higher. Besides
these two basic features, the experiment with pure Kr affords us the opportunity to
investigate the general features observed in the ion current ratios of the air sample.
A combusted CH4 sample produces signal intensities (mV) in the three Faraday cups
20
reflecting the natural abundance of the CO2 isotopologues. For example, the signal of
the major cup is a bit higher than the minor 2 signal (Fig. 4a). In contrast, Kr produces a 4-times higher minor2 signal compared to the signal on the major cup (Fig. 4c). In other
words, the signals produced by Kr have a very different isotopic fingerprint compared
to the CO2 signals. In this example dealing with minor2 vs major cup (“46/44 ratio”)
25
the Kr signals translate into a very heavy apparentδ18O signature since theδ18O is
mainly determined by the “46/44 ratio”. When such an anomaly is added to the signals
from combusted CH4, the observed “46/44 ratio” will increase as it is the case for the
AMTD
6, 1409–1460, 2013Kr interference during carbon isotope analysis
J. Schmitt et al.
Title Page
Abstract Introduction
Conclusions References
Tables Figures
◭ ◮
◭ ◮
Back Close
Full Screen / Esc
Printer-friendly Version Interactive Discussion
Discussion
P
a
per
|
Dis
cussion
P
a
per
|
Discussion
P
a
per
|
Discussio
n
P
a
per
|
sample and Kr are comparable, with the signal on minor1 being slightly higher than on major (Fig. 4a and b). Consequently, the signals created by Kr do not produce a visible anomaly in the minor1/major ratio as the “45/44 ratio” of the air sample closely
follows the ratio of pure CH4 (Fig. 4b “45/44 ratio”). Note that this close match of the
“45/44” signature of Kr and CO2is just a coincidence and only observed for the Bern
5
system. The other three systems show anomalies in the “45/44 ratio” (Fig. 2) which
translate into too heavyδ13C values for natural air samples as well. In addition to the
more direct influence of the “45/44” anomaly onδ13C, the “46/44” anomaly also alters
δ13C of CH4samples. This is due to the fact that the
17
O correction algorithm (Craig, 1957; Santrock et al., 1985) relies on assumptions regarding the natural proportions of
10
the stable oxygen isotopes, i.e. the relative contribution of17O (12C17O16O withm/z
45) and18O (12C18O16O withm/z46), which are violated by the Kr signals.
4.3 Injection of pure Kr at varied accelerating voltage
The previous experiments clearly showed that Kr is responsible for the observed ef-fects; yet, the underlying mechanism cannot be unambiguously derived from these
ex-15
periments. From the proximity of them/z43 beam produced by86Kr2+ we have come
up with two hypotheses. The first hypothesis assumes that the observed signals de-tected in the three Faraday cups are caused by true ions with a mass per charge ratio
corresponding to the nominalm/zof the cups, i.e.m/z44,m/z45 andm/z46. Since
ions withm/z43 are available in the source one might assume that light gases or their
20
ions (e.g. He, H2or H) might react with86Kr2+ ions to form molecules or adducts
(Leck-rone and Hayes, 1998; Sessions et al., 2001) which then could provide the necessary
m/z44,m/z45 andm/z46 signals. The other hypothesis assumes that the lateral tail
of them/z43 beam (86Kr2+) extents all the way tom/z46, thus covering 3m/zunits.
The fact that the major ion beam contributes some intensity to the neighbouring minor
25
was already observed during the early days of dual inlet-IRMS and termed “pressure
effect” or “pressure broadening” and has been treated with abundance sensitivity
AMTD
6, 1409–1460, 2013Kr interference during carbon isotope analysis
J. Schmitt et al.
Title Page
Abstract Introduction
Conclusions References
Tables Figures
◭ ◮
◭ ◮
Back Close
Full Screen / Esc
Printer-friendly Version Interactive Discussion
Discussion
P
a
per
|
Dis
cussion
P
a
per
|
Discussion
P
a
per
|
Discussio
n
P
a
per
effect are also of concern during clumped isotope analysis of CO2where far reaching
tails of the major beam on the distant minor beams have been investigated (He et al.,
2012). A peak tailing effect was also observed during stable sulphur analysis using
SF6giving rise to a abundance sensitivity correction to prevent scale compression and
accuracy problems (Ono et al., 2006). However, in these cases it is the regular major
5
beam which contributes intensity to the minor beam and not a contaminant species like Kr as assumed in our case. Figuring out the actual process leading to this interference
is not only helpful to understand the different phenomena seen in the four investigated
systems, but also to make assumptions about the stability of this interference over time and its sensitivity to changes in tuning parameters etc. These characteristics are
10
important for developing robust correction routines on existing data sets.
To explore the nature of the interference in more detail we conducted two different
experiments where the ion current intensities are monitored as a function of the accel-erating voltage (AV). In the first experiment, Kr was repeatedly injected into the GC flow while the AV was slightly changed after each injection. In a second experiment, Kr was
15
continuously admitted to the ion source through a capillary while the AV was changed over a wide range.
4.3.1 Kr injections onto GC flow at varied accelerating voltage
In the following experiment pure Kr was repeatedly (10 times) injected into the GC flow of the Bern system and cryofocused prior to GC separation. The amount of injected Kr
20
roughly matches the Kr amount of a 10 mL air sample to provide realistic measurement
conditions. Measurements were conducted using the CO2configuration, but after each
Kr peak the AV of the ion source was slightly changed to cover a range from −5 V
to +2 V relative to the peak centre (PC) value of the CO2 tuning. Each Kr peak is
preceded by a rectangular CO2 peak from the reference port (“standard on-offtype”)
25
and measured at the same AV to monitor the effect on the δ13C andδ18O values of
AMTD
6, 1409–1460, 2013Kr interference during carbon isotope analysis
J. Schmitt et al.
Title Page
Abstract Introduction
Conclusions References
Tables Figures
◭ ◮
◭ ◮
Back Close
Full Screen / Esc
Printer-friendly Version Interactive Discussion
Discussion
P
a
per
|
Dis
cussion
P
a
per
|
Discussion
P
a
per
|
Discussio
n
P
a
per
|
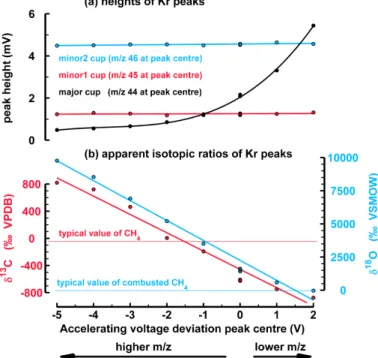
fall into their respective Faraday cups. As a consequence, theδ13C and δ18O values
of the rectangular CO2 peaks are only slightly affected by these AV shifts (ca. 2 ‰
for bothδ13C andδ18O, data not shown). In contrast, the maxima of the Kr peaks in
the major cup (m/z44 at PC) increase from ca. 0.5 mV to almost 6 mV, i.e. a factor
of 12 as the AV is increased from−5 V to+2 V (Fig. 5a). Since the peak heights and
5
areas for minor1 (m/z45 at PC) and minor2 (m/z46 at PC) remain fairly constant, the
apparent isotopic ratiosδ13C andδ18O of the Kr peaks show huge changes reflecting
these drastic changes in the beam ratios (Fig. 5b). We calculated these apparentδ13C
andδ18O values by integrating the peak areas of the tiny Kr peaks for the three cups
and applied the same algorithm as if they were CO2 peaks. Our interpretation is that
10
by increasing AV, the amount of 86Kr2+ falling into the major cup quickly increases
since the steep tail of this m/z43 beam is moved closer to the edge of the major
cup. The observation of this strong intensity increase on the major cup thus rules out
the notion of an ion withm/z44 producing this interference. However, for the rather
constant intensities measured on minor1 and minor2 this experiment cannot rule out
15
the existence of an ion at m/z45 or m/z46 since the AV changes were too small
to move the centred beam out of the Faraday cup as can be derived from the rather
constantδ13C and δ18O values of the CO2 rectangular peaks (data not shown) and
illustrated in Fig. 7.
Apart from identifying the nature of this interference, this experiment provides
valu-20
able information regarding the effects of the Kr interference during sample
measure-ments. From Fig. 5 it is obvious that the apparent δ13C or δ18O signatures of the Kr
interference are not constant but depend on the peak centre setting. Consequently,
the influence of Kr on the calculated δ13C values of CH4 samples is not a constant
property for any instrument but both the sign and the magnitude of this effect are
sen-25
sitive to the setting and stability of the source. As an example, at an AV offset of−1.5 V
with respect to the peak centre the apparentδ13C value of the Kr interference
inter-sects with the range ofδ13C values typical for natural CH4samples (around−40 ‰ to
AMTD
6, 1409–1460, 2013Kr interference during carbon isotope analysis
J. Schmitt et al.
Title Page
Abstract Introduction
Conclusions References
Tables Figures
◭ ◮
◭ ◮
Back Close
Full Screen / Esc
Printer-friendly Version Interactive Discussion
Discussion
P
a
per
|
Dis
cussion
P
a
per
|
Discussion
P
a
per
|
Discussio
n
P
a
per
effect onδ13C of CH4will be relatively small and hard to detect. However, for AV offsets
<−1.5 V the measured δ13C values will be heavier and for AV offsets >−1.5 V δ13C
will become progressively lighter. Forδ18O, the Kr bias will always push towards higher
values. Note that these values are specific for a certain tuning of a specific instrument.
How subtle differences can produce very different effects can be seen in the results of
5
the AWI and Bern instruments, which have identical IRMS. The AWI system shows a pronounced effect in “45/44” (i.e.δ13C) while the effect on “45/44” for the Bern instru-ment is small (compare Fig. 2a and d). Usually, the AV at peak centre is determined automatically during the peak centre procedure, thus the bias could be relatively con-stant for a certain tuning. However, after performing a peak centre its actual position
10
can move by up to 1 V over the course of hours, thus, generating a time dependent bias
on theδ13C values during a measurement, which will add noise to the data set. On the
other hand, the close relationship between apparentδ13C andδ18O values provides a
means to correct biasedδ13C measurements if the expectedδ18O value of a sample
can be predicted or assumed with good precision. This situation often holds forδ13C
15
since the δ18O value of the CH4-derived CO2 is not dependent on the CH4 sample
but set by the O2used during the combustion process. Therefore, the tightδ
18
O–δ13C
correlation seen in Fig. 5b can be used to correct samples which are affected by the Kr
interference (see Sect. 5.6).
4.3.2 Admission of Kr into the ion source at varied accelerating voltage
20
The aim of the following experiments is to better characterise the tail of the86Kr2+beam
using a widerm/zrange. With this experiment we demonstrate that the interferences
seen in all three Faraday cups have their origin in the same “master beam”,m/z43.
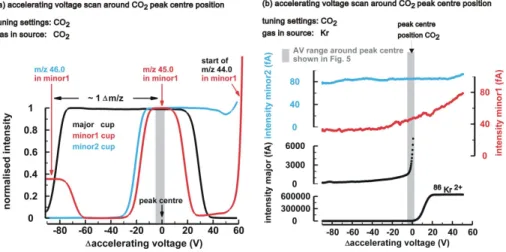
To better understand the AV scan with pure Kr, we first present AV scan for CO2
(Fig. 6a). For practical reasons, the cups of the triple collector unit (universal collector)
25
of most manufacturers have different widths (resolving slit width) to accommodate
mul-tipurpose usage, e.g.δ15N of N2,δ 18
AMTD
6, 1409–1460, 2013Kr interference during carbon isotope analysis
J. Schmitt et al.
Title Page
Abstract Introduction
Conclusions References
Tables Figures
◭ ◮
◭ ◮
Back Close
Full Screen / Esc
Printer-friendly Version Interactive Discussion
Discussion
P
a
per
|
Dis
cussion
P
a
per
|
Discussion
P
a
per
|
Discussio
n
P
a
per
|
is roughly equivalent to 1m/zdifference in this mass range. Figure 6b shows the ion
current intensities for the three cups in fA for the same AV scan, but with Kr being
ad-mitted to the ion source. The86Kr2+ ion beam with nominallym/z43.0 starts to fall into
the major cup at around+5 V and reaches plateau intensity at+20 V (“transition zone”)
with around 600 000 fA (Fig. 6b bottom panel). The blow-up of the major signal reveals
5
that the intensity left from the transition zone (towards higher m/z) does not quickly
approach zero, but gradually decays when moving to−90 V, i.e. corresponding to ions
with a nominalm/zof already 45 (see Fig. 6a with 85 V corresponding to about 1m/z
unit). The continuation of this tail to even higherm/zis visible in the signal of minor1,
where the intensity decreases from ca. 80 fA at+60 V (corresponding to ca.m/z44.7)
10
to ca. 30 fA at−90 V (corresponding to ca.m/z46.0). Similarly, the continuation of the
tail is visible in minor2, where the signal becomes almost flat at around 80 fA, covering
a range ofm/z45.7 tom/z47.0. The fact that the Kr tail produces higher intensities for
minor2 compared to minor1 reflects the contrasting widths of the two cups: The wider minor2 cup collects ions from a larger mass range of the Kr tail than the smaller minor1
15
cup (see also scheme of Fig. 7). Again, it is obvious that very small changes in the
choice of the peak centre position can have a large effect on the apparent δ13C and
δ18O signature of the Kr interference as already seen in Fig. 5b. Further, the flatness
of the Kr tail in the region ofm/z45 andm/z46 explains the strong linear correlation
ofδ13C andδ18O seen in the other experiments and measured air samples and is the
20
basis for one of the correction methods explained below which rely on a linear relation
of them/z45 andm/z46 biases.
4.4 Summary of experiments and concept of Kr interference
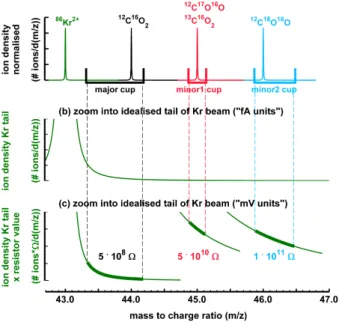
Figure 7 shows a schematic drawing which illustrates the involved Faraday cups and
the positions of the respective ion beams for CO2 and
86
Kr2+. For the construction of
25
the86Kr2+ tail shown in the lower panels (Fig. 7b and c) we used the data of Figs. 5
AMTD
6, 1409–1460, 2013Kr interference during carbon isotope analysis
J. Schmitt et al.
Title Page
Abstract Introduction
Conclusions References
Tables Figures
◭ ◮
◭ ◮
Back Close
Full Screen / Esc
Printer-friendly Version Interactive Discussion
Discussion
P
a
per
|
Dis
cussion
P
a
per
|
Discussion
P
a
per
|
Discussio
n
P
a
per
beam maximum is highly non-Gaussian. Most ions are well focussed into a sharp beam
with steep flanks as intensity rapidly drops to<1/1000 of the plateau level for a 15 V
shift in the accelerating voltage (Fig. 6b), corresponding to about 0.2m/z units. The
remarkable feature of the86Kr2+ beam is that it does not continue this rapid drop but
decays only very slowly when its intensity reaches about 1/10 000 of the plateau signal
5
at the 20 V distance from the plateau edge (Fig. 6b). To provide a mathematical model allowing a fat-tailed distribution, a Cauchy distribution was fitted and parameters were selected to resemble the observed data of Figs. 5 and 6b. The positioning of the beams relative to the Faraday cups in the drawing aims to reflect the situation at the peak centre. The plotted distribution (Fig. 7) shows the general features of our experiments
10
with Kr and illustrates the interference, but cannot be used in a quantitative way. Note that the plotted distribution mimicking the lateral tail of the Kr beam represents the signal along the optical plane with the Faraday cups.
While the ion density of the 86Kr2+ beam gradually declines further away from the
peak maximum atm/z43, the transformation from the ion current (apparent fA unit) to
15
the voltage unit (apparent mV unit) overcompensates this drop. As a consequence, the signals (on an apparent mV unit) gained from minor1 and minor2 are higher compared to the major signal. The signal intensities are spatially integrated according to the width of the Faraday cups, the wider the cup the more ions from the tail are collected. The integrated signal from minor2 is higher than the integrated minor1 signal. In summary,
20
the Kr interference signal of a certain Faraday cup is not only a function of the amount
of m/z43, but depends both on the lateral decay of the signal (distribution function
towards higher apparentm/z) and the width of the Faraday cup.
Using this peak tailing concept, one can explain the following observations:
– pure Kr produces signals at nominalm/z44 and higher
25
– the magnitude of the Kr interference depends on the mass spectrometer
– the tuning parameters of the ion source can alter the interferences
AMTD
6, 1409–1460, 2013Kr interference during carbon isotope analysis
J. Schmitt et al.
Title Page
Abstract Introduction
Conclusions References
Tables Figures
◭ ◮
◭ ◮
Back Close
Full Screen / Esc
Printer-friendly Version Interactive Discussion
Discussion
P
a
per
|
Dis
cussion
P
a
per
|
Discussion
P
a
per
|
Discussio
n
P
a
per
|
We want to point out that these observations refer to IRMS measurements in continu-ous flow mode where He is admitted continucontinu-ously to the ion source leading to a typical
pressure of 2×10⁶ mbar. In dual inlet mode the source pressure is about factor 10
lower. We have indication from additional tests with dual inlet IRMS measurements (IMAU), where we admitted Kr without He background, that here the Kr interference is
5
less pronounced. Based on these results we speculate that the well focusedm/z43
ion beam is better focussed at dual inlet conditions, but in continuous flow mode it is broadened by collisions with He ions in the source or He atoms in the flight tube. A peak broadening during continuous flow-IRMS compared to dual inlet was also
ob-served during stable sulphur isotope analysis using SF6(Ono et al., 2006).
10
5 Solutions for the Kr interference
The observations and experiments discussed above show that Kr can severely interfere
with δ13C measurements of atmospheric CH4 samples, if the Kr peak is within the
integration boundaries of the CH4 peak. Given the fact that the Kr interference can
produce systematic offsets exceeding the analytical precision, we propose the following
15
strategies to account for this effect.
1. GC separation of Kr from CH4prior to conversion to CO2
2. GC separation of Kr from CO2after the CH4to CO2conversion
3. Cryogenic separation of Kr from CO2after the CH4to CO2conversion
4. Raw data correction using anomalies in the ion current ratios
20
5. Early peak cut-offat the right integration boundary
AMTD
6, 1409–1460, 2013Kr interference during carbon isotope analysis
J. Schmitt et al.
Title Page
Abstract Introduction
Conclusions References
Tables Figures
◭ ◮
◭ ◮
Back Close
Full Screen / Esc
Printer-friendly Version Interactive Discussion
Discussion
P
a
per
|
Dis
cussion
P
a
per
|
Discussion
P
a
per
|
Discussio
n
P
a
per
It is beyond the scope of this paper to discuss all strategies in great detail. Sepa-rate technical papers will deal with the individual solutions applied to a particular sys-tem. Instead, we want to provide an overview of possible solutions to let the reader make a first selection on the preferred strategy. The six strategies fall into two classes. Strategies 1 to 3 are technical solutions, which prevent the peak overlap in the ion
5
source, thus avoid the Kr interference for new measurements. Strategies 4 to 6 allow correcting existing datasets. These correction strategies were specifically developed
for the existing datasets of the respective systems. As the four systems show diff
er-ent characteristics of the Kr interference, these correction strategies cannot be applied interchangeably. Consequently, we could not compare the performance of the three
10
correction approaches, but discuss their strengths and limitations individually.
5.1 GC separation of Kr from CH4
Of all the proposed solutions in this Section, the chromatographic separation of CH4
from Kr seems to be the most elegant and straightforward way since no additional de-vice is needed besides the basic set up described by Merritt et al. (1995) The only
re-15
quirement is that the chromatographic separation is good enough to allow a sufficient
separation of CH4 and Kr. Without knowing that Kr was the “unknown contaminant
peak”, Rice et al. (2001) were the first to master this problem with a cryo-GC at−50◦C.
To maintain narrow peak width, they used high flow rates of 2.6 mL min−1, thus a
fac-tor 2.5 higher than typically used for ice core analysis. This approach is also applied
20
by others (Umezawa et al., 2009). Schaefer and Whiticar (2007) followed the same
route and used a sub ambient GC at 0◦C to separate what they call N2O. However,
they concluded that separation at 0◦C was insufficient and a second GC column was
introduced after the combustion oven.
With the Bern system, we tested the option to better separate CH4 from Kr using
25
lower GC temperatures. For the experiments we used a 30-m PoraPLOT column at
a flow rate of ca. 1 mL min−1 and measured the chromatographic separation between
AMTD
6, 1409–1460, 2013Kr interference during carbon isotope analysis
J. Schmitt et al.
Title Page
Abstract Introduction
Conclusions References
Tables Figures
◭ ◮
◭ ◮
Back Close
Full Screen / Esc
Printer-friendly Version Interactive Discussion
Discussion
P
a
per
|
Dis
cussion
P
a
per
|
Discussion
P
a
per
|
Discussio
n
P
a
per
|
onto the GC flow and cryofocused (Fig. 1). Measurements were done under CO2tuning
conditions. We did not inject CH4 but used the small amount of CH4 cryofocused as
blank contribution. This small CH4amount turned out to be ideal for these experiments
as an amount of CH4comparable to samples would otherwise overwhelm the Kr peak.
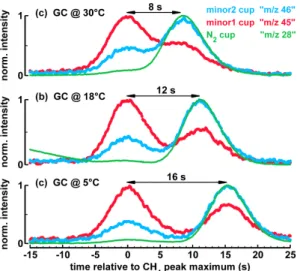
The results are shown in Fig. 8. For 30◦C (Fig. 8a) the separation is only 8 s, thus,
5
insufficient, and results in comparable retention time differences as the CarbonPlot
column (ca. 6 s). A reduction to 5◦C (Fig. 8c) shows that the separation of CH4from Kr
is much better and amounts to 16 s allowing Kr-freeδ13C analysis of CH4. However,
this low GC temperate had the disadvantage that N2O eluted very late and showed a
very broad peak shape, which is not suitable for isotope analysis on N2O. Since in our
10
ice core analysis we measureδ13CH4 and N2O isotopes in the same run we did not
choose this route but decided to follow the route described in Sect. 5.3.
5.2 Chromatographic separation after the CH4-CO2conversion
The following section describes the separation of Kr from the combusted CH4 peak
using a post-combustion GC column. As shown above and from other studies (Rice et
15
al., 2001), a sufficient separation of CH4 from Kr requires low GC temperatures due
to similar physico-chemical properties of CH4 and Kr on the GC column. However,
after the combustion oven the resulting CO2 is relatively easy to separate from Kr
since already at ambient temperatures (e.g. 30◦C) Kr elutes much earlier than CO2on
regular GC columns.
20
The usage of a post-combustion GC column forδ13C of CH4 was first described in
Schaefer and Whiticar (2007), who included this device to separate what they
inter-preted as N2O. In the following, we show results from the updated IMAUδ
13
C system, where also a post-conversion GC column is used to tackle the Kr interference (Fig. 1). The additional component consists of a 12.5 m piece of PoraPlotQ column in a GC
25
which is operated at 24◦C. This GC column was inserted between the Nafion dryer
AMTD
6, 1409–1460, 2013Kr interference during carbon isotope analysis
J. Schmitt et al.
Title Page
Abstract Introduction
Conclusions References
Tables Figures
◭ ◮
◭ ◮
Back Close
Full Screen / Esc
Printer-friendly Version Interactive Discussion
Discussion
P
a
per
|
Dis
cussion
P
a
per
|
Discussion
P
a
per
|
Discussio
n
P
a
per
from CO2 (CH4) of about 30 s (Fig. 9b). The figure also nicely shows the response of
the IMAU mass spectrometer to pure Kr resulting in a very pronounced peak on the
minor2 cup, collecting the nominalm/z46 ions. A much smaller peak can be seen on
minor1 cup (nominal m/z45). This observation fits to the experiments were pure Kr
was added to an air sample and a strong enrichment forδ18O was observed while the
5
enrichment forδ13C was smaller (7.2 ‰ for δ18O, and 0.79 ‰ for δ13C for 1 ppm Kr
added). In contrast to the Bern system, here the Kr signal on the major cup<0.1 mV
and too small to be visible, thus, the intensities on minor1 and minor2 become fully
expressed as anomalies leading to the strong biases inδ13C andδ18O observed for
the original IMAU system (compare with the Bern system Figs. 4, 5 and 10).
10
5.3 Cryogenic separation of Kr from CO2after the CH4-CO2conversion
In this section we describe an alternative procedure to separate CO2 and Kr after
the combustion oven, based on the fact that CO2 can be trapped on a capillary at
liquid nitrogen (lN2) temperature (−196◦C) while Kr passes this trap. In the updated
Bern system, such a trap is inserted after the combustion oven (post-combustion trap,
15
Fig. 1). Such a trap not only separates CO2from Kr but also acts as a cryofocus
yield-ing narrow, high-intensity CO2peaks after the capillary is lifted out of the lN2 (Melton
et al., 2011). A second movable trap is inserted before the combustion oven to trap
any residual CO2 from the GC flow (pre-combustion trap, Fig. 1). With the addition of
these two traps, Kr now elutes some 25 s before the sharp CH4-derived CO2 peak,
20
thus, provides baseline separation between the two species (Fig. 10). The timing of the post-combustion trap is a critical parameter of this strategy to avoid trapping traces of combusted sample CO. While most of the CO is removed during the first purification
step, a small fraction of CO remains and elutes before the CH4peak and becomes
com-busted to CO2as well (Fig. 10b). As can be seen in the example chromatogram, the
25
post combustion trap (trap down arrow in Fig. 10b) is lowered only after the CO-derived
CO2 peak has passed the trap. After a trapping time of 50 s, the capillary is lifted and
AMTD
6, 1409–1460, 2013Kr interference during carbon isotope analysis
J. Schmitt et al.
Title Page
Abstract Introduction
Conclusions References
Tables Figures
◭ ◮
◭ ◮
Back Close
Full Screen / Esc
Printer-friendly Version Interactive Discussion
Discussion
P
a
per
|
Dis
cussion
P
a
per
|
Discussion
P
a
per
|
Discussio
n
P
a
per
|
time is basically the same as without the trap. After the CO2 peak is measured by the
IRMS, a valve is switched to allow the N2O peak to bypass the combustion oven (Fig. 1
green circles). Note the different peak shape characteristics of the CH4-derived CO2
peak and the N2O peak due to the cryofocusing step.
5.4 Subtracting the Kr interference peak from raw data
5
The above hardware solutions all eliminate the Kr interference. However, extant data sets require an algorithm for correcting for the Kr interference. One method for making the correction relies on the anomalies seen in the ion current ratios, which are par-ticularly pronounced in the data set measured with the AWI system (Fig. 11a). This approach requires the time series of the IRMS acquisition file (raw data file) and
soft-10
ware to read and process this data (Bock et al., 2010; Schmitt et al., 2011). With a set of equations the signal intensity of the Kr peak is calculated which produced these anomalies in the first place. The time series of these reconstructed Kr interferences are then subtracted from the measured time series to yield the corrected time series. The
latter one is then used to calculate theδ13C values.
15
In detail, the correction is based on the following equations withi representing the
time series of an ion current andRthe ratio of a pair of ion currents. In case of the AWI
measurements the time series covers the interval beginning at the CH4peak start and
extends to 10 s after the maximum of the CH4peak (see Fig. 11b). Note, the following
equations and explanation only show the correction of the Kr interference oni45 and
20
R45/44, the correction fori46 is analogue to thei45 example. We start by assuming the
CO2 peak is pure CO2 in the ion source, i.e. without Kr interference, the major cup
exclusively collects ions with m/z44 generating the time series of i44, minor1 only
m/z45 (i45), and minor2 onlym/z46 (i46). In this case, the ion current ratioRmeasured45/44
is the ratio of the two measured ion currents originating exclusively from CO2 since
AMTD
6, 1409–1460, 2013Kr interference during carbon isotope analysis
J. Schmitt et al.
Title Page
Abstract Introduction
Conclusions References
Tables Figures
◭ ◮
◭ ◮
Back Close
Full Screen / Esc
Printer-friendly Version Interactive Discussion
Discussion
P
a
per
|
Dis
cussion
P
a
per
|
Discussion
P
a
per
|
Discussio
n
P
a
per
imeasured45 equalsiCO45
2 andi
44
measuredequalsi 44
CO2 given by
Rmeasured45/44 =R(pure CO45/44
2)=i
45 CO2/i
44 CO2=i
45
measured/i 44
measured (1)
However, for a real sample with Kr interference Eq. (1) is not valid for the entire peak.
Instead, the entire CO2 peak region must be divided into two parts. The left part is
dominated by the CO2signals and covers the region from ca. 4 s before the CH4peak
5
maximum to ca. 2 s after the CH4 peak maximum (Fig. 11). Equation (1) is only valid
for this part. In contrast, the right part is contaminated by Kr. Here, the ion current
imeasured45 is the sum ofiCO45
2 and the Kr interference. To generate an anomaly in the ion
current ratio of the CO2 sample, the ion current ratio of the Kr peak must be different
from the ion current ratio of the sample. If the ion current ratios of the interfering signals
10
exactly match those of the sample peak, theδ13C andδ18O values will be unchanged.
For that reason, only the R45/44 anomaly to pure CO2 is calculated in the following
equations, with the part of the total iKr45 signal causing this anomaly called iKr-excess45 .
The sign ofiKr-excess45 is positive when the minor1/major ratio of the Kr peak is greater
than the minor1/major ratio of the pure CO2 interval. This case is comparable to the
15
situation of Fig. 4b left side with AV<−2 V. Conversely, iKr-excess45 can be negative for
cases resembling the situation in Fig. 4b right side with AV>−1 V. Therefore, for the
right side of the peak Eq. (1) is not valid, sinceRmeasured45/44 is the sum ofiCO45
2 andi
45 Kr-excess
divided byimeasured44 ,
Rmeasured45/44 =R(CO45/442+Kr)=(iCO45
2+i
45
Kr-excess)/i 44
measured (2)
20
The next step relies on the observation gleaned from the AWI data that all three ion
current ratios of pure CH4-derived CO2peaks are essentially flat. In contrast, the ratios
of the affected sample peaks show large Kr bumps after the flat plateaus due to Kr
AMTD
6, 1409–1460, 2013Kr interference during carbon isotope analysis
J. Schmitt et al.
Title Page
Abstract Introduction
Conclusions References
Tables Figures
◭ ◮
◭ ◮
Back Close
Full Screen / Esc
Printer-friendly Version Interactive Discussion
Discussion
P
a
per
|
Dis
cussion
P
a
per
|
Discussion
P
a
per
|
Discussio
n
P
a
per
|
on the ion current ratio, the absolute anomaly of these Kr bumps,∆R45/44, is defined
as follows,
∆R45/44=R(CO45/442+Kr)−R(pure CO45/44
2) (3)
In practice, ∆R45/44 is calculated by subtracting the “background ratio” defined
asi45CO2/imeasured44 , from the ratio of the affected right peak side with the contaminated
5
ratio,R(CO45/442+Kr) The peak section from which the “background ratio” is calculated is in-dicated by boxes in Fig. 11a. At this step we make the assumption that without any Kr interference the ratio in the background box would continue all the way to the right side
to the right integration boundary (8 to 10 s after CH4 peak maximum). This
assump-tion is reasonable at this step for defining the “background ratio” since pure CH4peaks
10
show an almost flat ratio over the whole CH4peak (see Figs. 2d–f and 11a).
Equation (3) can be transformed into Eq. (4), to Eq. (5) and finally into Eq. (6) where the ion current of the excess Kr,iKr-excess45 , is isolated.
∆R45/44=(iCO45
2+i
45
Kr-excess)/i 44
measured−i 45 CO2/i
44
measured (4)
15
∆R45/44=iKr-excess45 /imeasured44 (5)
iKr-excess45 = ∆R45/44.imeasured44 (6)
TheiKr-excess45 time series resembles a Gaussian peak shape with its maximum at the retention time of the Kr peak (Fig. 11b, blue dots), which indicates that the method
20