BGD
11, 4563–4589, 2014Nitrate sources and dynamics in the salinized rivers and
estuaries
D. Xue et al.
Title Page
Abstract Introduction
Conclusions References
Tables Figures
◭ ◮
◭ ◮
Back Close
Full Screen / Esc
Printer-friendly Version Interactive Discussion
Discussion
P
a
per
|
D
iscussion
P
a
per
|
Discussion
P
a
per
|
Discuss
ion
P
a
per
|
Biogeosciences Discuss., 11, 4563–4589, 2014 www.biogeosciences-discuss.net/11/4563/2014/ doi:10.5194/bgd-11-4563-2014
© Author(s) 2014. CC Attribution 3.0 License.
Open Access
Biogeosciences
Discussions
This discussion paper is/has been under review for the journal Biogeosciences (BG). Please refer to the corresponding final paper in BG if available.
Nitrate sources and dynamics in the
salinized rivers and estuaries – a
δ
15
N-and
δ
18
O-NO
−
3
isotope approach
D. Xue1, P. Boeckx3, and Z. Wang1,2
1
Tianjin Key Laboratory of Water Resources and Environment, Tianjin Normal University, Tianjin 300387, China
2
State Key Laboratory of Environmental Geochemistry, Institute of Geochemistry, Chinese Academy of Sciences, Guiyang 550002, China
3
Isotope Bioscience Laboratory – ISOFYS, Faculty of Bioscience Engineering, Ghent University, Coupure links 653, 9000 Ghent, Belgium
Received: 9 February 2014 – Accepted: 11 March 2014 – Published: 24 March 2014
Correspondence to: Z. Wang ([email protected])
BGD
11, 4563–4589, 2014Nitrate sources and dynamics in the salinized rivers and
estuaries
D. Xue et al.
Title Page
Abstract Introduction
Conclusions References
Tables Figures
◭ ◮
◭ ◮
Back Close
Full Screen / Esc
Printer-friendly Version Interactive Discussion
Discussion
P
a
per
|
D
iscussion
P
a
per
|
Discussion
P
a
per
|
Discuss
ion
P
a
per
|
Abstract
To trace NO−3 sources and assess NO−3 dynamics in the salinized rivers and estuaries, three rivers (HH River, CB River and JY River) and two estuaries (HH Estuary and CJ Estuary) along the Bohai Bay (China) have been selected to determine DIN and
δ15N- andδ18O-NO−3. Upstream of the HH River NO−3 was removed 30.9±22.1 % by
5
aerobic denitrification, resulting from effects of the floodgate: limiting water exchange with downstream and prolonging water residence time to remove NO−
3. Downstream of
the HH River NO−3 was removed 2.5±13.3 % by NO−3 turnover processes. Conversely,
NO−3 was increased 36.6±25.2 % by external N source addition in the CB River and
34.6±35.1 % by in-stream nitrification in the JY River, respectively. The HH and CY
10
Estuaries behaved mostly conservative excluding the sewage input in the CJ Estuary. Hydrodynamics in estuaries have been changed by the ongoing reclamation projects, aggravating the estuaries losing the attenuation function of NO−
3.
1 Introduction
Increasing population, extensive agricultural activities and rapid development of
urban-15
ization in coastal areas have dramatically increased N loading to rivers and coastal waters (Seitzinger and Kroeze, 1998; Jennerjahn et al., 2004; Umezawa et al., 2008). Estuaries play a prominent role for delivery of terrestrially derived N to coastal wa-ter through physical, chemical, and biological processes (Mulholland, 1992; Bernhardt et al., 2003; Sebilo et al., 2006; Hartzell and Jordan, 2012).
20
Many estuarine studies have focused on tracing N sources and assessing N dynam-ics in large estuarine systems, such as the Elbe Estuary (Dähnke et al., 2008) and the Atlantic coast (Middelburg and Herman, 2007) in Europe, the San Francisco Bay Estuary (Wankel et al., 2006), the Mississippi River Estuary (Rabalais et al.,1996), and the Mid-Atlantic coast (Dafner et al., 2007) in the United States, and the Yangtze River
25
Sel-BGD
11, 4563–4589, 2014Nitrate sources and dynamics in the salinized rivers and
estuaries
D. Xue et al.
Title Page
Abstract Introduction
Conclusions References
Tables Figures
◭ ◮
◭ ◮
Back Close
Full Screen / Esc
Printer-friendly Version Interactive Discussion
Discussion
P
a
per
|
D
iscussion
P
a
per
|
Discussion
P
a
per
|
Discuss
ion
P
a
per
|
dom researchers carried out research in small estuarine systems (Caffrey et al., 2007; Teixeira et al., 2010; Kaiser et al., 2013). Even more, less is known about small estuar-ine systems with salinization from sea-water intrusion upstream the estuarestuar-ine channel (Graas and Savenije, 2008). How do these salinized estuaries respond to increased N loadings? How do physico-chemical and biological processes control DIN (NH+4, NO−2
5
and NO−3) concentration variations?
To answer these questions, an intensive study was conducted in three rivers and the corresponding estuaries characterized by different levels of salinization in a coastal municipality (Tianjin) along the Bohai Bay (China). Two investigated rivers with mean salinities around 0.5 and 0.7 flow through a rural area and are converged before
enter-10
ing into the estuary. The third one with mean salinity around 2.2 flows through Tianjin municipality and is separated into three parts by two floodgates cross the river, for providing water supply for the residents living along the river bank. Since the rapid urbanization and population growth in Tianjin municipality, NO−
3 loading progressively
increased in rivers and estuaries associated with human activities, such as agricultural
15
runoff, untreated domestic and industrial wastewater (Gao et al., 2011). Furthermore, port constructions and reclamation projects along the coastline of the municipality even aggravate NO−3 pollution (Zhang et al., 2004). Thus, tracing NO−3 sources and assess-ing NO−3 dynamics in the salinized rivers and estuaries represent fundamental goals in this study.
20
More than concentration data alone, the combined use of N (δ15N) and O (δ18O) isotopes of NO−3 has provided a powerful tool to investigate NO−3 dynamics and identify NO−3 sources in estuaries (Middelburg and Nieuwenhuize, 2001; Sebilo et al., 2006; Wankel et al., 2006; Dähnke et al., 2008; Miyajima et al., 2009). Therefore, in the present study, a combined approach based on the mixing curves of DIN concentration
25
BGD
11, 4563–4589, 2014Nitrate sources and dynamics in the salinized rivers and
estuaries
D. Xue et al.
Title Page
Abstract Introduction
Conclusions References
Tables Figures
◭ ◮
◭ ◮
Back Close
Full Screen / Esc
Printer-friendly Version Interactive Discussion
Discussion
P
a
per
|
D
iscussion
P
a
per
|
Discussion
P
a
per
|
Discuss
ion
P
a
per
|
2 Material and method
2.1 Study area
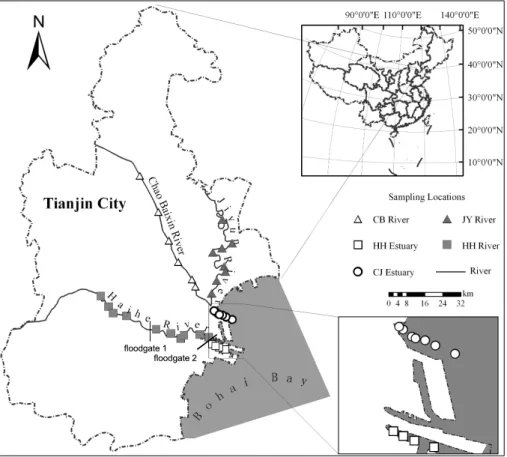
The investigated three rivers are located in a coastal municipality, Tianjin, China (Fig. 1). The survey took place in three rivers along a salinity gradient, the Haihe River (HH River) on 7 November 2012, the Chaobaixin River (CB River) on 9 November 2012
5
and the Jiyun River (JY River) on 10 November 2012 (Fig. 1). Water samples were also taken along the estuary of the HH River (HH Estuary) and the mixing estuary of the CB River and the JY River (CJ Estuary) on 16 November 2012 to study reactive N transfor-mation processes from the river to the estuary (Fig. 1). The river-path length from the upstream sampling location to the river mouth sampling location of the HH River was
10
72 km with a watershed area of 2066 km2 (Liu et al., 2001). Since the separation by the floodgate, the upstream part of the HH River serves as a river-type reservoir for the purpose of supplying water to the residents living along the river bank. The other flood-gate is located at the end of the HH River serves as flood discharging, tidal blocking and ship traffic. The CB River flows through the rural area with a total length of 81 km
15
and the watershed area is about 1387 km2(Gburek et al., 1998). Animal manure could be a potential dominant NO−3 source in the CB River as this watershed has important livestock breeding base for the municipality (Shao et al., 2010). The JY River flows through agricultural area and is considered as a significant water source for agricul-tural and domestic use. The total length of the Jiyun River is 144 km with a watershed
20
area of about 2146 km2(Chen et al., 2000).
2.2 Sampling and analysis
Water samples were taken on transects spanning the freshwater portion of the rivers to coastal water of the Bohai Bay. Water samples were stored frozen in 1 L HDPE (High Density Polyethylene) bottles for determination of physico-chemical properties
25
BGD
11, 4563–4589, 2014Nitrate sources and dynamics in the salinized rivers and
estuaries
D. Xue et al.
Title Page
Abstract Introduction
Conclusions References
Tables Figures
◭ ◮
◭ ◮
Back Close
Full Screen / Esc
Printer-friendly Version Interactive Discussion
Discussion
P
a
per
|
D
iscussion
P
a
per
|
Discussion
P
a
per
|
Discuss
ion
P
a
per
|
were measured by a portable water quality probe (Thermo Orion, USA). Laboratory analyses included NO−3, NO−2 and NH+4. All samples were filtered through 0.45 µm membrane filters and stored at 4◦C until analysis. Nitrate (NO−3), NO−2 and NH+4 con-centrations were analyzed on a continuous flow analyzer (Auto Analyzer 3, Seal, Ger-many).
5
The δ15N- andδ18O-NO−3 values were determined by the “Bacterial denitrification method” (Sigman et al., 2001; Casciotti et al., 2002; Xue et al., 2010) in the UC Davis Stable Isotope Facility of California University, which allows for the simultaneous deter-mination ofδ15N andδ18O of N2O produced from the conversion of NO−3 by denitrifying
bacteria, which naturally lack N2O – reductase activity. Isotope ratios ofδ 15
N andδ18O
10
are measured using a Thermo Finnigan GasBench+PreCon trace gas concentration system interfaced to a Thermo Scientific Delta V Plus isotope-ratio mass spectrometer (Bremen, Germany). The N2O sample is purged from vials through a double-needle
sampler into a helium carrier stream (25 mL min−1) and CO
2is removed using
scrub-ber (Ascarite). By cryogenic trapping and focusing, the N2O is compressed onto an
15
Agilent GS-Q capillary column (30 m×0.32 mm, 40◦C, 1.0 mL min−1) and subsequently
analyzed by IRMS.
Stable isotope data were expressed in delta (δ) units in per mil (‰) relative to the respective international standards:
δsample(‰)=
Rsample
Rstandard
−1
!
×1000 (1)
20
whereRsample andRstandard are the 15
N/14N or 18O/16O ratio of the sample and stan-dard for δ15N and δ18O, respectively. Values of δ15N are reported relative to atmo-spheric air (AIR) and δ18O values are reported relative to Vienna Standard Mean Ocean Water 2 (VSMOW 2). The calibration standards are the nitrates USGS 32, USGS 34, and USGS 35, and are supplied by NIST (National Institute of Standards
25
BGD
11, 4563–4589, 2014Nitrate sources and dynamics in the salinized rivers and
estuaries
D. Xue et al.
Title Page
Abstract Introduction
Conclusions References
Tables Figures
◭ ◮
◭ ◮
Back Close
Full Screen / Esc
Printer-friendly Version Interactive Discussion
Discussion
P
a
per
|
D
iscussion
P
a
per
|
Discussion
P
a
per
|
Discuss
ion
P
a
per
|
2.3 Mixing model
Normally, a mixture (MIX) can be calculated via a basic mixing model (Liss, 1976):
CMIX=f×CR+(1−f)CM (2)
whereCrepresents concentration, the subscripts R and M represent riverine and ma-rine end-members, respectively;f represents the fraction of freshwater in each sample
5
calculated from salinity (Dähnke et al., 2006):
f =(salinityMAX−salinityMEA)/salinityMAX (3)
where MAX is taken as the maximum measured salinity of marine end-member for coastal water and MEA is taken as the measured salinity of the mixture.
Isotopic values of mixed estuarine samples (δMIX) were calculated using
10
concentration-weighted isotopic values for riverine and marine end-members, respec-tively (Fry, 2002; Dähnke, 2006):
δMIX=[f×CR×δR+(1−f)CM×δM]/CMIX (4)
whereCrepresents concentration,δrepresents isotopic value, the subscripts R and M represent riverine and marine end-members, respectively; andf represents the
frac-15
tion of freshwater in each sample. The salinity-based isotopic mixing does not follow linear conservative mixing but show curvilinear mixing that reflects concentration-based weighting of end-member isotopic contributions.
Based on the mixing curves of DIN concentration against salinity, additional sources or cycling can be identified. When an enriched external source or biological
transfor-20
BGD
11, 4563–4589, 2014Nitrate sources and dynamics in the salinized rivers and
estuaries
D. Xue et al.
Title Page
Abstract Introduction
Conclusions References
Tables Figures
◭ ◮
◭ ◮
Back Close
Full Screen / Esc
Printer-friendly Version Interactive Discussion
Discussion
P
a
per
|
D
iscussion
P
a
per
|
Discussion
P
a
per
|
Discuss
ion
P
a
per
|
3 Results
3.1 Physicochemical properties
Table 1 summarizes the data of physicochemical properties collected in this study in the rivers and estuaries. Obviously, the salinities of the HH River (ranging from 0.7 to 4.9 with a mean value of 2.2) and its estuary (ranging from 18.6 to 24.1 with a mean
5
value of 21.2) is higher than the rivers of CB (ranging from 0.5 to 0.6 with a mean value of 0.5) and JY (ranging from 0.6 to 0.8 with a mean value of 0.7) and the corresponding estuary (ranging from 2.0 to 20.0 with a mean value of 7.7), respectively. The munic-ipality had been suffering multiple seawater intrusion and regression, which results in the salinization of the rivers and soil (Wang, 2004), while the greater salinization level
10
of the HH River is also related to seawater intrusion over the floodgate until upstream of the HH River in a relatively long distance. The rivers and the estuaries showed sim-ilar pH values between 7.5 and 8.6. The temperature of the HH River varied around 12.3◦C slightly higher than the CB River (mean is 10.9◦C) and the JY River (11.5◦C). The mean temperature of the HH Estuary (9.7) is also higher than that of the CJ
Estu-15
ary (6.7). Dissolved oxygen (DO) concentrations were relatively enriched in this study (higher than 7.2 mg L−1), excluding the DO depleted area in the upstream of the HH River (lower than 5.0 mg L−1).
3.2 DIN species
Wide concentration variations were noticeable for DIN (NH+4, NO−2 and NO−3) species in
20
Table 1. In the HH River, the NH+4 concentrations varied from 124.1 to 332.6 µmol L−1, the NO−3 concentrations varied from 62.5 to 219.0 µmol L−1 and the NO−2 concen-trations varied from 7.2 to 20.8 µmol L−1. The DIN concentrations of the HH
Estu-ary varied smoothly (5.6–6.7 µmol L−1for NO−2, 7.1–25.7 µmol L−1 for NO−3, and 65.7– 88.1 µmol L−1for NH+4) and were quite low compared to the HH River. Nitrate
BGD
11, 4563–4589, 2014Nitrate sources and dynamics in the salinized rivers and
estuaries
D. Xue et al.
Title Page
Abstract Introduction
Conclusions References
Tables Figures
◭ ◮
◭ ◮
Back Close
Full Screen / Esc
Printer-friendly Version Interactive Discussion
Discussion
P
a
per
|
D
iscussion
P
a
per
|
Discussion
P
a
per
|
Discuss
ion
P
a
per
|
tions in the CB river were relatively elevated (120.0–171.5 µmol L−1) with a continuous accumulation along the entire salinity gradient, while NO−2 concentrations decreased from 12.0 to 6.0 µmol L−1. Ammonium concentrations in the CB River varied from 143.9 to 380.0 µmol L−1
. The JY River also showed NO−
3 accumulation (increased from 40.0
to 83.3 µmol L−1) along the entire salinity gradient, while a decreasing trend was
ob-5
served for both NO−2 (decreased from 7.0 to 2.1 µmol L−1) and NH+4 (decreased from 72.8 to 11.1 µmol L−1) concentrations. The CJ Estuary displayed a sea-ward decreas-ing trend with relatively elevated concentrations in NH+4 (328.4–43.2 µmol L−1), NO−
2
(7.8–3.4 µmol L−1) and NO−
3 (153.4–6.1 µmol L
−1). Compared to the other river and
es-tuaries, DIN results of this study are similar to that in the Pearl River Estuary (Dai et al.,
10
2008) in South China Sea, but higher than that in the Elbe Estuary (Dähnke et al., 2008) in Europe and the San Francisco Bay Estuary (Wankel et al., 2006) in the United States. The specific reasons to cause such variations could be potentially linking to in-ternal/external NO−3 source contributions and different NO−3 dynamics in the rivers and the estuaries.
15
3.3 Isotopic composition of NO−
3
The isotopic composition of NO−
3 varied spatially among the rivers and the estuaries
(Table 1). The δ15N-NO−3 values in the HH River varied from −0.7 to 8.4 ‰ and the
δ18O-NO−3 values varied from−1.7 to 1.5 ‰. The isotopic composition of NO−3 in the
HH Estuary remained stable around 8.1 ‰ forδ15N-NO−3 and 5.6 ‰ for theδ18O-NO−3.
20
In the CB River, theδ15N-NO−
3 values were enriched with a mean of 13.6 ‰, and the δ18O-NO−
3 values were in a range between 3.9 and 5.6 ‰. A decrease in δ 15
N-NO−
3
(from 6.5 to 4.4 ‰) and an increase inδ18O-NO−3 (from 0.9 to 5.3 ‰) values along the salinity were observed in the JY River. The CY Estuary demonstrated a wide range of
δ15N-NO−
3 (from 7.1 to 15.0 ‰), while a narrow range ofδ 18
O-NO−
3 (from 5.9 to 6.9 ‰).
BGD
11, 4563–4589, 2014Nitrate sources and dynamics in the salinized rivers and
estuaries
D. Xue et al.
Title Page
Abstract Introduction
Conclusions References
Tables Figures
◭ ◮
◭ ◮
Back Close
Full Screen / Esc
Printer-friendly Version Interactive Discussion
Discussion
P
a
per
|
D
iscussion
P
a
per
|
Discussion
P
a
per
|
Discuss
ion
P
a
per
|
4 Discussion
4.1 Potential dominant NO−
3 sources
To derive qualitative information on the predominant NO−3 sources in the rivers and the corresponding estuaries, a classical dual isotope approach (δ15N-NO−
3 vs.δ
18
O-NO−
3)
has been applied (Fig. 2). It is clear that the isotope signatures of all the sampling
loca-5
tions showed in a scattered distribution, indicating different NO−3 source contamination in the rivers and the estuaries. Upstream of the HH River at a salinity of 1.0, a floodgate separates the river into two parts; and at the end of the river at the salinity of 4.9, the other floodgate controls the connection of the river to the HH Estuary. Hence, theδ15 N-andδ18O-NO−3 values of the HH River behaved quite differently, which moved from the
10
overlapping area of the “NH+4 fertilzier” and “soil N” source boxes for the majority of the upstream sampling locations, to the overlapping area of the “soil N” and “manure and sewage” source boxes at the end of the river. In this study, the majority of the sam-pling locations were potentially influenced by the source of “soil N” or “sewage” not the “mineral fertilizer”, as the HH River flows through the municipality without agricultural
15
activities. In addition, it can no be excluded the influence from salt water intrusion from the estuary, which showed similar isotopic values to that at the end of the HH River. The distribution of the HH Estuary does not show a landward trend due to the floodgate at the end of the HH River, but falls into the range of marine NO−3 reported by Kendall et al. (2007).
20
Animal manure could be a potential dominant NO−
3 source in the CB River as this
wa-tershed plays the role of important livestock breeding base for the municipality (Shao et al., 2010). Furthermore, the δ15N-NO−3 values were enriched and varied around 14 ‰, indicating anthropogenic NO−
3 derived from manure (Kendall et al., 2007; Xue
et al., 2009). The isotope signatures of the JY River were mainly concentrated in the
25
ap-BGD
11, 4563–4589, 2014Nitrate sources and dynamics in the salinized rivers and
estuaries
D. Xue et al.
Title Page
Abstract Introduction
Conclusions References
Tables Figures
◭ ◮
◭ ◮
Back Close
Full Screen / Esc
Printer-friendly Version Interactive Discussion
Discussion
P
a
per
|
D
iscussion
P
a
per
|
Discussion
P
a
per
|
Discuss
ion
P
a
per
|
peared in this estuary, due to sewage discharge of mooring ships in the vicinity of the sampling area. Thus, the influence of sewage and the CB River was considered as the dominant NO−3 source.
4.2 Nitrate dynamics in the salinized rivers and the corresponding estuaries
4.2.1 Nitrate dynamics in the HH River and its estuary
5
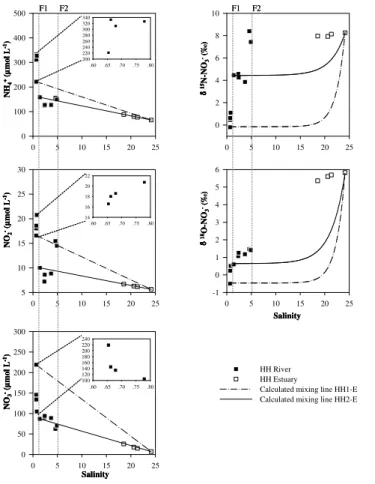
A mixing line (HH1-E) was setup between the initial sampling location in the HH River and the last sampling location in the HH Estuary (Fig. 3). After the separation of the floodgate, the upstream of the HH River serves as a river-type reservoir. Thus, a new mixing line (HH2-E mixing line) was re-calculated between the sampling location after the floodgate and estuarine water (Fig. 3). The salinity gradient sampled in the HH
10
River and its estuary showed a seaward decreasing trend in DIN (NH+4, NO−2 and NO−3) concentrations and an increasing trend inδ15N-NO−3 andδ18O-NO−3 values throughout the entire salinity gradient (Fig. 3). However, the DIN and isotopic trends did not behave conservatively, as most of the measured data deviated from the calculated mixing lines, especially from HH1-E between the riverine concentration and the coastal water.
15
It is clear that in the upstream part of the HH River before the floodgate 1, NO−2 and NH+4 were above (a source) while NO−3 was below (a sink) the HH1-E mixing line. Hence, NO−3 removal processes are expected to occur in the river. Denitrifica-tion has been considered as a dominant NO−3 reduction pathway, which reduces NO−3 to gaseous N compounds (NO, N2O and N2) under anaerobic conditions. However,
20
a large number of laboratory studies have reported that denitrification occurs under aerobic conditions in pure cultures of bacteria (Robertson and Kuenen, 1984; Ron-ner and Sorensson, 1985; Trevors and Starodub, 1987; Robertson et al., 1995). Vari-ous heterotrophic nitrifiers have been tested and found to be capable of simultaneVari-ous heterotrophic nitrification and aerobic denitrification (Castignetti and Hollocher, 1984;
25
BGD
11, 4563–4589, 2014Nitrate sources and dynamics in the salinized rivers and
estuaries
D. Xue et al.
Title Page
Abstract Introduction
Conclusions References
Tables Figures
◭ ◮
◭ ◮
Back Close
Full Screen / Esc
Printer-friendly Version Interactive Discussion
Discussion
P
a
per
|
D
iscussion
P
a
per
|
Discussion
P
a
per
|
Discuss
ion
P
a
per
|
denitrification in nature, e.g. in Mississippi River Basin (Thomas et al., 2006) and in the central German Wadden Sea (Gao et al., 2010). Thus, the aerobic denitrification was expected under the relatively enriched DO (2.7–5.0 mg L−1) condition in this study. In addition, assimilation process can be ignored due to a non-rapid consumption of NH+4 which is generally the preferred form of N (when NH+4 was elevated compared to NO−3)
5
for phytoplankton uptake (Dugdale and MacIsaac, 1971; Dugdale and Hopkins, 1978; Dugdale et al., 2006). The NH+4 species was accumulated as a source, potentially orig-inating from organic matter decomposition not sewage discharge, as the δ15N-NO−3 values (−0.7–1.1 ‰) were out of the sewage range. Aerobic denitrification could also
be the potential process for NO−2 accumulation in the upstream part of the HH River
10
and the nitrification was potentially inhibited when NH+4 concentrations were higher than 200 µmol L−1(Magalhães et al., 2005).
For the HH2-E mixing line after the floodgate 1 (Fig. 3), salinity gradient sampled in the downstream of the HH River illustrated NO−
3 turned from a source (above the
HH2-E mixing line) to a sink (below the HH2-E mixing line), while NO−2 and NH+4 turned
15
from a sink (below the HH2-E mixing line) to a source (above the HH2-E mixing line) at the end of the river. Nitrate accumulation may be linked to an in-stream nitrification process, in which NO−2 and NH+4 were consumed to produce NO−3. In nitrification, the conversion of NH+4 to NO−2 and NO−3 is accompanied by marked N isotope fractionation effects, resulting in15N depleted NO−
3 (Delwiche and Steyn, 1970; Mariotti et al., 1981;
20
Macko and Ostrom, 1994). For δ18O-NO−3 values, NO−3 produced by nitrification in aquatic environments usually takes similarδ18O values to the ambient water (Casciotti et al., 2002; Sigman et al., 2005). There is evidence that O can exchange between H2O and intermediate compounds of nitrification (Andersson et al., 1982; DiSpirito and Hooper, 1986; Kool et al., 2007). Since the δ18O of estuarine water is expected to
25
be higher than that of river water (Miyajima et al., 2009),δ18O-NO−3 should increase along the salinity gradient when in situ nitrification is occurring. Thus, a decrease in
BGD
11, 4563–4589, 2014Nitrate sources and dynamics in the salinized rivers and
estuaries
D. Xue et al.
Title Page
Abstract Introduction
Conclusions References
Tables Figures
◭ ◮
◭ ◮
Back Close
Full Screen / Esc
Printer-friendly Version Interactive Discussion
Discussion
P
a
per
|
D
iscussion
P
a
per
|
Discussion
P
a
per
|
Discuss
ion
P
a
per
|
the HH River and confirmed the in-stream nitrification process as a NO−3 source. The NH+4 concentrations increased at the end of the HH River (a maximum turbidity zone), probably from the release of particle-bound NH+4 (Seitzinger et al., 1991; Schlarbaum et al., 2010). This could explain the sharp increase of theδ15N-NO−3 from 3.9 to 8.4 ‰ while the δ18O-NO−3 only increased slightly from 1.2 to 1.5 ‰, resulting from taking
5
similarδ18O values to the ambient water. When salinity achieves 5, nitrifying bacterial was potentially inhibited and reduced the conversion rate from NO−
2 to NO
−
3 (Pollice
et al., 2002). Hence, the NO−2 was accumulated and NO−3 was declined in this zone. The DIN concentrations and δ15N- and δ18O-NO−3 in the coastal water behaved conservatively of a mixing. Since the separation of the floodgate 2 at the end of the
10
HH River, the salinity demonstrated a sudden increase from 4.9 (before the floodgate) to 18.6 (after the floodgate) in 1 km, potentially indicate that the HH River discharge was limited due to the floodgate. As theδ15N-NO−3 value of the last sampling location in the HH River was close to that of the estuarine water, hence δ15N-NO−
3 values
remained stable at∼8.0 ‰. Theδ18O-NO−3 values increase sea-ward because of the
15
high percentage of coastal water.
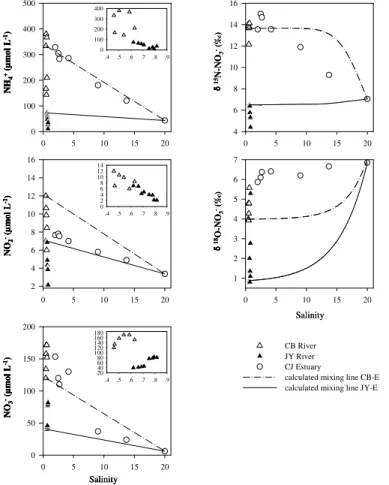
4.3 Nitrate dynamics in the CB River and JY River and their estuary
Compared to the HH River, the salinity of the CB and JY rivers varied in a relatively small range, from 0.5 to 0.6 for the CB River and from 0.6 to 0.8 for the JY River. Mixing lines were calculated between the CB and JY rivers and the estuarine water,
20
respectively (Fig. 4). Both CB and JY rivers demonstrated a NO−
3 source along the
salinity gradient, indicating a NO−3 input from either in-stream nitrification or external loading.
Nitrate concentrations in the CB River were elevated with a continuous accumulation along the river. The CB River flows through a rural area with intensive livestock
pro-25
BGD
11, 4563–4589, 2014Nitrate sources and dynamics in the salinized rivers and
estuaries
D. Xue et al.
Title Page
Abstract Introduction
Conclusions References
Tables Figures
◭ ◮
◭ ◮
Back Close
Full Screen / Esc
Printer-friendly Version Interactive Discussion
Discussion
P
a
per
|
D
iscussion
P
a
per
|
Discussion
P
a
per
|
Discuss
ion
P
a
per
|
Furthermore, a regular source-sink pattern was observed for NH+4 concentrations while a decrease for NO−2. The sharp increase in NH+4 concentrations was probably linked to manure discharge in the rural area. The added NH+4 was then rapidly oxidized to NO−2 and NO−3 during nitrification. Hence,δ15N-NO−3 values were enriched and varied around 13.6 ‰, indicating NO−3 derived from manure (Kendall et al., 2007; Xue et al.,
5
2009). As NO−3 from these origins is produced via nitrification, itsδ18O values would not be very different from ambient water. Thus, the gradual increase in δ18O-NO−
3 values
along the salinity gradient above the respected mixing line confirmed the in situ nitrifi-cation (see the discussion above). Thus, in the CB River, the NO−3 turnover is mainly regulated by nitrification from external livestock N loadings.
10
The JY River became a significant source for NO−3 in concert with a sink for NO−2 and NH+4 species. The accumulation of NO−3 was linked to the in-stream nitrification, resulting from the consumption of NO−
2 and NH+4. Evidence for this may be indicated
by decreasingδ15N- NO−
3 and increasingδ 18
O-NO−
3 values along the river.
The salinity gradient sampled in the corresponding estuary showed a sea-ward
de-15
creasing trend in NH+4, NO−2 and NO−3 concentrations. The measured data in the CJ Estuary were expected to fall between the two calculated mixing lines generated from the rivers of CB and JY, because they both discharge into the same estuary. A ma-jor DIN source (above the two calculated mixing lines) appeared in the salinity zone between 2.0 and 4.2. This was probably from sewage discharge of mooring ships in
20
the vicinity of the sampling area. The typically highδ15N-NO−3 (13.6 to 15.0 ‰) values confirmed NO−3 derivation from sewage. This point-source contamination was diluted by the estuarine water when salinity higher than 4.2, where the DIN concentrations and
δ15N-NO−3 values fall between the two mixing lines. Theδ18O-NO−3 values of the estu-arine water were quite close to theδ18O-NO−3 derived from the nitrification of sewage,
25
BGD
11, 4563–4589, 2014Nitrate sources and dynamics in the salinized rivers and
estuaries
D. Xue et al.
Title Page
Abstract Introduction
Conclusions References
Tables Figures
◭ ◮
◭ ◮
Back Close
Full Screen / Esc
Printer-friendly Version Interactive Discussion
Discussion
P
a
per
|
D
iscussion
P
a
per
|
Discussion
P
a
per
|
Discuss
ion
P
a
per
|
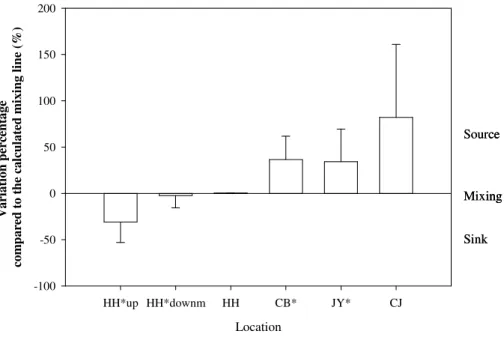
4.4 Nitrate removal efficiency in the rivers and the estuaries
In this study, most of the measured data deviated from the calculated mixing lines, indi-cating rivers and estuaries becoming either a source or a sink. Thus, variation percent-ages of the measured data compared to the calculated mixing lines were computed to assess the NO−3 removal efficiency for the rivers and estuaries (Fig. 5).
Interest-5
ingly, in the upstream part of the HH River before the floodgate 1, NO−3 was removed 30.9±22.1 % compared to the calculated mixing line. Denitrification could be the
domi-nant NO−3 removal process. This potentially results from the separation of the floodgate which limited water exchange with downstream water enriched in DO. Furthermore, the floodgate 1 might prolong water residence time in the upstream part to remove a
signif-10
icant part of riverine N loadings. The downstream part of the HH River between flood-gate 1 and floodflood-gate 2 showed an extremely weak NO−3 removal tendency (remove 2.5±13.3 % of NO−3) from active NO−3 turnover processes and the HH Estuary
demon-strated a conservative behavior with respect to NO−3. In contrast, a significant source of NO−3 is present in the CB (36.6±25.2 %) and JY (34.6±35.1 %) rivers compared to
15
the calculated mixing line, explained by external N source addition and in-stream nitrifi-cation, respectively. Moreover, the CJ Estuary demonstrated higher NO−3 accumulation efficiency (82.1±78.8 %) as a result of an external N source input. Great variation
per-centages were observed between the sampling points from the same river or estuary, possibly resulting from different N dynamics and/or external source input.
20
Estuaries of rivers are considered as active sites of massive NO−3 losses (Brion et al., 2004; Seitzinger et al., 2006), removing up to 50 % of NO−
3 (OsparCom, 2000).
How-ever, our data do not support this view as in the HH and the CJ estuaries. First, DO concentrations were higher than 10 mg L−1not favorable for water column NO−3 removal processes. Second, dredging and diking work to deepen the ship channel decreased
25
BGD
11, 4563–4589, 2014Nitrate sources and dynamics in the salinized rivers and
estuaries
D. Xue et al.
Title Page
Abstract Introduction
Conclusions References
Tables Figures
◭ ◮
◭ ◮
Back Close
Full Screen / Esc
Printer-friendly Version Interactive Discussion
Discussion
P
a
per
|
D
iscussion
P
a
per
|
Discussion
P
a
per
|
Discuss
ion
P
a
per
|
the estuaries by NO−3 removing processes as reclamation projects for the regional and national economy leading to the hydrodynamics of circulation in Tianjin section dis-appearance (Qin et al., 2012). This phenomenon could reduce water residence time and force NO−3 pollutants moving to the northern part of Bohai Bay, aggravating NO−3 contamination.
5
Furthermore, this wintertime situation, with water temperature around 10◦C, ruled out most biological activity, and conservative mixing behavior in the HH River Estuary was not overly surprising. However, the CJ Estuary became a NO−3 source, linking to sewage discharge of mooring ships.
5 Conclusions
10
The combined use of salinity, DIN concentrations and NO−3 isotopic composition re-vealed NO−3 sources and dynamics in the salinized rivers of HH, CB and JY and elu-cidated mixing patterns of NO−3 in the corresponding estuarine system. The HH River demonstrated a significant NO−
3 sink appeared in the upstream part of the HH River
by aerobic denitrification process. This potentially results from the separation of the
15
floodgate 1 which limited water exchange with downstream water enriched in DO and prolong water residence time in the upstream to remove a significant part of riverine N loadings. The downstream of the HH River showed an extremely weak NO−3 removal tendency from active NO−3 turnover processes. In contrast, a significant source of NO−3 is present in the rivers of CB and JY, linking to external N source addition and in-stream
20
BGD
11, 4563–4589, 2014Nitrate sources and dynamics in the salinized rivers and
estuaries
D. Xue et al.
Title Page
Abstract Introduction
Conclusions References
Tables Figures
◭ ◮
◭ ◮
Back Close
Full Screen / Esc
Printer-friendly Version Interactive Discussion
Discussion
P
a
per
|
D
iscussion
P
a
per
|
Discussion
P
a
per
|
Discuss
ion
P
a
per
|
Acknowledgements. We gratefully acknowledge Xi Yang and Qing Chen for water sample
preparation and the UC Davis Stable Isotope Facility of California University for isotope analy-ses. This study was financially supported by the National Science and Technology Pillar Pro-gram of China (2012BAC07B02), the National Natural Science Foundation of China (41203001; 41173096) and NCET Program (NCET-10-0954).
5
References
Andersson, K. K., Philson, S. B., and Hooper, A. B.:18O isotope shift in 15N NMR analysis
of biological N-oxidations: H2O-NO2-exchange in the ammonia-oxidizing bacterium
Nitro-somonas, P. Natl. Acad. Sci. USA, 79, 5871–5875, 1982.
Bernhardt, E. S., Likens, G. E., Buso, D. C., and Driscoll, C. T.: Instream uptake dampens
10
effects of major forest disturbance on watershed nitrogen export, P. Natl. Acad. Sci. USA,
100, 10304–10308, 2003.
Brion, N., Baeyens, W., De Galan, S., Elskens, M., and Laane, R.: The North Sea: source or sink for nitrogen and phosphorus to the Atlantic Ocean?, Biogeochemistry, 68, 277–296, 2004.
15
Caffrey, J. M., Chapin, T. P., Jannasch, H. W., and Haskins, J. C.: High nutrient pulses, tidal
mix-ing and biological response in a small California estuary: variability in nutrient concentrations from decadal to hourly time scales, Estuar. Coast. Shelf S., 71, 368–380, 2007.
Casciotti, K. L., Sigman, D. M., Galanter Hastings, M., Böhlke, J. K., and Hilkert, A. A.: Mea-surement of the oxygen isotopic composition of nitrate in seawater and freshwater using the
20
denitrifier method, Anal. Chem., 74, 4905–4912, 2002.
Castignetti, D. and Hollocher, T. C.: Heterotrophic nitrification among denitrifiers, Appl. Eviron. Microb., 47, 620–623, 1984.
Chai, C., Yu, Z. M., Shen, Z. L., Song, X., Cao, X., and Yao, Y.: Nutrient characteristics in the Yangtze River estuary and the adjacent east china sea before and after impoundment of the
25
Three Gorges Dam, Sci. Total Environ., 407, 4687–4695, 2009.
BGD
11, 4563–4589, 2014Nitrate sources and dynamics in the salinized rivers and
estuaries
D. Xue et al.
Title Page
Abstract Introduction
Conclusions References
Tables Figures
◭ ◮
◭ ◮
Back Close
Full Screen / Esc
Printer-friendly Version Interactive Discussion
Discussion
P
a
per
|
D
iscussion
P
a
per
|
Discussion
P
a
per
|
Discuss
ion
P
a
per
|
Dafner, E. V., Mallin, M. A., Souza, J. J., Wells, H. A., and Parsons, D. C.: Nitrogen and phos-phorus species in the coastal and shelf waters of Southeastern North Carolina, Mid-Atlantic US coast, Mar. Chem., 103, 289–303, 2007.
Dähnke K., Bahlman, E., and Emeis, K.: A nitrate sink in estuaries? An assessment by means of stable nitrate isotopes in the Elbe estuary, Limnol. Oceanogr., 53, 1504–1511, 2008.
5
Dai, M., Wang, L., Guo, X., Zhai, W., Li, Q., He, B., and Kao, S.-J.: Nitrification and inorganic nitrogen distribution in a large perturbed river/estuarine system: the Pearl River Estuary, China, Biogeosciences, 5, 1227–1244, doi:10.5194/bg-5-1227-2008, 2008.
Delwiche, C. and Steyn, P.: Nitrogen isotope fractionation in soils and microbial reactions, Env-iron. Sci. Technol., 4, 929–935, 1970.
10
DiSpirito, A. A. and Hooper, A. B.: Oxygen exchange between nitrate molecules during nitrite oxidation by Nitrobacter, Biol. Chem., 261, 10534–10537, 1986.
Dugdale, R. C. and Hopkins, T. S.: Predicting the structure and dynamics of a pollution-driven marine ecosystem embedded in an oligotrophic sea, Thalassia Jugoslavica, 14, 107–126, 1978.
15
Dugdale, R. C. and MacIsaac, J. J.: A computational model for the uptake of nitrate in the Peru upwelling region, Invest. Pesq., 35, 299–308, 1971.
Dugdale, R. C., Wilkerson, F. P., Marchi, A., and Hogue, V.: Nutrient controls on new production in the Bodega Bay, California, coastal upwelling plume, Deep-Sea Res. Pt. II, 53, 3049–3062, 2006.
20
Fry, B.: Conservative mixing of stable isotopes across estuarine salinity gradients: a conceptual framework for monitoring watershed influences on downstream fisheries production, Estuar-ies, 25, 264–271, 2002.
Gao, H., Schreiber, F., Collins, G., Jensen, M. M., Kostka, J. E., Lavik, G., De Beer, D., Zhou, H., and Kuypers, M. M. M.: Aerobic denitrification in permeable Wadden Sea sediments, ISME
25
J., 4, 417–426, 2010.
Gao, X., Meng, H., and Yi, X.: Analysis of nitrogen pollution characteristics in water bodies of Tianjin, China Water & Wastewater, 27, 51–55, 2011 (in Chinese with English abstract). Gburek, W. J. and Sharpley, A. N.: Hydrology control on phosphorus loss from upland
agricul-tural watersheds, J. Environ. Qual., 270, 253–272, 1998.
30
Graas, S. and Savenije, H. H. G.: Salt intrusion in the Pungue estuary, Mozambique: effect of
BGD
11, 4563–4589, 2014Nitrate sources and dynamics in the salinized rivers and
estuaries
D. Xue et al.
Title Page
Abstract Introduction
Conclusions References
Tables Figures
◭ ◮
◭ ◮
Back Close
Full Screen / Esc
Printer-friendly Version Interactive Discussion
Discussion
P
a
per
|
D
iscussion
P
a
per
|
Discussion
P
a
per
|
Discuss
ion
P
a
per
|
Hartzell, J. L. and Jordan, T. E.: Shifts in the relative availability of phosphorus and nitrogen along estuarine salinity gradients, Biogeochemistry, 107, 489–500, 2012.
Jennerjahn, T. C., Ittekkot, V., Klöpper, S., Adi, S., Nugroho, S. P., Sudiana, N., Yusmal, A.,
Prihartanto, and Gaye-Haake. B.: Biogeochemistry of a tropical river affected by human
ac-tivities in its catchment: brantas river estuary and coastal waters of Madura Strait, Java,
5
Indonesia, Estuar. Coast. Shelf S., 60, 503–514, 2004.
Kaiser, D., Unger, D., Qiu, G., Zhou, H., and Gan, H.: Natural and human influences on nutrient transport through a small subtropical Chinese estuary, Sci. Total Environ., 450/451, 92–107, 2013.
Kendall, C., Elliott, E. M., and Wankel, S. D.: Tracing anthropogenic inputs of nitrogen to
ecosys-10
tems. in: Stable Isotopes in Ecology and Environmental Science, edited by: Michener, R. and Lajtha, K., Blackwell, Maiden, 375–449, 2007.
Kool, D. M., Wrage, N., Oenema, O., Dolfing, J., and Van Groenigen, J. W.: Oxygen exchange
between (de)nitrification intermediates and H2O and its implication for source determination
of NO−
3 and N2O: a review, Rapid Commun. Mass Sp., 21, 3659–3578, 2007.
15
Liss, P. S.: Conservative and non-conservative behavior of dissolved constituents during es-tuarine mixing, in: Eses-tuarine Chemistry, edited by: Burton, J. D. and Liss, J. D., Academic press, 93–130, 1976.
Liu, G., Fu, B., and Yang, P.: Quality of aquatic environment at Haihe River and the pollutant fluxes flowing into sea, Environ. Sci., 22, 46–50, 2001 (in Chinese with English Abstract).
20
Macko, S. A. and Ostrom, N. E.: Molecular and pollution studies using stable isotope. in: Sta-ble Isotopes in Ecology and Environmental Science, edited by: Lajtha, K. and Michner, R., Blackwell Scientific, Oxford, UK, 45–62, 1994.
Magalhaes, C. M., Joye, S. B., Moreira, R. M., Weibe, W. J., and Bordalo, A. A.: Effect of salinity
and inorganic nitrogen concentrations on nitrification and denitrification rates in intertidal
25
sediments and rocky biofilms of the Douro River Estuary, Portugal, Water Res., 39, 1783– 1794, 2005.
Mariotti, A., Germon, J. C., Hubert, P., Kaiser, P., Letolle, R., Tardieux, A., and Tardieux, P.: Ex-perimental determination of nitrogen kinetic isotope fractionation: some principle illustration for the denitrification and nitrification processes, Plant Soil, 62, 413–430, 1981.
30
BGD
11, 4563–4589, 2014Nitrate sources and dynamics in the salinized rivers and
estuaries
D. Xue et al.
Title Page
Abstract Introduction
Conclusions References
Tables Figures
◭ ◮
◭ ◮
Back Close
Full Screen / Esc
Printer-friendly Version Interactive Discussion
Discussion
P
a
per
|
D
iscussion
P
a
per
|
Discussion
P
a
per
|
Discuss
ion
P
a
per
|
Middelburg, J. J. and Nieuwenhuize, J.: Nitrogen isotope tracing of dissolved nitrogen behavior in tidal estuaries, Estuar. Coast. Shelf S., 53, 385–391, 2001.
Miyajima, T., Yoshimizu, C., Tsuboi, Y., Tanaka, Y., Tayasu, I., Nagata, T., and Koike, I.:
Longi-tudinal distribution of nitrateδ15N andδ18O in two contrasting tropical rivers: implications for
instream nitrogen cycling, Biogeochemistry, 95, 243–260, 2009.
5
Mulholland, P. J.: Regualtion of nutrient concentrations in a temperate forest stream: roles of upland, riparian, and instream processes, Limnol. Oceanogr., 37, 1512–1526, 1992.
OSPARCOM: Quality Status Report 2000, Region II – Greater North Sea, OSPAR Commission,
136+xiii pp., 2000.
Pollice, A., Tandoi, V., and Lestingi, C.: Influence of aeration and sludge retention time on
10
ammonium oxidation to nitrite and nitrate, Water Res., 36, 2541–2546, 2002.
Qin, Y., Zhange, L., Zheng, B., Cao, W., Liu, X., and Jia, J.: Impact of shoreline changes on the costal water quality of Bohai Bay (2003–2011), Acta Scientiae Circumstantiae, 32, 2149– 2159, 2012 (in Chinese with English Abstract).
Rabalais, N. N., Turner, R. E., Justiæ, D., Dortch, Q., Wiseman, W. J., and Sen Gupta, B. K.:
15
Nutrient changes in the Mississippi River and system responses on the adjacent continental shelf, Estuaries, 19, 386–407, 1996.
Robertson, L. A. and Kuenen, J. G.: Aerobic denitrification: a controversy revived, Arch. Micro-biol., 139, 351–354, 1984.
Robertson, L. A. and Kuenen, J. G.: Heterotrophic nitrification in
thiosphaera-pantotropha-20
oxygen-uptake and enzeme studies, J. Gen. Microbiol., 134, 857–863, 1988.
Robertson, L. A., Cornelisse, R., De Vos, P., Hadioetomo, R., Kuenen, J. G.: Aerobic denitrifi-cation in various heterotrophic nitrifiers, Anton. Leeuw. Int. J. G., 56, 289–299, 1989. Robertson, L. A., Dalsgaard, T., Revsbech, N. P., and Kuenen, J. G.: Confirmation of “aerobic
denitrification” in batch cultures, using gas chromatography and 15N mass spectrometry,
25
FEMS Microbiol. Ecol., 18, 113–119, 1995.
Ronner, U. and Sorensson, F.: Denitrification rates in the low-oxygen waters of the stratified baltic proper, Appl. Environ. Microb., 50, 801–806, 1985.
Schlarbaum, T., Daehnke, K., and Emeis, K.: Turnover of combined dissolved organic nitrogen and ammonium in the Elbe estuary/NW Europe: results of nitrogen isotope investigations,
30
BGD
11, 4563–4589, 2014Nitrate sources and dynamics in the salinized rivers and
estuaries
D. Xue et al.
Title Page
Abstract Introduction
Conclusions References
Tables Figures
◭ ◮
◭ ◮
Back Close
Full Screen / Esc
Printer-friendly Version Interactive Discussion
Discussion
P
a
per
|
D
iscussion
P
a
per
|
Discussion
P
a
per
|
Discuss
ion
P
a
per
|
Sebilo, M., Billen, G., Mayer, B., Billiou, D., Grably, M., Garnier, J., and Mariotti, A.: Assess-ing nitrification and denitrification in the Seine River and Estuary usAssess-ing chemical isotopic techniques, Ecosystems, 9, 564–577, 2006.
Seitzinger, S. P. and Kroeze, C.: Global distribution of nitrous oxide production and N inputs in freshwater and coastal marine ecosystems, Global Biogeochem. Cy., 12, 93–113, 1998.
5
Seitzinger, S. P., Gardner, W. S., and Spratt, A. K.: The effect of salinity on ammonia sorption in
aquatic sediments: implications for benthic nutrient recycling, Estuaries, 2, 167–174, 1991. Seitzinger, S. P., Harrison, J. A., Böhlke, J. K., Bouwman, A. F., Lowrance, R., Peterson, B.,
Tobias, C., and Van Drecht, G.: Denitrification across landscapes and waterscapes: a syn-thesis, Ecol. Appl., 16, 2064–2090, 2006.
10
Shao, X., Deng, X., Yuan, X., and Jiang, W.: Identification of potential sensitive areas of non-point source pollution in downstream watershed of Chaobaixin River, Environ. Sci. Surv., 29, 37–41, 2010 (in Chinese with English abstract).
Sigman, D. M., Casciotti, K. L., Andreani, M., Barford, C., Galanter, M., and Böhlke, J. K.: A bacterial method for the nitrogen isotopic analysis of nitrate in seawater and freshwater,
15
Anal. Chem., 73, 4145–4153, 2001.
Sigman, D. M., Granger, J., DiFiore, P. J., Lehmann, M. M., Ho, R., Cane, G., and van Geen, A.: Coupled nitrogen and oxygen isotope measurements of nitrate along the eastern North Pa-cific margin, Global Biogeochem. Cy., 19, GB4022, doi:10.1029/2005GB002458, 2005. Teixeira, C., Magalhães, C., Boaventura, R. A. R., and Bordalo, A. A.: Potential rates and
en-20
vironmental controls of denitrification and nitrous oxide production in a temperate urbanized estuary, Mar. Environ. Res., 70, 336–342, 2010.
Thomas, R., Washington, J. W., and Samarkina, L.: Aerobic denitrification: implications or the mom River Basin, Presented at EPA Science Forum, Washington DC, 16–18 May 2006, 2006.
25
Trevors, J. T. and Starodub, M. E.: Effect of oxygen concentration on denitrification in freshwater
sediment, J. Basic. Microb., 27, 387–391, 1987.
Umezawa, Y., Hosono, T., Onodera, S., Siringan, F., Buapeng, S., Delinom, R., Yoshimizu, C., Tayasu, I., Nagata, T., and Taniguchi, M.: Sources of nitrate and ammonium contamination in groundwater under developing Asian megacities, Sci. Total Environ., 404, 361–376, 2008.
30
BGD
11, 4563–4589, 2014Nitrate sources and dynamics in the salinized rivers and
estuaries
D. Xue et al.
Title Page
Abstract Introduction
Conclusions References
Tables Figures
◭ ◮
◭ ◮
Back Close
Full Screen / Esc
Printer-friendly Version Interactive Discussion
Discussion
P
a
per
|
D
iscussion
P
a
per
|
Discussion
P
a
per
|
Discuss
ion
P
a
per
|
Wankel, S. D., Kendall, C., Francis, C. A., and Paytan, A.: Nitrogen sources and cycling in the San Francisco Bay Estuary: a nitrate dual isotopic composition approach, Limnol. Oceanogr., 51, 1654–1664, 2006.
Xue, D., Botte, J., De Baets, B., Accoe, F., Nestler, A., Taylor, P., Van Cleemput, O., Berglund, M., and Boeckx, P.: Present limitations and future prospects of stable isotope
meth-5
ods for nitrate source identification in surface- and groundwater, Water Res., 43, 1159–1170, 2009.
Xue, D., De Baets, B., Vermeulen, J., Botte, J., Van Cleemput, O., and Boeckx, P.: Error as-sessment of nitrogen and oxygen isotope ratios of nitrate as determined via the bacterial denitrification method, Rapid Commun. Mass Sp., 24, 1979–1984, 2010.
10
BGD
11, 4563–4589, 2014Nitrate sources and dynamics in the salinized rivers and
estuaries
D. Xue et al.
Title Page
Abstract Introduction
Conclusions References
Tables Figures
◭ ◮
◭ ◮
Back Close
Full Screen / Esc
Printer-friendly Version Interactive Discussion
Discussion
P
a
per
|
D
iscussion
P
a
per
|
Discussion
P
a
per
|
Discuss
ion
P
a
per
|
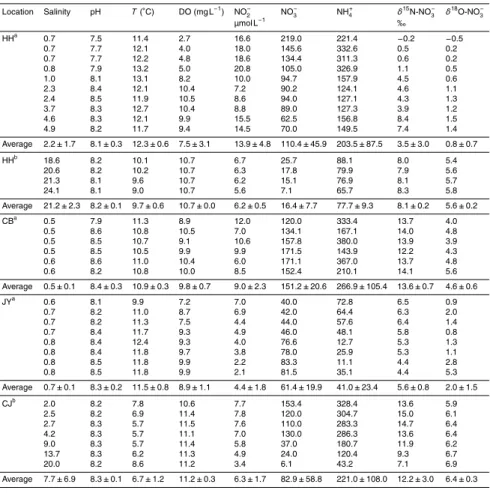
Table 1.Physicochemical properties and isotopic composition of NO−3 for the three investigated rivers and the corresponding estuaries.
Location Salinity pH T(◦C) DO (mg L−1) NO−
2 NO
−
3 NH
+
4 δ15N-NO−3 δ
18O-NO− 3
µmol L−1 ‰
HHa 0.7 7.5 11.4 2.7 16.6 219.0 221.4
−0.2 −0.5
0.7 7.7 12.1 4.0 18.0 145.6 332.6 0.5 0.2
0.7 7.7 12.2 4.8 18.6 134.4 311.3 0.6 0.2
0.8 7.9 13.2 5.0 20.8 105.0 326.9 1.1 0.5
1.0 8.1 13.1 8.2 10.0 94.7 157.9 4.5 0.6
2.3 8.4 12.1 10.4 7.2 90.2 124.1 4.6 1.1
2.4 8.5 11.9 10.5 8.6 94.0 127.1 4.3 1.3
3.7 8.3 12.7 10.4 8.8 89.0 127.3 3.9 1.2
4.6 8.3 12.1 9.9 15.5 62.5 156.8 8.4 1.5
4.9 8.2 11.7 9.4 14.5 70.0 149.5 7.4 1.4
Average 2.2±1.7 8.1±0.3 12.3±0.6 7.5±3.1 13.9±4.8 110.4±45.9 203.5±87.5 3.5±3.0 0.8±0.7
HHb 18.6 8.2 10.1 10.7 6.7 25.7 88.1 8.0 5.4
20.6 8.2 10.2 10.7 6.3 17.8 79.9 7.9 5.6
21.3 8.1 9.6 10.7 6.2 15.1 76.9 8.1 5.7
24.1 8.1 9.0 10.7 5.6 7.1 65.7 8.3 5.8
Average 21.2±2.3 8.2±0.1 9.7±0.6 10.7±0.0 6.2±0.5 16.4±7.7 77.7±9.3 8.1±0.2 5.6±0.2
CBa 0.5 7.9 11.3 8.9 12.0 120.0 333.4 13.7 4.0
0.5 8.6 10.8 10.5 7.0 134.1 167.1 14.0 4.8
0.5 8.5 10.7 9.1 10.6 157.8 380.0 13.9 3.9
0.5 8.5 10.5 9.9 9.9 171.5 143.9 12.2 4.3
0.6 8.6 11.0 10.4 6.0 171.1 367.0 13.7 4.8
0.6 8.2 10.8 10.0 8.5 152.4 210.1 14.1 5.6
Average 0.5±0.1 8.4±0.3 10.9±0.3 9.8±0.7 9.0±2.3 151.2±20.6 266.9±105.4 13.6±0.7 4.6±0.6
JYa 0.6 8.1 9.9 7.2 7.0 40.0 72.8 6.5 0.9
0.7 8.2 11.0 8.7 6.9 42.0 64.4 6.3 2.0
0.7 8.2 11.3 7.5 4.4 44.0 57.6 6.4 1.4
0.7 8.4 11.7 9.3 4.9 46.0 48.1 5.8 0.8
0.8 8.4 12.4 9.3 4.0 76.6 12.7 5.3 1.3
0.8 8.4 11.8 9.7 3.8 78.0 25.9 5.3 1.1
0.8 8.5 11.8 9.9 2.2 83.3 11.1 4.4 2.8
0.8 8.5 11.8 9.9 2.1 81.5 35.1 4.4 5.3
Average 0.7±0.1 8.3±0.2 11.5±0.8 8.9±1.1 4.4±1.8 61.4±19.9 41.0±23.4 5.6±0.8 2.0±1.5
CJb 2.0 8.2 7.8 10.6 7.7 153.4 328.4 13.6 5.9
2.5 8.2 6.9 11.4 7.8 120.0 304.7 15.0 6.1
2.7 8.3 5.7 11.5 7.6 110.0 283.3 14.7 6.4
4.2 8.3 5.7 11.1 7.0 130.0 286.3 13.6 6.4
9.0 8.3 5.7 11.4 5.8 37.0 180.7 11.9 6.2
13.7 8.3 6.2 11.3 4.9 24.0 120.4 9.3 6.7
20.0 8.2 8.6 11.2 3.4 6.1 43.2 7.1 6.9
Average 7.7±6.9 8.3±0.1 6.7±1.2 11.2±0.3 6.3±1.7 82.9±58.8 221.0±108.0 12.2±3.0 6.4±0.3
a
represents river;
b
BGD
11, 4563–4589, 2014Nitrate sources and dynamics in the salinized rivers and
estuaries
D. Xue et al.
Title Page
Abstract Introduction
Conclusions References
Tables Figures
◭ ◮
◭ ◮
Back Close
Full Screen / Esc
Printer-friendly Version Interactive Discussion
Discussion
P
a
per
|
D
iscussion
P
a
per
|
Discussion
P
a
per
|
Discuss
ion
P
a
per
|
-10 5 20 35 50 65 80
-10 -5 0 5 10 15 20 25 30
δ15N (‰)
δ
1
8 O
(
‰
)
HH River
HH Estuary
CB River
JY River
CJ Estuary
NFR Soil M&S
NP
NF
Fig. 2.δ15N andδ18O-NO−
3 of the salinized rivers and estuaries. Ranges of isotopic
composi-tion for five potential NO−
3 sources are adapted from Xue et al. (2009) and indicated by boxes:
NO−
3 in precipitation (NP), NO
−
3 fertilizer (NF), NH
+
4 in fertilizer and rain (NFR), soil N (Soil) and
BGD
11, 4563–4589, 2014Nitrate sources and dynamics in the salinized rivers and
estuaries
D. Xue et al.
Title Page Abstract Introduction Conclusions References Tables Figures ◭ ◮ ◭ ◮ Back Close
Full Screen / Esc
Printer-friendly Version Interactive Discussion Discussion P a per | D iscussion P a per | Discussion P a per | Discuss ion P a per |
0 5 10 15 20 25
5 10 15 20 25 30 HH River HH Estuary
Calculated mixing line HH1-E Calculated mixing line HH2-E
0 5 10 15 20 25
0 50 100 150 200 250 300
0 5 10 15 20 25
0 100 200 300 400 500
0 5 10 15 20 25
0 2 4 6 8 10
0 5 10 15 20 25
-1 0 1 2 3 4 5 6
.60 .65 .70 .75 .80 14
16 18 20 22
.60 .65 .70 .75 .80 200 220 240 260 280 300 320 340
.60 .65 .70 .75 .80 100 120 140 160 180 200 220 240 N O2 -(µ m o l L -1) N O3 -(µ m o l L -1) δ δ δ δ 1 8O -N O3 -(‰ ) N H4 +(µ m o l L -1) δ δ δ δ 1 5N -N O3 -(‰ ) Salinity Salinity
F1 F2 F1 F2
0 5 10 15 20 25
5 10 15 20 25 30 HH River HH Estuary
Calculated mixing line HH1-E Calculated mixing line HH2-E
0 5 10 15 20 25
0 50 100 150 200 250 300
0 5 10 15 20 25
0 100 200 300 400 500
0 5 10 15 20 25
0 2 4 6 8 10
0 5 10 15 20 25
-1 0 1 2 3 4 5 6
.60 .65 .70 .75 .80 14
16 18 20 22
.60 .65 .70 .75 .80 200 220 240 260 280 300 320 340
.60 .65 .70 .75 .80 100 120 140 160 180 200 220 240 N O2 -(µ m o l L -1) N O3 -(µ m o l L -1) δ δ δ δ 1 8O -N O3 -(‰ ) N H4 +(µ m o l L -1) δ δ δ δ 1 5N -N O3 -(‰ ) Salinity Salinity
0 5 10 15 20 25
5 10 15 20 25 30 HH River HH Estuary
Calculated mixing line HH1-E Calculated mixing line HH2-E
0 5 10 15 20 25
0 50 100 150 200 250 300
0 5 10 15 20 25
0 100 200 300 400 500
0 5 10 15 20 25
0 2 4 6 8 10
0 5 10 15 20 25
-1 0 1 2 3 4 5 6
.60 .65 .70 .75 .80 14
16 18 20 22
.60 .65 .70 .75 .80 200 220 240 260 280 300 320 340
.60 .65 .70 .75 .80 100 120 140 160 180 200 220 240 N O2 -(µ m o l L -1) N O3 -(µ m o l L -1) δ δ δ δ 1 8O -N O3 -(‰ ) N H4 +(µ m o l L -1) δ δ δ δ 1 5N -N O3 -(‰ ) Salinity Salinity N O2 -(µ m o l L -1) N O3 -(µ m o l L -1) δ δ δ δ 1 8O -N O3 -(‰ ) N H4 +(µ m o l L -1) δ δ δ δ 1 5N -N O3 -(‰ ) N O2 -(µ m o l L -1) N O3 -(µ m o l L -1) δ δ δ δ 1 8O -N O3 -(‰ ) N H4 +(µ m o l L -1) δ δ δ δ 1 5N -N O3 -(‰ ) Salinity Salinity Salinity Salinity
F1 F2 F1 F2 F1 F2 F1 F2
Fig. 3.DIN (NH+4, NO−
2, NO
−
3) concentrations and isotopic composition of NO
−
3 vs. salinity in
BGD
11, 4563–4589, 2014Nitrate sources and dynamics in the salinized rivers and
estuaries
D. Xue et al.
Title Page Abstract Introduction Conclusions References Tables Figures ◭ ◮ ◭ ◮ Back Close
Full Screen / Esc
Printer-friendly Version Interactive Discussion Discussion P a per | D iscussion P a per | Discussion P a per | Discuss ion P a per |
0 5 10 15 20 2 4 6 8 10 12 14 16 CB River JY River CJ Estuary
calculated mixing line CB-E calculated mixing line JY-E
0 5 10 15 20 0
50 100 150 200
0 5 10 15 20 0 100 200 300 400 500
0 5 10 15 20 4 6 8 10 12 14 16
0 5 10 15 20 1 2 3 4 5 6 7
.4 .5 .6 .7 .8 .9 0 2 4 6 8 10 12 14
.4 .5 .6 .7 .8 .9 0
100 200 300 400
.4 .5 .6 .7 .8 .9 20 40 60 80 100 120 140 160 180 N O2 -(µ m o l L -1) N O3 -(µ m o l L -1) δ δ δ δ 1 8O -N O3 -(‰ ) N H4 +(µ m o l L -1) δ δ δ δ 1 5N -N O3 -(‰ ) Salinity Salinity
0 5 10 15 20 2 4 6 8 10 12 14 16 CB River JY River CJ Estuary
calculated mixing line CB-E calculated mixing line JY-E
0 5 10 15 20 0
50 100 150 200
0 5 10 15 20 0 100 200 300 400 500
0 5 10 15 20 4 6 8 10 12 14 16
0 5 10 15 20 1 2 3 4 5 6 7
.4 .5 .6 .7 .8 .9 0 2 4 6 8 10 12 14
.4 .5 .6 .7 .8 .9 0
100 200 300 400
.4 .5 .6 .7 .8 .9 20 40 60 80 100 120 140 160 180 N O2 -(µ m o l L -1) N O3 -(µ m o l L -1) δ δ δ δ 1 8O -N O3 -(‰ ) N H4 +(µ m o l L -1) δ δ δ δ 1 5N -N O3 -(‰ )
0 5 10 15 20 2 4 6 8 10 12 14 16 CB River JY River CJ Estuary
calculated mixing line CB-E calculated mixing line JY-E
0 5 10 15 20 0
50 100 150 200
0 5 10 15 20 0 100 200 300 400 500
0 5 10 15 20 4 6 8 10 12 14 16
0 5 10 15 20 1 2 3 4 5 6 7
.4 .5 .6 .7 .8 .9 0 2 4 6 8 10 12 14
.4 .5 .6 .7 .8 .9 0
100 200 300 400
.4 .5 .6 .7 .8 .9 20 40 60 80 100 120 140 160 180 N O2 -(µ m o l L -1) N O3 -(µ m o l L -1) δ δ δ δ 1 8O -N O3 -(‰ ) N H4 +(µ m o l L -1) δ δ δ δ 1 5N -N O3 -(‰ ) N O2 -(µ m o l L -1) N O3 -(µ m o l L -1) δ δ δ δ 1 8O -N O3 -(‰ ) N H4 +(µ m o l L -1) δ δ δ δ 1 5N -N O3 -(‰ ) Salinity Salinity Salinity Salinity
Fig. 4.DIN (NH+4, NO−
2, NO
−
3) concentrations and isotopic composition of NO
−
3 vs. salinity in