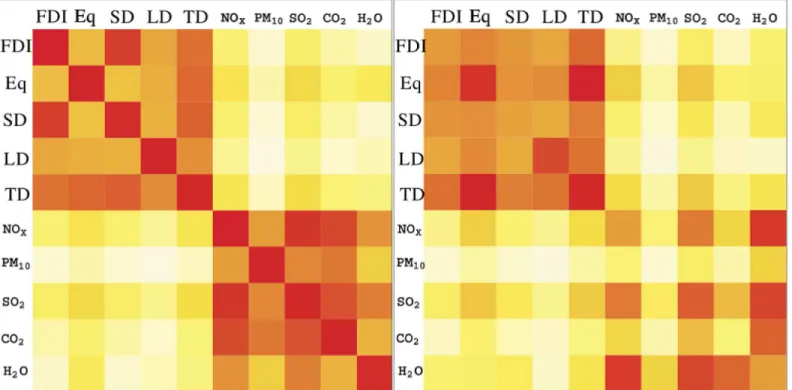
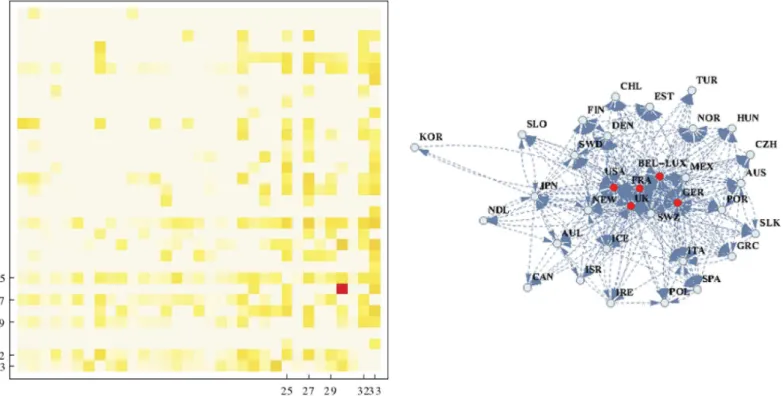
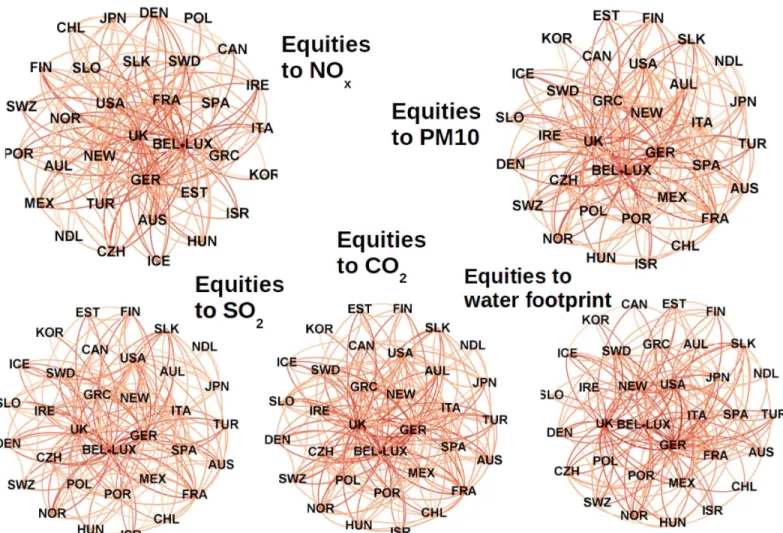
Interactions between Financial and Environmental Networks in OECD Countries.
Texto
Imagem

Documentos relacionados
In this work, we discuss transformations in the meaning of the concept of mass, which are important to physics teaching, by means of three conceptual schemes, which emphasize
Given the heterogeneity between the countries, the expectation of a dependence of the error terms and the signifi cant variation of the primary balance in a same country over
The probability of attending school four our group of interest in this region increased by 6.5 percentage points after the expansion of the Bolsa Família program in 2007 and
…xed and mobile networks and the pricing incentives for on-net and o¤-net
This paper analyses the effects in terms of size and volatility of government revenue and spending on growth in OECD and EU countries. The results of the paper suggest that both
This paper analyses the effects in terms of size and volatility of government revenue and spending on growth in OECD and EU countries. The results of the paper suggest that both
Significant differences between the cropping systems were recorded on the green mass yield and on the dry mass of the coriander shoots, with the single crop
The ratios between mass of albumen and mass of seeds (RMAMS) and mass of albumen and mass of fruits (RMAMF), as the other evaluated variables were not influenced by the
