Fiscal consolidation in developed and
emerging economies
Consolidação fi scal em economias desenvolvidas e emergentes
Resumo
Este trabalho tem por objetivo desmitifi car a visão dominante na literatura que atribui ganhos de cres-cimento às políticas de austeridade fi scal. Recorre--se a um conjunto de estimações de painel longo – por meio dos estimadores FGLS, de Driscoll & Kraay, com erros-padrão em painéis corrigidos, SUR e do Teste de Kónya (2006) - na busca de inferências robustas acerca das principais causali-dades que envolvem a problemática fi scal. Nossa conclusão é que em exercícios simultâneos a dois conjuntos de países – 24 economias emergentes e 20 desenvolvidas - as evidências empíricas dão suporte a conclusões bastante distintas entre eles, sugerindo que políticas econômicas idênticas para os países, além de inadequadas, podem conduzir a resultados opostos aos desejados. Sem ignorar os efeitos adversos associados a trajetórias explosivas de endividamento, nosso trabalho defende que a busca por ‘espaço fi scal’ seja determinada essen-cialmente por uma agenda pró-crescimento parti-cularmente nas economias emergentes confrontadas com os desafi os de infraestruturas associados ao ‘caminho de transição’.
Palavras-chave
austeridade fi scal; crescimento econômico; correla-ção; causalidade de Granger; painel não estacio-nário; regressões aparentemente não correlaciona-das (SUR).
Códigos JELE6; H62; H63. Paulo André Camuri
Universidade Federal de Minas Gerais Frederico G. Jayme Jr. Universidade Federal de Minas Gerais Ana Maria Hermeto Universidade Federal de Minas Gerais
Abstract
The debate regarding fi scal policy has given support to the formulation of an economic policy based on control of indebtedness and in persecution of public savings, acting as im-portant support for the economic growth. This paper presents evidence that counter acts this theory of expansionary austerity. A set of panel data regressions is estimated – through Driscoll & Kraay’s, FGLS, panel corrected standard er-rors, and SUR estimators and the causality test approach proposed by Kónya (2006) – in search of robust inference related to the main determi-nants that encompasses the fi scal framework. Our conclusion is that the empirical evidence - using a set of 20 developed economies and other of 24 emerging economies - suggests that identical economic policies for different coun-tries might conduce to results that are opposite to the desired outcome. Notwithstanding the adverse effects associated to explosive debt path, the search for “fi scal space” should be de-termined essentially by a pro-growth agenda. This is particularly important for the emerging economies facing the transition path challenges.
Keywords
fi scal austerity; economic growth;
correlation; Granger causality; panel time-series; seemingly unrelated regression (SUR).
1
Introduction
The debate regarding fi scal policy has been focused so far on evidence of the relationship between debt and economic growth. This has given sup-port to the formulation of an economic policy based on control of indebt-edness and in persecution of public savings, acting as important support for the economic growth.
Carmen Reinhart and Kenneth Rogoff support this argument and their papers have had a decisive impact. In the context of the international
eco-nomic crisis, Akerlof et al. (2014) point out the costs of the existence of
mul-tiple equilibrium and the need of countries to seek even more conservative levels (comparatively to that suggested in a context without crisis) of in-debtedness when it comes to the contingent obligations in a period of crisis.
This paper presents evidence that counteracts the traditional view of fi scal policy, known in the literature as a theory of expansionary austerity. In this regard, it is aligned to several works that point to contractionary effects (expansionary) – measured in terms of reduction (expansion) of the growth rate of the GDP – due to fi scal contractions (expansions). Al-though this literature, in general, analyzes the impacts on the product of reductions (expansion) of public expenses and/or increase (reduction) of the taxation, this paper used primary balances of the governments. The argument presented herein is that in simultaneous results to two different groups (developed and emerging countries), the empirical evidence sup-ports quite different conclusions, suggesting that no general fi scal policy is able to produce similar results in all countries.
inadequately the effects of time. After all, it is, in practice, based on micro
foundations, instead of macroeconomic shortcuts in their framework.1
This paper contributes with empirical literature about the relationship between primary balance and performance of the economic activity in three basic aspects. First, it focuses on causal relationships instead of corre-lation only, between a primary balance and economic growth. Sometimes, although such a relationship is presented, it is also less explored in the em-pirical literature. Moreover, the possibility of bidirectional causality is con-sidered, exposing its liquid effect; secondly, the causality tests used herein
are based on specifi cations that consider explicitly the premise cross-section
between the countries. Although this is essential nor the Estimator Gen-eralized Method of Moments (GMM), neither the obtained from Hurlin’s approach (2008), which is more commonly used in the literature that tests causality, consider the fact that a shock in a country can affect another country, particularly in the same group whose characteristics are similar,
as well as the contagious channel sometimes is clear.2 Third, this paper is
the result of a simultaneously transversal and temporal panel (Time Series
Cross Section Date, TSCD3).
2
Fiscal policy
A widespread part of the economic literature that addresses the fi scal pol-icy and the public debt is, in general, marked by the perception that from
1 Only recently, the works which objects of study are macroeconomic, have been progres-sively stricter in such econometric aspects in data treatment. Until recently, as EBERHARDT (2011) states, the macroeconomics studies have used exclusively microeconomic economet-ric instruments, in reference to the indiscriminate use of short panels. Accordingly, they re-strict the time treatment to studies of time series. The methodology of the short panel, partic-ularly the Generalized Method of Moments (GMM), simplifi es the treatment of the information related to the time cut. After all, through calculation of averages, it transforms, for instance, information of 5 time points into just one. Although this has the advantage of incorporating more information in the studies restricted to few time points no, the typical troubles of data in time series are ignored.
2 Besides these macroeconomic links, the presence of a cross-section premise in the estimates in the panel would be associated with the countries that are subject to similar institutional aspects, as would be the case of the economies signatory to the International Monetary Fund or the free trade areas, for instance. Lastly, the cross-section premise would express the effects of important local spillovers between regions and between countries.
a certain level, the debt presents a negative impact on the economic per-formance of the debtor’s countries. Historically, this view has appeared in
the literature under different approaches: “debt overhang” (Krugman, 1988),
“debt intolerance” (Reinhart; Rogoff; Savastano, 2003), “debt sustainability”
(Hamilton; Flavin, 1986) and “threshold” (Reinhart; Rogoff, 2009, 2010a,
2010b, 2010c, 2013).
The relationship between public indebtedness and economic growth has indeed dominated this literature through the existence of a negative correla-tion between public indebtedness and economic growth. An important ref-erence about the subject is the survey performed by Panizza and Presbitero (2013). This survey states that works focused on advanced economies have found robust results on the negative correlation between public indebted-ness and economic growth, even controlling for correlated variables. Never-theless, the authors have not found in the literature strong evidence around the existence of a causal relationship that stems from variables of indebted-ness towards variables of economic performance. This discussion therefore remains open and giving rise to different guidance of economic policy.
The existence of a negative correlation between the variables men-tioned could indicate that it is a smaller economic growth that deteriorates the indebtedness indicators, instead of the common belief that indebted-ness leads to lower economic growth. Besides, the relationship between such variables may show the existence of a third variable that affects, si-multaneously, public indebtedness and economic growth.
Since 2003, Carmem Reinhart and Keneth Rogoff have published sever-al papers where they show the existence of a negative correlation between indebtedness and economic growth, predominantly for countries with a high level of indebtedness, above 90% of the GDP for advanced econo-mies and above 60% of the GDP for emerging econoecono-mies. It is, however, important to notice that, although the infl uence of Reinhart and Rogoff in the discussion about economic policy has focused particularly on the issue
of the threshold, their conclusions start from the assumption of a causal
link, exclusively (and/or dominantly) related to the debt towards econom-ic growth, wheconom-ich is not supported by the econometreconom-ic evidence utilized.
In an effort to clarify this matter, Panizza and Presbitero (2012b)
suggest-ed a new instrumental variable4 for debt – which can capture the derived
effects of the interaction between the debt expressed in foreign currency and the volatility of the exchange rate. Indeed, when the last variable is included, Panizza and Presbitero (2012b) reject the hypothesis of a causal-ity link between indebtedness and growth in the countries of the OECD.
Other important references are Irons and Bivens (2010), Pattillo, Poirson and Ricci (2004) and Easterly (2001). While the former have found evi-dence that causality occurs from economic growth to debt, the latter use
the same method as Rigobon (2002)5 to test not only the impact of debt
in economic growth, but also the contrary, thus controlling for reverse causality. The interaction between such variable is said to be signifi cant in the two meanings. Similarly, for Easterly (2001), slowing/falls in economic activity - through its developments their repercussions in the future public revenues - tend to worsen the indicators of indebtedness of the countries, hindering the fulfi llment of their debts. Moreover, the author highlights that such contamination is more severe and prolonged in heavily indebted poor countries (HIPCs).
The discussion on the effectiveness, or even the need, of austerity poli-cies and the control of the public indebtedness refl ects the difference in
theoretical approaches about the channels of debt transmission.6 These, in
turn, derive from a compatibility between the amount of the public debt and the intertemporal budget constraint of the government that will be satisfi ed whenever the primary surplus (as proportion of the GDP) is at least equal to:
where, g = growth rate of the real GDP;
r = real interest rate;
b = share of the public debt with respect to the GDP;
5 The method of Rigobon (2002) enables an estimate of models of simultaneous equations in the presence of heteroscedasticity in the series. Due to the absence of good instruments in such series, the identifi cation by method of instrument variable is not possible.
6 Taylor, Proaño, Carvalho and Barbosa (2012) show a detailed analysis of these possible transmission channels, focusing especially on different causalities between the defi cit/prod-uct and the debt/prodcit/prod-uct ratios, suggesting that, in the North-American case, the increase of the defi cit generates positive results in the product, even when the possible adverse effects in the interest rate are considered.
(1)
1 g
b
r g
The transmissions can occur: i) via a crowding out effect of the
govern-ment expenses on the consumption and/or private investgovern-ments; ii) via
Keynesian multiplier; iii) through the effects of the public defi cit in the
current account of the balance of payments in a certain country; and also
iv) through the Ricardian Equivalence.
The fi rst group of studies brings the traditional view on the subject, which is contrary to expanding the share of the government expenses. The argument for it is that, by expanding its expenses, the government would compete with the private sector, only leading to an increase of its relative participation in the product, without in fact expanding it in the long term. Alternatively, the Keynesian theory of income and production provides that changes in the government expenses affect, via multiplier, the effec-tive demand, the employment and the product in the short term,
even-tually affecting the economic growth in the long term via investment.7
In the Keynesian framework, the adoption of austerity fi scal policies can thus result in effects opposed to the desired. In other words, it results in a contraction/slowdown of the economic activity and expansion of the rela-tive participation of the public debt in the GDP. Evidently, this condition depends on idle capacity and the fi nancial conditions of the economy. This view confi rms the typical countercyclical Keynesian policy.
A third group suggests the existence of “twin defi cits”, which happen when countries with fi scal defi cits would also present defi cits in the
check-ing account.8
Lastly, a fourth approach about the relationships between the fi scal bal-ance and economic activity is related to the Ricardian Equivalence. As for-malized by Barro (1974), such principle is based on the idea that the govern-ment cannot infl uence the demand in the long-term, once the bond issues that would fi nance the expansion of the governmental demand would be realized by private agents as a change, only temporary (current) in their in-comes, without any impact on their permanent income. This would occur because the private agents, aware of the issuance of bonds, would provide for a future expansion of the levies to be charged by the government.
7 For details of the concepts of uncertainty and preference by liquidity, see Keynes (1996); for the horizontal, vertical and post Keynesian currents, see De Paula (1996); for the Kaleck-ian principle of increasing risk, see Kalecki (1954), and for the model of fi nancial fragility, see Minsky (1982).
The conventional view, either in the Barro-Ricardo version or in the crowd-ing-out, one disqualifi es any attempt by the government to directly infl uence the aggregate demand, as there is no effect on the product in the long-term. Other papers, however, suggest that the net long term effect of the government intervention could be worse, or negative as they lead the product declines. Those papers focus on market reaction (vigilant bonds) to the risk of default of the public debt and as the investors’ confi dence reacts to the fi scal evolution. The idea is that, in the event of a need for new emissions and the aversion to the risk by the bond vigilants, there is a trend to lower the price of the bonds (therefore increasing the interest rate paid by them) either in the primary or the secondary markets. The results would be as negative in the real economy - through adverse effect in the decisions of private investment very sensitive to the interest rates - as in the fi nancial market - via smaller attractiveness of the bonds, which can also result in a scenario of crisis of the sovereign debt.
Such an approach is thus in line with the expansionist pro-austerity argument by Alesina and Ardgna (1998, 2010) that provides a net in-crease in the aggregate demand, via income effect, arising from their belief regarding the capacity of the fi scal consolidation to avoid future situations of default and the increase of the taxation by government. The smaller
probability of default could lead to a drop of the interest rate (and,
there-fore, valuations of assets) resulting in a boom of consumption and
invest-ment. The positive effects in the aggregate demand would overlap the initial negative effect from fi scal consolidation.
3
Material and methods
The database in this paper was built using different sources, yearly, from 1948 to 2012. It covers 33 economies - 20 of them developed and 13 emerging - with data available from primary result, among the 44
econo-mies that were studied by Reinhart and Rogoff (2010b and 2013).9
The series of the primary balance of the general government as share of the GDP basically comes from Mauro, Romeu, Binder and Zaman (2013) and is available for 20 developed economies and 13 emerging for a period
between 1948 and 2011. For 2012, the data of the Monitor Fiscal /FMI
(Oc-tober 2014) was used.10
The “annual rate of the GDP growth” series was obtained by a time series built from GDP data from two sources widely used in the literature:
the databases of Maddison (2013) and the Total Economy Database (TED)11.
Although the second incorporates the fi rst, the GDP series was assembled with Maddison data from 1947 to 2008 and from 2009 with data of the TED. Both sources have data in international dollars of 1990 from Geary-Khamis and, therefore, result in real rates of variation of the GDP.
Besides these two main data sources, infl ation data and interest rates also were used as control variables. The series of (variation of) infl ation used was “64XZF” from IFS/FMI, which brings variation from the previous year, of the consumer price index (CPI). For the interest rate, according to the methodology used by Moreira and Rocha (2009), the interest rate of deposit (jdep) and the interest rate of discount (jdis) were merged – both available in the IFS/FMI - in a third, which received the name “jdd”.
As our study refers to a broad set of countries and to a relatively long period, ignore and/or do not treat appropriately the time effects, the auto-correlations of the heterogeneity between the countries would indeed imply to underestimate the elements that determine the processes that the study seeks to understand. Thus, rather than to organize the observations by debt range ignoring the other heterogeneities and correlations between the coun-tries, we prioritize them despite the type of indebtedness of each country.
This study performed an econometric instrumental still little explored in macroeconomic studies and particularly in the economy and fi scal pol-icy. By exploring cross-section data and time series, this methodological framework (long panel) benefi ts in degrees of freedom and effi ciency of
10 There is no data available in this series for the following countries that are in Reinhart and Rogoff (2010, 2013): Ecuador, El Salvador, Indonesia, Malaysia, Kenya, Uruguay, Peru, Singapore and Nigeria. The number of notes of India and Sri Lanka are not enough for the procedures performed.
the estimated parameters, while minimizing collinearity between the ex-planatory variables. In addition, it controls the effects associated with the omission of important explanatory variables. Another advantage is that the method involves long panel heterogeneity among countries which in practice allows hypothesis testing to be performed separately for each country. By merging broadly available information and robust estimations
over time and in a cross section to the different heterogeneities between and
within the countries, to the autocorrelations, and to the unit root and the cross-section dependence, this exercise presents sensitive specifi cations to the characteristics above. It can lead to results and, ultimately, suggestions of economic policy that is signifi cantly different from the one found when these features are ignored.
Therefore, three sets of procedures were performed: i) a set of long
panel estimates with specifi c controls for heteroscedasticity and correla-tion, namely, FGLS (Parks, 1967); Driscoll and Kraay estimator (1998) from
procedure proposed by Hoechle (2007); and Panel Correct Standard Error
(PCSE) proposed by Beck and Katz (1995) from OLS and Prais-Winsten
estimators; ii) Seemingly Unrelated Regression (SUR); and iii) Kónya Test
(2006) on bidirectional causality. Previously, tests of stationarity were per-formed (Test of Fisher, Maddala and Wu, 1999 and Test of Pesaran, 2007), as well as cointegration (Teste of Pedroni, 1999 and Westerlund, 2007) and
contemporary dependence (cross section dependence, via Pesaran, 2004)12.
The purpose was to fi nd inferences of the causalities between primary balance and GDP growth.
Although the FGLS, Driscoll and Kraay estimates (1998), and estimates with PCSE deal in different ways with the troubles of heterogeneity, such as self-correlation and contemporary correlation, they have the disadvan-tage of only bringing results to set of countries. Given the heterogeneity between the countries, the expectation of a dependence of the error terms and the signifi cant variation of the primary balance in a same country over time, we used the SUR methodologies and the Kónya Test (2006) to obtain results sensitive to the dynamics that are possibly differentiated, country by country, of causality between primary balance and economic growth.
As we consider this feature a particularly important point, and because we want to infer causalities between primary balance and GDP growth
that is eventually different among countries, we used the SUR estimator, which is more effi cient compared to the estimator MQO in the presence
of a cross-section dependence.13
Both SUR and the Kónya Test are linked to Phillips and Hansen (1990) and Phillips (1995) that propose, respectively, the Fully Modifi ed Least Squares, FM-OLS, and the Fully Modifi ed VAR, FM-VAR originally by
Zellner (1962) on the estimator SUR.14
According to that original theory, and to a bivariate autoregressive vector of fi nite order such as the following presented, Kónya (2006) proposes a test of Granger causality between two variables, country by country, applied specifi cally to data in a panel and guided by the
estima-tor SUR15:
where, i = 1,....,N refers to the country;
t = 1,...,T to the year;
l = lag; and
e are white noise and can be correlated for a certain coun-try, but not between the countries.
Noticing that a certain country shows in (2) the same exogenous and endogenous variables, the OLS are consistent and asymptotically effi -cient so that the 2N equations could be estimated one by one in any order. In other words, rather than N systems VAR as in (2), we could start from two sets of equations, one for Y and another for X, where the
con-temporary correlation would become the single possible link between
13 In the presence of contemporary correlation (cross section dependence) the estimators MQO are no longer BLUE (best linear unbiased estimators).
14 The Estimator SUR is more effi cient than OLS, in the presence of contemporary correla-tion, precisely to explore the additional information supplied by the panel and ignored in other procedures.
15 In the case of this study, the Kónya Test was applied to analyze the possible causalities between the primary result of the government and GDP growth. Kar, Nazlioglu and Agir (2011) adopt a similar procedure to test the causalities between fi nancial development and economic growth.
(2)
, 1, 1, , , 1, , , 1, ,
1 1
i i
mly mlx
i t t i l i t l i l i t l i t
l l
Y Y Y X
, 2, 2, , , 2, , , 2, ,
1 1
i i
mly mlx
i t i i l i t l i l i t l i t
l l
X Y Y X
1, ,i t
the regressions for each country, once each equation, both systems (3) and (4), would present different exogenous and endogenous variables. Therefore, the systems lose the VAR characteristic and may start to be treated as SUR.
and
This is how the hypothesis of no causality through a Wald test of restric-tions can be investigated. There would be unidirectional causality from X
to Y if not all γ1i were equal to zero in (3), but all β2i were equal to zero
in (4). There would be unidirectional causality from Y to X if all γ1i were
equal to zero in (3), but not all β2i were equal to zero in (4). There would
be bidirectional causality between X and Y if not all β2i and not all γ1i were
equal to zero (3 and 4). Lastly, there would not be causality between X and
Y if all γ1i and all β2i were equal to zero (3 and 4).
4
Evidence between primary balance and economic
growth
Tables 1 and 2 show results of estimations related to the causal relation-ships between the government primary balance and the GDP performance. Before making the aforementioned estimations, it was identifi ed through panel procedures that the series of government primary balance - both for developed countries and for emerging countries - do not have a unit root.
They have, instead, a cross section dependence and - at least for the set of
(3)
(4)
1 1
2, 1,2 1,2, 2, 1,2, 2, 1,2,
1 1
mly mlx
t l t l l t l t
l l
Y Y X
1 1
, 1, 1, , , 1, , , 1, ,
1 1
mly mlx
N t N N l N t l N l N t l N t
l l
Y Y X
2 2
1, 2,1 2,1, 1, 2,1, 1, 2,1,
1 1
mly mlx
t l t l l t l t
l l
X Y X
2 2
2, 2,2 2,2, 2, 2,2, 2, 2,2,
1 1
mly mlx
t l t l l t l t
l l
X Y X
2 2
, 2, 2, , , 2, , , 2, ,
1 1
mly mlx
N t N N l N t l N l N t l N t
l l
X Y X
developed - they are cointegrated with the series of GDP growth16. This analysis, initially made for all the countries together, indicates that primary balances are related contemporaneously and/or a period ahead - at positive rates of GDP growth, either in emerging as in devel-oped economies, but would be signifi cantly greater in the emerging (see
Table 1)17. Therefore, such evidences would be aligned to the
pro-auster-ity expansionist argument that provides a net increase in the aggregate demand, via income effect of the agents. In other words, the positive ef-fects in the aggregate demand would overlap initial negative effect from fi scal consolidation.
Table 2 reveals, as expected, that the GDP growth positively affects to 5% signifi cance the government’s primary balance, both in the emerging and in the developed countries. One could notice that this impact seems to be signifi cantly greater in developed countries, suggesting that these would save considerably more than emerging in periods of economic
growth. These results are in accordance with Kaminsky et al. (2004), where
“when it rains, it pours”, suggesting that fi scal policy of the emerging coun-tries would tend to intensify, and not to relax, the effects of the business
cycles18. Although we do not explicitly analyze the government expenses
and revenues, the results of Table 2 seem to support this viewpoint. Although given the robustness of these results, it is important to high-light that this fi rst methodological approach ignores the presence of the cross-section contemporary dependence among countries. Therefore, they ignore the contemporaneous and crossed effects among countries related to the markets of bonds and to obtaining fi scal surplus and/or defi cits. The dynamic of some countries has to be analyzed more cautiously, since it can be highly different than their group. Indeed, the SUR estimations can enable those features.
Our results through SUR estimations (Table 3) and the Kónya Test (Table 4), indeed, reveal some causalities that are signifi cantly different from the ones presented to the set of countries. Both SUR estimations
16 The results of the tests of stationarity in panel of Fisher, Maddala and Wu (1999), of cointegration of Westerlund (2007) and Pedroni (1999), and Pesaran (2004) of cross-section dependence are in the Annexes. The test of Westerlund (2007) cannot be performed to the set of emerging countries due to the great number of “missings”.
17 The Tables 1 (above) and A6 (Annexes) are different because they have, respectively, infl ation and interest rate as control variable.
and the Kónya Test share evidences that for Austria, Belgium, Denmark, Italy, Norway and Portugal (developed), a primary surplus would cause a negative effect a period ahead (instead of positive, as pointed out in the
estimations that ignore the presence of a cross-section dependence in the
data) in terms of GDP growth rate19. Kónya Tests suggest evidence in this
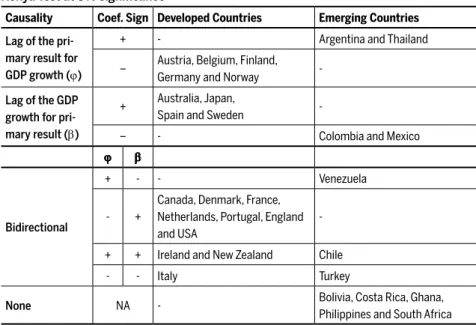
regard also for Finland, Germany, Canada, France, Netherlands, UK, USA (developed) and Turkey (emerging). These would be evidences against the expansionary austerity theory and are aligned to several papers that point out effects of slowdown or recession - measured in terms of reduction of the GDP growth rate and/or deterioration in the indicator DÍV/PIB - de-rived from fi scal contractions, either through cuts in public expenses and/
or increase of taxation. Callegari et al. (2012), Crotty (2012), Taylor et al.
(2012), and McCausland and Theodossion (2014) are important references in this line of work.
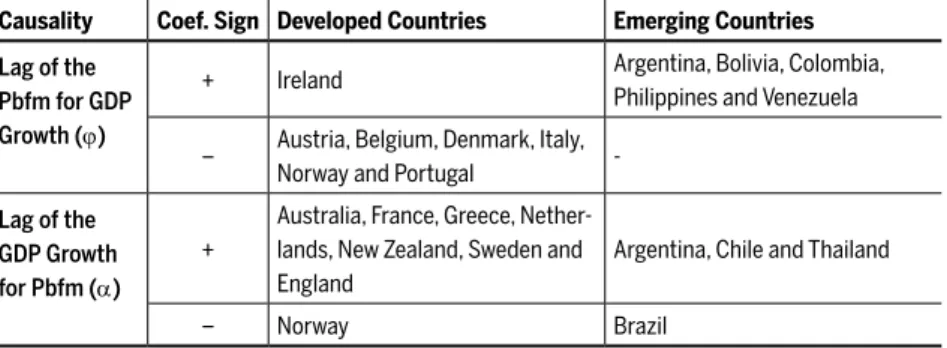
Regarding the evidences in favor of the expansionary austerity theory, the SUR procedure identifi es only the case of Argentina, Bolivia, Co-lombia, Philippines and Venezuela (emerging) and Ireland (developed). According to the Kónya Test, this would be the case of the emerging Argentina and Thailand (emerging countries), with unidirectional causal-ity, and Ireland, New Zealand (developed countries) as well as Venezuela and Chile (emerging countries), with bidirectional causality. Thus, de-spite the distinct methodology and without targeting the data in govern-ment revenues and expenses, our results (guided by series of governgovern-ment primary balance) indicate that, in fact, there are empirical evidences that
some countries can enjoy expansionary fi scal consolidation20. This paper
contributes to this literature by presenting evidence in this direction for emerging economies as well, once most of the papers refer exclusively to developed economies and/or OECD, like Giavazzi and Pagano (1990); Alesina and Ardagna (1998, 2010); McDermott and Wescott (1996); Gia-vazzi, Jappelli and Pagano (2000); Ardagna (2004); and Lambertini and Tavares (2005).
Considering the inverse order of causality and guided by SUR esti-mations, increases in the GDP would lead to improvements in the pri-mary balance a period ahead for Australia, France, Greece, Netherlands,
19 Kónya is different from the SUR estimation due to simultaneously considering the in-verse order of causality Granger.
yme & Hermet
o
Impact of the primary balance on the GDP growth (infl ation as a control variable)
Panel Variable FGLS (1) Driscoll-Kraay (1) - EF Driscoll-Kraay (2) - Pooled Prais-Winsten (1) Coef. Estat. z p >|z| Coef. Estat. t p >|z| Coef. Estat. t p>|z| Coef. Estat. z p>|z|
D
ev
eloped - cont
empo-rar
y r
elationship
pbfm 0.123* 5,15 0,000 0.1694* 4,41 0,000 0.0919* 3,12 0,003 0.1113* 3,62 0,000
jdd -0,0656 -2,44 0,015 -0,1424 -4,1 0,000 -0,0759 -2,36 0,021 -0,073 -2,02 0,043
tend -0,0492 -7,49 0,000 -0,0678 -6,04 0,000 -0,0565 -4,77 0,000 -0,0528 -5,53 0,000
constante 4,8941 14,71 0,000 6,2915 12,48 0,000 5,5543 10,29 0,000 5,1786 13,57 0,000
Wald chi2 80,06 F 18,94 F 10,89 Wald chi2 51,40
Prob>chi2 0,000 Prob > F 0,000 Prob > F 0,000 Prob > chi2 0,000
D
ev
eloped - r
elation 1
period ahead
lagpbfm -0,042 -1,820 0,069 0,0433 1,330 0,190 0,0048 0,20 0,843 -0,0571 -1,850 0,064
jdd -0,074 -2,760 0,006 -0,1531 -3,870 0,000 -0,0883 -2,59 0,012 -0,086 -2,150 0,031
tend -0,046 -7,080 0,000 -0,0642 -5,530 0,000 -0,0552 -4,57 0,000 -0,0497 -4,980 0,000
constante 5,084 15,570 0,000 6,3497 12,750 0,000 5,6732 10,74 0,000 5,3514 13,620 0,000
Wald chi2 60,50 F 16,03 F 9,32 Wald chi2 36,19
Prob>chi2 0,000 Prob > F 0,000 Prob > F 0,000 Prob > chi2 0,000
E
mer
ging - cont
empo-rar
y r
elationship
pbfm 0.1479* 2,81 0,005 0.1864* 2,53 0,014 0.1556* 2,15 0,035 0,1259 1,85 0,064
jdd -0,0005 -2,5 0,012 -0,0005 -4,78 0,000 -0,0006 -6,57 0,000 -0,0005 -2,37 0,018
tend -0,0238 -1,56 0,118 -0,0052 -0,22 0,827 -0,0127 -0,54 0,588 -0,0113 -0,44 0,657
constante 4,7158 6,76 0,000 3,9251 3,63 0,001 4,2902 4,14 0,000 4,2032 3,76 0,000
Wald chi2 14,2000 F 10,43 F 15,96 Wald chi2 9,15
Prob>chi2 0,0027 Prob > F 0,000 Prob > F 0,000 Prob > chi2 0,027
v
a E
c
onomia�
v.25
n.
especial
2
Fis
cal c
ons
olidation in de
veloped and emer
ging ec
onomie
s
E
mer
ging - r
elation 1
period ahead
lagpbfm 0,0714 1,34 0,182 0.1997* 3,150 0,003 0.1644* 2,600 0,012 0,1177 1,770 0,076
jdd -0,0005 -2,32 0,02 -0,0005 -4,510 0,000 -0,0005 -6,540 0,000 -0,0005 -2,270 0,023
tend -0,0203 -1,33 0,183 -0,0099 -0,410 0,682 -0,0158 -0,680 0,499 -0,0120 -0,450 0,650
constante 4,5816 6,54 0,000 4,1220 3,770 0,000 4,4182 4,280 0,000 4,2242 3,620 0,000
Wald chi2 8,29 F 11,05 F 17,54 Wald chi2 8,75
Prob>chi2 0,041 Prob > F 0,000 Prob > F 0,000 Prob > chi2 0,0328
v.25
n.
especial
2
015
No
v
a E
c
onomia�
8
4
yme & Hermet
o
Panel Variable FGLS (1) Driscoll-Kraay (1) - EF Driscoll-Kraay (2) - Pooled Prais-Winsten (1) Coef. Estat. z p >|z| Coef. Estat. t p >|z| Coef. Estat. t p>|z| Coef. Estat. z p>|z|
D
ev
eloped
drgdp 0.1499* 5,65 0,000 0.2415* 2,79 0,007 0,1777 1,99 0,051 0.155* 4,79 0,000
jdd 0,0693 1,82 0,069 -0,0944 -1,08 0,285 -0,1367 -2,13 0,037 0,079 1,74 0,082
tend na na na na na na na na na 0,029 1,01 0,312
constante -0,3401 -1,01 0,312 0,8677 1,13 0,264 1,3037 2,07 0,043 -1,578 -1,25 0,211
Wald chi2 34,23 F 6,18 F 6,31 Wald chi2 24,75
Prob>chi2 0,000 Prob > F 0,004 Prob > F 0,000 Prob > chi2 0,000
E
mer
ging
drgdp 0.0714* 2,77 0,006 0.1058* 2,55 0,013 0,1043 1,94 0,057 0.0711* 2,53 0,011
jdd 0,0002 1,53 0,126 0,001 0,37 0,709 0,0010 1,62 0,110 0,001 2,57 0,01
tend na na na na na na na na na 0,0564 2,52 0,012
constante 0,0785 0,2400 0,8140 0,2094 0,8100 0,4220 0,1924 0,6000 0,5520 -2,5565 -2,59 0,010
Wald chi2 9,36 F 3,26 F 2,79 Wald chi2 18,27
Prob>chi2 0,009 Prob > F 0,045 Prob > F 0,069 Prob > chi2 0,001
v
a E
c
onomia�
v.25
n.
especial
2
New Zealand, Sweden and England (developed countries) and Argen-tina, Chile and Thailand (emerging countries). The Kónya Test sug-gests that this positive effect would occur unidirectionally in Australia, Japan, Spain and Sweden (developed countries) and bidirectionally in the Canada, Denmark, France, Netherlands, Portugal, England, USA, Ireland and New Zealand (developed countries) and Chile (emerging country). In other words, the results suggest - contrary to the results of the estima-tions FGLS, Driscoll-Kraay and Prais-Winsten - that the rate of public savings tends to increase in a growth period, not exclusively in deve-loped economies. For Italy (devedeve-loped country) and Turkey, Venezuela, Colombia and Mexico (emerging countries) the evidence - according to the Kónya Test - is, in fact, that GDP growth periods would be associ-ated with declines, a period ahead, in the primary balances. The same would happen, according to the results of the SUR estimations, in the Norway (developed country) and Brazil (emerging country), indicating that fi scal indicators in these economies would get worse, rather than improve, in economic growth periods.
Table 3 Causal relationships between primary balance and economic growth: SUR at 5% signifi cance
Causality Coef. Sign Developed Countries Emerging Countries
Lag of the Pbfm for GDP Growth (ϕ)
+ Ireland Argentina, Bolivia, Colombia, Philippines and Venezuela
– Austria, Belgium, Denmark, Italy, Norway and Portugal
-Lag of the GDP Growth for Pbfm (α)
+
Australia, France, Greece, Nether-lands, New Zealand, Sweden and England
Argentina, Chile and Thailand
– Norway Brazil
Causality Test of the Lag of the Primary Balance towards GDP Growth: drgdp = + ϕ Lagpbfm (+ β Lag jdd) + C, where C = constant. Causality Test of the Lag of GDP Growth towards Primary Balance: drgdp = + ϕ Lagpbfm (+ β Lag jdd) + C.
Data not available for estimations for Ecuador, El Salvador, India, Indonesia, Kenya, Malaysia, Nigeria, Peru, Singapore, Sri Lanka or Uruguay (emerging countries).
Data is not suffi cient to the fi rst estimation for: Germany, Netherlands, New Zealand, Spain, Sweden and USA; and to the second estimation for: Austria, Canada, Finland, Germany, Netherlands, Italy, Japan, Portugal and USA (developed countries).
Table 4 Causal relationships between primary balance and economic growth:
Kónya Test at 5% signifi cance
Causality Coef. Sign Developed Countries Emerging Countries
Lag of the pri-mary result for GDP growth (ϕ)
+ - Argentina and Thailand
– Austria, Belgium, Finland, Germany and Norway
-Lag of the GDP growth for pri-mary result (β)
+ Australia, Japan,
Spain and Sweden
-– - Colombia and Mexico
ϕ β
Bidirectional
+ - - Venezuela
- +
Canada, Denmark, France, Netherlands, Portugal, England and USA
-+ + Ireland and New Zealand Chile
- - Italy Turkey
None NA - Bolivia, Costa Rica, Ghana, Philippines and South Africa
Causality Test of the Primary Balance in direction to the GDP Growth: and the GDP Growth in direction to the Primary Balance:
Data not available in estimations for Ecuador, El Salvador, India, Indonesia, Kenya, Malaysia, Nigeria, Peru, Singapore, Sri Lanka and Uruguay (emerging countries).
Data is not suffi cient for: Austria, Canada, Finland, Greece, New Zealand, Norway, Sweden and England (developed countries) and Brazil (emerging country).
Result at 5% signifi cance
5
Conclusions
A general conclusion of this paper is that some countries would not en-joy expansionary fi scal consolidation. In this regard, our results counteract the arguments that the increase in the public savings and declines in the
rate Debt/GDP would be sine-qua-non conditions to the economic growth.
Moreover, they suggest that increased fi scal and primary surplus would lead to even more contractionary effects in the emerging economies if compared to developed ones. The empirical results suggest that it is not possible to generalize empirically the relationship between economic growth and public indebtedness. Indeed, if theoretically there is no
agree-, 1 1
N t t t
Y Y X
, 1 1
N t t t
ment regarding this discussion, we show that empirically there is also no room for a consensus.
As far as we know, the empirical results we show in this paper is new in the literature regarding indebtedness and fi scal policy both in emerging and developed economies. Indeed, we benefi t simultaneously the broad
(and only recent) cross-section and timely database, with signifi cant gain of
information comparatively to the methodologies of panel and time series usually used. The results are robust in different ways to generate the data: heteroscedasticity inside and between the countries, autocorrelation, unit
root and cross-section dependence. Besides, it required the substantial
vol-ume of estimations, tests and specifi cations presented herein.
For country groups, the FGLS estimations, from Driscoll & Kraay, and with standard-errors in panels adjusted corroborate in the two groups of countries studied herein, the dominant thesis of expansionist fi scal auster-ity (Alesina; Ardgna, 1998, 2010) and that the governments of emerging economies would have greater diffi culty to save in growth periods. “When
it rains, it pours” as Kaminsky et al. (2004), comparatively to the
devel-oped countries. The methodology employed, by enabling comparisons between developed and emerging countries, allows to weigh and even question the conclusions, such as those of economic policy, formulated from these initial results (per group), and correspondingly, from dominant literature that shares this vision.
Moreover, when we turn to a modeling that considers the contemporary dependence (cross-section) among the countries, the different heterogene-ities between them over time, as well as all possible directions of causality, our results reveal that certain countries may present dynamics signifi cantly distinct from those attributed to the groups of which they are part. The results both for the SUR as the Kónya Test share evidence that for Aus-tria, Belgium, Denmark, Italy, Norway and Portugal (developed countries), of the growth of the primary surplus would harm economic growth one period ahead. The estimations of the Kónya Test suggest evidence in this regard also to Finland, Germany, Canada, France, Netherlands, UK, USA (developed) and Turkey (emerging).
In this regard, this paper pays attention to the risks of adopting Debt/ GDP goals as a single and unequivocal indicator of the fi scal condition of the countries. In this context, the belief in the expansionary fi scal austerity often has opposite effects and requires increasing fi scal efforts without vis-ible success. Besides, as Ostry, Loungani and Furceri (2016) highlight, fi scal austerity is associated with increased income inequality.
Future research could investigate the effects of the fi scal consolidation on unemployment and income distribution in the fashion of McCausland and Theodossion (2014). Such analyses have been evaluating so far, but econometric evidence used herein can contribute to new and important insights of economic theory and policy.
References
AKERLOF, G. A.; BLANCHARD, O. J.; ROMER, D.; STIGLITZ, J. E. (Eds.) What have we
learned? Macroeconomic Policy after the Crisis. MIT Press, 2014.
ALESINA, A.; ARDAGNA, S. Tales of fi scal adjustment. Economic Policy, n.13, p.487-545, 1998. ARDAGNA, S. Large changes in Fiscal Policy: Taxes versus Spending. In: NATIONAL
BU-REAU OF ECONOMIC RESEARCH. Tax Policy and the Economy. v.24, NBER Chapters,
p.35-68, 2010.
ARDAGNA, S. Fiscal stabilizations: When do they work and why?European Economic Review, n.48 (October), p.1047–74, 2004.
BAI, J.; KAO, C. On the estimation and inference of a panel co-integration method with cross-sectional dependence. In: BALTAGI, B. H. (Ed.). Panel data econometrics: theoretical contributions and empirical applications. Elsevier Science & Technology, 2006.
BARRO, R. J. Are government bonds net wealth?Journal of Political Economy, v.82, n.6, p.1095-1117, 1974.
BECK, N. Time series cross section methods. New York University, NY, USA. Draft of June 5, 2006. BECK, N.; KATZ, J. What to do (and not to do) with Time-Series Cross-Section Data. The
American Political Science Review. v.89, n.3 (Sep.), p. 634-647, 1995.
CALLEGARI, G.; MELINA, G.; e BAITINI, N. Successful austerity in the United States, Eu-rope and Japan. IMF Working Papers 12/190, International Monetary Fund, July, 2012. CROTTY, J. The great austerity war: what caused the US defi cit crisis and who should pay
to it?Cambridge Journal of Economics, n. 36, p.79-104, 2012.
DE PAULA, L. F. R. Liquidez e zeragem automática: crítica da crítica. Est. Econ. São Paulo, v.26, n.3, p. 411-439, 1996.
EASTERLY, W. R. Growth implosions and debt explosions: Do growth slowdowns cause public debt crises? Contributions to Macroeconomics. WB. v.1, issue 1. Article 1, 2001. EBERHARDT, M. Panel time-series modeling: New tools for analyzing xt data. In: UK Stata
Users Group meeting. Cass Business School, London. 16th September, 2011. Available at:
<http://sites.google.com/site/medevecon>.
FELDSTEIN, M. The budget and trade defi cits aren’t really twins. NBER Working Paper n. 3966. Cambridge, janeiro, 1992.
FUNDO MONETÁRIO INTERNACIONAL – FMI. Fiscal Monitor: Back to work. How fi scal
policy can help. Washington, DC, 2014.
GIAVAZZI, F.; JAPELLI, T.; PAGANO, M. Searching for non-linear effects of fi scal policy: Evidence from industrial and developing countries. European Economic Review v.44, n.7, p.1259–89, 2000.
GIAVAZZI, F.; PAGANO, M. Can severe fi scal contractions be expansionary? Tales of two
small European countries. NBER Macroeconomics Annual, p.95–122, 1990.
HERNDON, T; ASH, M.; POLLIN, R. Does high public debt consistently stifl e economic growth? A critique of Reinhart and Rogoff. Cambridge Journal of Economics, n.1 of 23. De-cember 24, 2013.
HAMILTON, J. D.; FLAVIN, M. A. On the limitations of government borrowing: a frame-work for empirical testing. The American Economic Review, v.76, n.4, p.808-819, 1986. HOECHLE, D. Robust standard errors for panel regressions with cross–sectional dependence. Basel,
Switzerland: Department of Finance. University of Basel, 2007.
HURLIN, C. Testing for Granger Causality in heterogeneous panels. Mimeo. Department of Eco-nomics: University of Orleans, 2008.
ILZETZKI, E.; MENDOZA, H. G.; VÉGH, C. A. How big (small?) are fi scal multipliers? Jour-nal of Monetary Economics, n.60, p.239–254, 2013.
ILZETZKI, E.; VÉGH, C.A. Procyclical Fiscal Policy in Developing Countries: Truth or Fic-tion?NBER Working Paper 14191, 2008.
IRONS, J.; BIVENS, J. Government debt and economic growth: Overreaching claims fof debt “Threshold” Suffer from theorical and empirical Flaws. Economic Policy Institute (EPI) Brief-ing Paper, n. 271. 26, July, 2010.
KAMINSKY, G.; REINHART, C. M.; VÉGH, C. A. When it rains it pours: pro-cyclical capital fl ows and macroeconomic policies. In: GERTLER, M.; ROGOFF, K. S. (Eds.). NBER Macro-economics Annual 2004, National Bureau of Economic Research, p.11–82, 2004.
KAR, M.; NAZLIOGLU, S.; AGIR, H. Financial development and economic growth nexus in the MENA countries: Bootstrap panel granger causality analysis. Economic Modelling, n.28, p.685-693, 2011.
KEYNES, J. M. A teoria geral do emprego, do juro e da moeda. São Paulo: Nova Cultural, 1996. KÓNYA, L. Exports and growth: Granger causality analysis on OECD countries with a panel
OECD and implications for the EMU. Contributions to Macroeconomics, v.5, n.1, art. 11, 2005. Available at: <http://www.bepress.com/bejm/contributions/ vol5/iss1/art11>. MADDALA, G.; WU, S. A comparative study of Unit Root Tests and a New Simple Test.
Oxford Bulletin of Economics and Statistics, v.61, n.1, p.631-652, 1999.
MAURO, P.; ROMEU, R.; BINDER, A; ZAMAN, A. A modern history of fi scal prudence and prof-ligacy. International Monetary Fund. January, 2013.
McCAUSLAND, W. D; THEODOSSIOU, I. The consequences of fi scal stimulus on public debt: A historical perspective. Department of Economics and Centre for European Labour Mar-ket Research. Prime, October, 2014.
McDERMOT, J.; WESCOTT, R. An empirical analysis of fi scal adjustments. IMF Staff Papers 43 no. 4, p.723–53, 1996.
MINSKY, H. Can it happen again? Essays on instability & fi nance. Armonk, New York: Sharpe, 1982, 301p.
MOREIRA, A.; ROCHA, K. A política fi scal e as taxas de juros domésticas nos países emer-gentes. Texto para Discussão. IPEA, Novembro, 2009.
OSTRY, J. D; ATISH, R. G.; ESPINOSA, R. When should public debt be reduced?IMF Staff Discussion Note 15/10. Washington: International Monetary Fund, 2015.
OSTRY, J.D; LONGANI, P..; FURCERI, D. Neoliberalism: Oversold? Finance and
Develop-ment, June, 2016.
PANIZZA, U.; PRESBITERO, A. F. Public debt and economic growth in advanced economies: A survey. Swiss Journal of Economics and Statistics, forthcoming, 2013.
PANIZZA, U.; PRESBITERO, A. F. Is high public debt harmful for economic growth?VoxEU. org, 22, April, 2012a.
PANIZZA, U.; PRESBITERO, A. F. Public debt and economic growth: Is there a causal effect? MoFiR Working Paper n. 65. Ancona, Italy: Money and Finance Research Group. 2 April, 2012b.
PARKS, R. Effi cient estimation of a system of regression equations when disturbances are both serially and contemporaneously correlated. Journal of the American Statistical Associa-tion, n.62, p.500–509, 1967.
PATILLO, C.; POIRSON, H.; RICCI, L. What are the channels through which external debt affects the growth. IMF Working Paper. n. 15, January, 2004.
PEDRONI, P. Critical values for co-integrating tests in heterogeneous panels with multiple regressors. Oxford Bulletin of Economics and Statistics, v.61, n.1, p.653- 670, 1999.
PESARAN, M. A simple panel unit root test in the presence of cross section dependence. Journal of Applied Econometrics, v.22, n.2, p.265-312, 2007.
PESARAN, M. General Diagnostic Tests for Cross Section Dependence in Panels. Cambridge Working Papers in Economics No. 0435. Faculty of Economics, University of Cambridge, 2004. PHILLIPS, P. C. B. Fully modifi ed least squares and vector auto-regression. Working Paper n.
905. Cowles Foundation for Research in Economics. Yale University, 1995.
REINHART, C. M.; ROGOFF, K. S. Reinhart-Rogoff Response to Critique. The Wall Street Journal, 16 April, 2013.
REINHART, C. M.; ROGOFF, K. S. Debt and Growth Revisited. VoxEU.org, v.11, August,
2010a.
REINHART, C. M.; ROGOFF, K. S. Growth in a Time of Debt. National Bureau of Economic Research WP 15639. Cambridge, MA. Janeiro, 2010b.
REINHART, C. M.; ROGOFF, K. S. Growth in a time of debt. American Economic Review: Pa-pers and Proceedings, v.100, n.2, p.573-578, May, 2010c.
REINHART, C. M.; ROGOFF, K. S. This Time is Different: Eight Centuries of Financial Folly. Princeton, NJ: Princeton University Press. October, 2009.
REINHART, C. M.; ROGOFF, K. S.; SAVASTANO, M. A. Debt intolerance. Booking Papers on Economic Activity, Spring, p.1-74. August, 2003.
RESENDE, M. F. C. Défi cits gêmeos e poupança nacional: abordagem teórica. Rev. Econ. Polit. [online], v.29, n.1, p.24-42, 2009.
RIGOBON, R. Identifi cation through heteroskedasticity. Sloan School of Management, MIT and NBER. June, 2002.
ROSENSWEIG, J. A.; TALLMAN, E. W. Fiscal policy and trade adjustment: are the defi cits really twins?Economic Inquiry, v. 31, October, 1993.
TAYLOR, L.; PROAÑO, C. R.; CARVALHO, L.; BARBOSA, N. Fiscal defi cits, economic growth and government debt in the USA. Cambridge Journal of Economics, v.36, p.189-204, 2012.
VAMVOUKAS, G. A. The twin defi cits phenomenon: evidence from Greece. Applied Econom-ics, v.31, 1999.
WESTERLUND, J. Estimating co-integrated panels with common factors and the forward rate unbiasedness hypothesis. Journal of Financial Econometrics, v.5, n.3, p.491-522, 2007. WOOLDRIDGE, J. Econometric Analysis of Cross Section and Panel Data. Cambridge, MA: MIT
Press, 2002.
ZELLNER, A. An effi cient method of estimating seemingly unrelated regressions and tests of aggregation bias. Journal of the American Statistical Association, v.57, p.348-368, 1962.
About the authors
Paulo André Camuri - [email protected]
Doutor em Economia pelo CEDEPLAR - Universidade Federal de Minas Gerais.
Frederico G. Jayme Jr. - [email protected]
Professor do Cedeplar- Universidade Federal de Minas Gerais.
Ana Maria Hermeto - [email protected]
Professora do Cedeplar- Universidade Federal de Minas Gerais.
About the article
Annexes
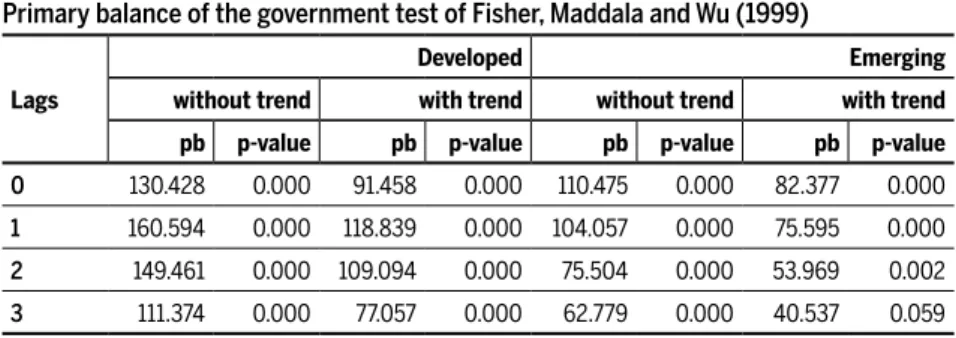
Table A1 Tests of stationarity in panel:
Primary balance of the government test of Fisher, Maddala and Wu (1999)
Lags
Developed Emerging
without trend with trend without trend with trend
pb p-value pb p-value pb p-value pb p-value
0 130.428 0.000 91.458 0.000 110.475 0.000 82.377 0.000
1 160.594 0.000 118.839 0.000 104.057 0.000 75.595 0.000
2 149.461 0.000 109.094 0.000 75.504 0.000 53.969 0.002
3 111.374 0.000 77.057 0.000 62.779 0.000 40.537 0.059
For Maddala and Wu (1999) the statistic chi-square associated with the Test of Fisher and the p-value is shown. The null hypothesis is that the series are non-stationary.
The deterministic elements and the lags are related to the Dickey Fuller regressions.
The “multipurt” routine was used from Markus Eberhardt, covering the “xtfi sher” and “pescadf” routines and written, respectively, by Scott Merryman and Piotr Lewandowski.
Results at 5% signifi cance.
Table A2 Tests of stationarity in panel:
Primary balance of the government test of Pesaran (2007)
Lags
Developed Emerging
without trend with trend without trend with trend
pb p-value pb p-value pb p-value pb p-value
0 -6.406 0.000 -5.740 0.000 -6.477 0.000 -5.453 0.000
1 -5.978 0.000 -5.113 0.000 -5.493 0.000 -4.091 0.000
2 -5.299 0.000 -4.469 0.000 -3.972 0.000 -2.846 0.000
3 -4.297 0.000 -3.210 0.001 -2.898 0.000 -1.451 0.000
For Pesaran (2007) the statistics Zt-bar and the corresponding p-value are reported. The null hypothesis is that the series is non-stationary.
The deterministic elements and the lags are related to the Dickey Fuller regressions.
The routine “multipurt” from Markus Eberhardt was used, covering the routines “xtfi sher” and “pescadf” written, respectively, by Scott Merryman and Piotr Lewandowski.
Table A3 Tests of co-integration in panel:
pbfm and drgdp – Tests of Westerlund (2007) and Pedroni (1999)
Test of Westerlund, 2007 - Developed
Statistics value z-value p-value robust p-value*
Gt -4.934 -14.355 0,0000 0,0000 0,0000
Ga -45.667 -22.704 0,0000 0,0000 0,0000
Pt -20.454 -12.819 0,0000 0,0000 0,0000
Pa -40.810 -23.850 0,0000 0,0000 0,0000
Test of Pedroni, 1999
Statistics Developed Emerging
Panel Group Panel Group
with time dummie
s
v 5,50 3,73
rho -28,45 -23,48 -22,70 -17,32
t -25,69 -27,07 -20,74 -20,86
adf -23,95 -24,62 -20,16 -20,05
n 1290 801
Variable Beta t Beta t
debtgdp 0,0696 1,9180 0,0434 0,2307
n 1190 717
Statistics Panel Group Panel Group
with no time dummie
s
v 8,13 7,63
rho -27,36 -24,78 -24,50 -20,23
t -17,73 -20,60 -15,34 -16,63
adf -11,52 -10,99 -11,24 -10,41
n 1290 801
Variável Beta t Beta t
debtgdp 0,1638 -27,35 0,1046 -11,92
n 1230 751
Ho: there is no co-integration in both tests. In Westerlund, average lag and lead of, respectively, 2.35 and 1.05, both selected by criterion AIC.
Table A4 Test of cross-section dependence:
Primary balance of the government Test of Pesaran (2004)
Variable Test CD p-value corr abs(corr)
Developed 30,10 0,000 0,273 0,316
Emerging 9,29 0,000 0,135 0,192
Ho: Cross-section independence. Results at 5% signifi cance.
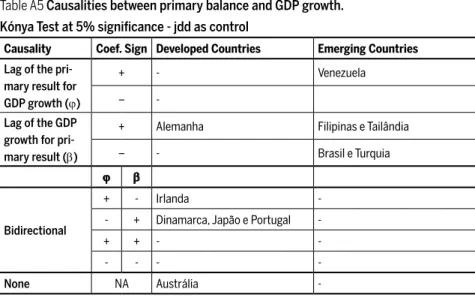
Table A5 Causalities between primary balance and GDP growth. Kónya Test at 5% signifi cance - jdd as control
Causality Coef. Sign Developed Countries Emerging Countries
Lag of the pri-mary result for GDP growth (ϕ)
+ - Venezuela
–
-Lag of the GDP growth for pri-mary result (β)
+ Alemanha Filipinas e Tailândia
– - Brasil e Turquia
ϕ β
Bidirectional
+ - Irlanda
-- + Dinamarca, Japão e Portugal
-+ + -
-- - -
-None NA Austrália
-Causality Test for the Primary Balance in direction to the GDP Growth: and the GDP Growth in direction to the Primary Balance:
Data not available in either equations for Ecuador, El Salvador, India, Indonesia, Kenya, Malaysia, Ni-geria, Peru, Singapore, Sri Lanka and Uruguay (emerging countries).
Data is not suffi cient for: Austria, Belgium, Canada, Finland, Greece, Italy, Netherlands, New Zealand, Norway, Spain, Sweden and England (developed countries); and Bolivia, Colombia, Chile, Costa Rica, Ghana, Mexico and South Africa (emerging countries).
Where: * indicates results at 5% signifi cance.
, 1 1
N t t t
Y Y X
, 1 1
N t t t
Table A6 Robust standard-errors to the correlation and heteroscedasticity:
Impact of the primary balance in the GDP growth (with interest rate as a control variable)
Panel Variable FGLS (2) FGLS (3) FGLS (4)
Coef. Estat. z p >|z| Coef. Estat. z p >|z| Coef. Estat. z p >|z|
D
ev
eloped - cont
empo-rar
y r
elationship
pbfm 0,0934 5,08 0,000* 0,1275 5,14 0,000* 0,1104 4,16 0,000*
jdd -0,0536 -2,8 0.005* -0,0627 -2,39 0.017* -0,0754 -2,67 0,008
trend -0,0482 -10,24 0,000* -0,0496 -7,14 0,000* -0,0528 -7,41 0,000*
constant 4,9143 20,51 0,000* 5,0171 14,43 0,000* 5,1704 14,46 0,000*
Wald chi2 127,61 77,05 71,06
Prob>chi2 0,000 0,000 0,000
D
ev
eloped -
relation 1 period ahead
lagpbfm 0,0052 0,28 0,778 -0,044 -1,770 0,076 -0,058 -2,230 0.026*
jdd -0,0665 -3,46 0.001* -0,086 -3,280 0.001* -0,084 -2,980 0.003*
trend -0,0471 -9,87 0,000* -0,047 -6,630 0,000* -0,050 -7,030 0,000*
constant 5,0611 21,12 0,000* 5,230 14,970 0,000* 5,339 15,290 0,000*
Wald chi2 103,39 54,730 62,770
0,000 0,000 0,000
E
mer
ging - cont
empo-rar
y r
elationship
pbfm 0,1866 3,75 0,000* 0,1910 3,51 0,000* 0,1272 2,14 0.032*
jdd -0,0006 -2,87 0.004* -0,0005 -2,17 0.03* -0,0005 -2,99 0.003*
trend -0,0271 -2,58 0.01* -0,0254 -1,83 0,068 -0,0113 -0,62 0,538
constant 4,7973 10,10 0,000* 4,736 7,49 0,000* 4,1994 4,87 0,000*
Wald chi2 23,00 16,97 13,00
Prob>chi2 0,000 0,001 0,005
E
mer
ging -
relation 1 period ahead
lagpbfm 0,1562 3,21 0.001* 0,1181 2,17 0.03* 0,1196 1,95 0,051
jdd -0,0005 -2,64 0.008* -0,0004 -1,89 0,058 -0,0005 -2,85 0.004*
trend -0,0262 -2,44 0.015* -0,0230 -1,63 0,104 -0,0127 -0,68 0,496
constant 4,7604 9,82 0,000* 4,6010 7,24 0,000* 4,2519 4,89 0,000*
Wald chi2 19,24 9,65 12,33
Prob>chi2 0,000* 0.0218* 0,063
The estimates use interest rate as a control variable.
FGLS (2) with robust trend and errors to heteroscedasticity between the panels. FGLS (3) with robust trend and errors to heteroscedasticity and autocorrelation (AR 1). FGLS (4) with robust trend and errors to autocorrelation per panel (PSAR1).
The estimates for (20) developed countries have 819 observations and for (13) emerging countries, 511 observations.