OSD
10, 883–921, 2013Hydrodynamic variability based on the multi-parametric POSEIDON Pylos
D. Kassis et al.
Title Page
Abstract Introduction
Conclusions References
Tables Figures
◭ ◮
◭ ◮
Back Close
Full Screen / Esc
Printer-friendly Version
Interactive Discussion
Discussion
P
a
per
|
Di
scussion
P
a
per
|
Discussion
P
a
per
|
Discussi
on
P
a
per
|
Ocean Sci. Discuss., 10, 883–921, 2013 www.ocean-sci-discuss.net/10/883/2013/ doi:10.5194/osd-10-883-2013
© Author(s) 2013. CC Attribution 3.0 License.
Geoscientiic Geoscientiic
Geoscientiic Geoscientiic
Open Access
Ocean Science Discussions
This discussion paper is/has been under review for the journal Ocean Science (OS). Please refer to the corresponding final paper in OS if available.
Hydrodynamic variability based on the
multi-parametric POSEIDON Pylos
observatory of the south Ionian Sea
D. Kassis, K. Nittis, and L. Perivoliotis
Institute of Oceanography, Hellenic Centre for Marine Research, P.O. Box 712, 19013 Anavissos, Greece
Received: 24 April 2013 – Accepted: 2 May 2013 – Published: 13 June 2013 Correspondence to: D. Kassis ([email protected])
OSD
10, 883–921, 2013Hydrodynamic variability based on the multi-parametric POSEIDON Pylos
D. Kassis et al.
Title Page
Abstract Introduction
Conclusions References
Tables Figures
◭ ◮
◭ ◮
Back Close
Full Screen / Esc
Printer-friendly Version
Interactive Discussion
Discussion
P
a
per
|
Di
scussion
P
a
per
|
Discussion
P
a
per
|
Discussi
on
P
a
per
|
Abstract
The multi-platform POSEIDON-Pylos observatory of the south-east Ionian Sea oper-ates since 2007 delivering near real time data for a variety of meteorological, water col-umn and near seabed oceanographic parameters. It has been designed to contribute to long term monitoring of air–sea interaction and thermohaline processes of this key 5
area of the Eastern Mediterranean where water masses of different origin interact and transform at various temporal and spatial scales. An inductive mooring line, with CTD instruments adjusted on, provides salinity, temperature and pressure real-time data down to 500 m depth. Recorded data, for the years 2008–2010, were extracted from the instruments internal logger providing more enhanced timeseries in terms of resolu-10
tion and continuity. The reprocessed datasets are analyzed in combination with atmo-spheric, currents buoy measurements and CTD profiles obtained during maintenance visits on the site. The delayed mode analysis shows the hydrodynamic properties of the area and reveals the dynamic picture of the south Ionian upper thermocline as well as the variation of T & S in deeper layers. One can also observe seasonal atmospheric 15
and circulation patterns, other synoptic and seasonal scale signals as well as important inter-annual variability such as a strong signal of Levantine Intermediate Waters (LIW) at intermediate depths during the spring of 2009.
1 Introduction
In the framework of the national buoy program of Greece, HCMR has been operating 20
for the last 13 yr a network of observing platforms in the Aegean and Ionian Seas. The POSEIDON program has been implemented, contributing to the efforts of GOOS and its Mediterranean component MedGOOS and consists of the first integrated Opera-tional Oceanography system in Eastern Mediterranean sea. It is typically composed of three components: (a) the data collection system operating in real time, (b) the data 25
end-OSD
10, 883–921, 2013Hydrodynamic variability based on the multi-parametric POSEIDON Pylos
D. Kassis et al.
Title Page
Abstract Introduction
Conclusions References
Tables Figures
◭ ◮
◭ ◮
Back Close
Full Screen / Esc
Printer-friendly Version
Interactive Discussion
Discussion
P
a
per
|
Di
scussion
P
a
per
|
Discussion
P
a
per
|
Discussi
on
P
a
per
|
users system. The buoy network which constitutes the backbone of the system has been upgraded through POSEIDON II project (2005–2008). During that period the op-erational oceanographic team of HCMR implemented major upgrades to the monitor-ing and forecastmonitor-ing infrastructure of the POSEIDON system (www.poseidon.hcmr.gr). These upgrades included the development of two new multi-parametric observatories 5
in the southern Aegean (E1-M3A) and the south-east Ionian Seas (Pylos). These two stations have become a part of EuroSITES network of open sea multi-sensor moored arrays which operate at European level and contribute to OcenaSITES global network of open sea Eulerian observatories. The POSEIDON-Pylos station that started to op-erate in February 2007 consists of a surface buoy that hosts the meteorological and 10
surface oceanographic sensors, and an inductive mooring line capable of hosting CTD sensors down to 1000 m depth. Furthermore, an autonomous seabed platform, that delivers data using underwater acoustic technology, was also deployed during 2008 to monitor deep sea (1670 m) temperature, salinity and dissolved oxygen data as well as high frequency pressure measurements for tsunami detection. With the sea-bed 15
platform, the Pylos station became the first Mediterranean open-sea tsunami detection system that can contribute to an integrated warning system for the basin.
The Ionian Sea is characterized by complex hydrology where different water masses meet and interact. The interaction between water masses of western and northern ori-gin (Western Mediterranean and Adriatic Seas) and water masses formed in Aegean 20
and Levantine Seas creates a transitional area which affects the circulation and bal-ance of the wider region in both seasonal and inter annual timescales. The basin’s wa-ter mass-structure of this area includes: the Modified Atlantic Wawa-ters (MAW) which are occupying the upper 25–100 m of the water column and are characterized by a salinity minimum, the Levantine Intermediate Waters (LIW) that occupy typically the 100–500 m 25
produc-OSD
10, 883–921, 2013Hydrodynamic variability based on the multi-parametric POSEIDON Pylos
D. Kassis et al.
Title Page
Abstract Introduction
Conclusions References
Tables Figures
◭ ◮
◭ ◮
Back Close
Full Screen / Esc
Printer-friendly Version
Interactive Discussion
Discussion
P
a
per
|
Di
scussion
P
a
per
|
Discussion
P
a
per
|
Discussi
on
P
a
per
|
tion of dense water in the Aegean Sea further complicated this structure (Theocharis et al., 1999). The older EMDW of Adriatic origin, occupying the Ionian Sea basin, were lifted into the transitional layers from the newly formed warm and saline Aegean or Cre-tan Deep Water (CDW) which occupied deep layers. In addition, the intermediate water masses were occupied by Cretan Intermediate Waters (CIW) with characteristics simi-5
lar to LIW (Malanotte-Rizzoli et al., 1999). The origin of the EMT has been attributed to both regional meteorological anomalies (cold winters, reduced precipitation) and long-term salinity changes in the region, related to climatic variability and anthropogenic activities. This major change of the thermohaline circulation in the Mediterranean Sea has demonstrated the vulnerability of the basin to external forcing, reaffirming the re-10
gion as a perfect laboratory for studies of ocean dynamics, including climate variability effects.
Located approximately 10 miles off the west coast of the southern Peloponnese at the south-east Ionian Sea, the observatory’s location is ideal for studies of the East Mediterranean Sea thermohaline circulation and its variability attributed to regional or 15
larger scale forcing and climate change. Temperature and salinity time-series from sev-eral depths exhibit a complex picture of this transitional area characterized by complex hydrology. Furthermore, it is a very geologically active area with lots of earthquakes and landslides as well as a potential source of Tsunamis that might affect the Eastern Mediterranean Sea.
20
2 System description
2.1 Architecture and configuration
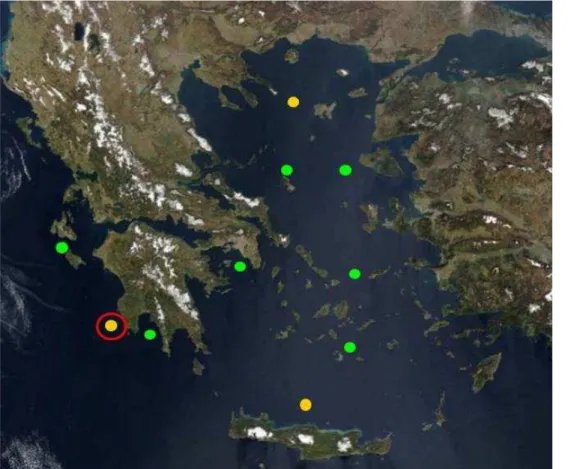
Pylos observatory is a part of POSEIDON buoy network that consists of 10 oceano-graphic mooring sites monitoring in the Aegean and Ionian Seas (Fig. 1).
It combines a multi-parametric surface buoy with an inductive mooring cable and 25
OSD
10, 883–921, 2013Hydrodynamic variability based on the multi-parametric POSEIDON Pylos
D. Kassis et al.
Title Page
Abstract Introduction
Conclusions References
Tables Figures
◭ ◮
◭ ◮
Back Close
Full Screen / Esc
Printer-friendly Version
Interactive Discussion
Discussion
P
a
per
|
Di
scussion
P
a
per
|
Discussion
P
a
per
|
Discussi
on
P
a
per
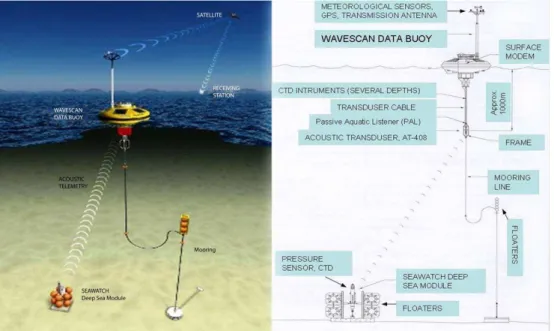
|
type which is a platform suitable for deployment in deep offshore locations and can host a large number of sensors and different telecommunication systems. The acous-tic communication system between the seabed platform and the surface buoy enables real-time data transmission from the sea bottom (Fig. 2). Every 3 h the data is collected and transmitted through a dual GSM/GPRS and INMARSAT-C satellite system to the 5
receiving station in HCMR. A bi-directional communication real-time link for low level debugging and possible reconfiguration of the buoy is a significant advantage. In the case of the backup system (INMARSAT-C) the frequency spectrum of the wave mea-surements is not transmitted (size limitation). The actual data collected by the station are saved locally inside a flash memory of the buoy’s CPU prior to transmission and re-10
main there to be downloaded usually on every maintenance survey. Additionally, most sensors used on this site are configured to store the measured data in the internal memory so that if the acquisition system or the cable connecting the sensor to the acquisition system fails, the data can be recovered during the maintenance missions when the sensors are recovered. The data is stored in a binary encoded format to opti-15
mize for size. The transmitted data are collected at the POSEIDON operational center where automatic near real time quality control processes are applied on a daily basis.
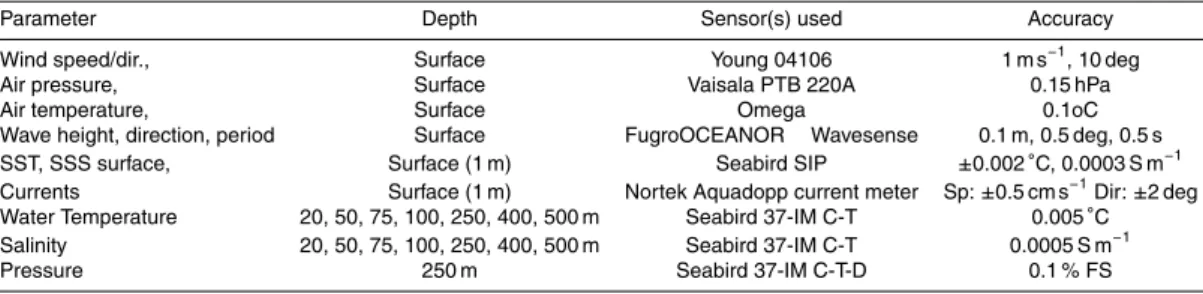
The observatory integrates a variety of sensors for monitoring atmospheric and oceanographic parameters as shown in the table below (Table 1).
2.2 Seabed component – Passive Aquatic Listener (PAL)
20
The SDSM (Seawatch Deep Sea Module) observatory lies on the seabed below the surface buoy at approximately 1700 m depth. It is especially designed for tsunami surveillance and is equipped with a high-resolution pressure sensor that measures the sea level every 15 s. Internal processing applies the DART algorithm (Gonzalez et al., 1998) to identify a tsunami event based on user defined thresholds. When such 25
OSD
10, 883–921, 2013Hydrodynamic variability based on the multi-parametric POSEIDON Pylos
D. Kassis et al.
Title Page
Abstract Introduction
Conclusions References
Tables Figures
◭ ◮
◭ ◮
Back Close
Full Screen / Esc
Printer-friendly Version
Interactive Discussion
Discussion
P
a
per
|
Di
scussion
P
a
per
|
Discussion
P
a
per
|
Discussi
on
P
a
per
|
dissolved oxygen and sea level every 3 h. These data are also stored on the internal memory of the platform along with the high frequency pressure time series that can be uploaded when the platform is recovered. The SDSM is powered through an on board battery pack and it can remain operational for over 2 yr. The platform is recovered by activating a releaser.
5
The Pylos observatory has also been used as a test-bed for new generation acous-tic sensors. A Passive Aquaacous-tic Listener (PAL) consists of a high sensitivity microphone capable of recording the ambient sound field in the ocean. With a frequency range from 1 to 50 kHz, this sensor records sound signals deriving from wind, rain, storms, ships and mammals and allows the analysis, interpretation and quantification of these 10
procedures. This information is a combination of natural and manmade sounds and re-veals geo-physical, biological and anthropogenic processes in the ocean (Amitai et al., 2008). PAL has been tested at 500 m depth in a real-time transmission mode using an inductive modem and the existing inductive mooring cable of the platform.
3 Data processing
15
3.1 Acquire data – quality control procedures
The POSEIDON operational centre collects the transmitted data where automatic near real time quality control checks are applied upon the timeseries on a daily basis. This analysis has been established during the previous European projects MFSTEP, MERSEA and is performed before data is archived and released as standard qual-20
ity controlled daily products. This quality control process is an integral and important part of the operational process. Its significance derives from the fact that ocean data measurements are sparse and often present a variety of dubious and false values. Bio-fouling, sensor failures, anchoring and transmission problems are among the common causes of corrupted data. In terms of operational activities, this analysis must be held 25
OSD
10, 883–921, 2013Hydrodynamic variability based on the multi-parametric POSEIDON Pylos
D. Kassis et al.
Title Page
Abstract Introduction
Conclusions References
Tables Figures
◭ ◮
◭ ◮
Back Close
Full Screen / Esc
Printer-friendly Version
Interactive Discussion
Discussion
P
a
per
|
Di
scussion
P
a
per
|
Discussion
P
a
per
|
Discussi
on
P
a
per
|
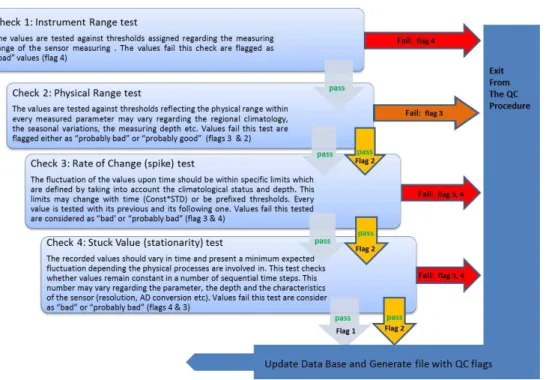
a date/hour confirmation check is applied to ensure no corruption has occurred, then several tests and specific flags are attributed to data which fail or pass these numer-ical checks. These tests are based on some pre-assigned principles. Firstly, values must vary between certain bounds which are determined by the instrument measure range and the regional climatology. Furthermore, values may vary with a maximum 5
rate of change (within a specific timeframe) and that has to do mainly with the thresh-old applied upon each measured parameter. To check the correct functioning of sen-sors over time, data has to pass the stationarity test that shows whether values are stuck and recur in continuant measurements. It is obvious that, in order to apply the appropriate flags to each value, a combined knowledge is needed about the physical 10
processes, technical details such as analog to digital conversions, transmission meth-ods etc (Fig. 3).
Two types of daily files are produced, ASCII (Medatlas) and Binary (NetCDF), in or-der to contribute to the integration of data streams inside International and European projects (OceanSITES, SEPRISE, MyOcean etc.). Finally data are stored in the PO-15
SEIDON information system using a normalized MySQL database. Its design supports our demand for quick search and reliable results on the parameter values and their metadata. The table, that contains the data information, associates them with their metadata and a flag, which shows if the parameter has passed through a quality con-trol process and serves quality checking purposes (Kassis et al., 2008). After the first 20
level of the data quality assurance, a delayed mode visual inspection of the data is also performed on a regular basis inherent with the maintenance of the sensors that takes place after every new deployment.
3.2 Water column timeseries
In this analysis, all temperature and salinity data presented are extracted from instru-25
OSD
10, 883–921, 2013Hydrodynamic variability based on the multi-parametric POSEIDON Pylos
D. Kassis et al.
Title Page
Abstract Introduction
Conclusions References
Tables Figures
◭ ◮
◭ ◮
Back Close
Full Screen / Esc
Printer-friendly Version
Interactive Discussion
Discussion
P
a
per
|
Di
scussion
P
a
per
|
Discussion
P
a
per
|
Discussi
on
P
a
per
|
a delayed mode quality check. The recovered sensors after each maintenance mis-sion are checked in the laboratory of HCMR and raw data are extracted. On a regular basis a calibration process upon a set of sensors is taking place in the laboratories of HCMR’s department in Crete. Three years (2008–2010) of temperature and salinity data from 8 SBE-37 CTD instruments are presented here. The sensors were mounted 5
on the mooring line at several depths (1, 20, 50, 75, 100, 250, 400 and 500 m). A de-layed mode data re-processing was performed including dede-layed mode data quality control. Potential temperature and density were calculated and data were filtered in or-der to remove daily variability. A low-pass 4th oror-der Butterworth digital filter was used with a cut offfrequency of 1/40 of half the sample rate (3 h). The transfer function form 10
is obtained through a Matlab script by calculating the filter coefficients in length 5 row vectorsbanda, with coefficients in descending powers ofx(Eq. 1):
H(x)=b(1)+b(2)x
−1
+b(3)x−2+b(4)x−3+b(5)x−4
1+a(2)x−1+a(3)x−2+a(4)x−3+a(5)x−4 (1)
4 Results and discussion
4.1 Atmospheric forcing – surface currents
15
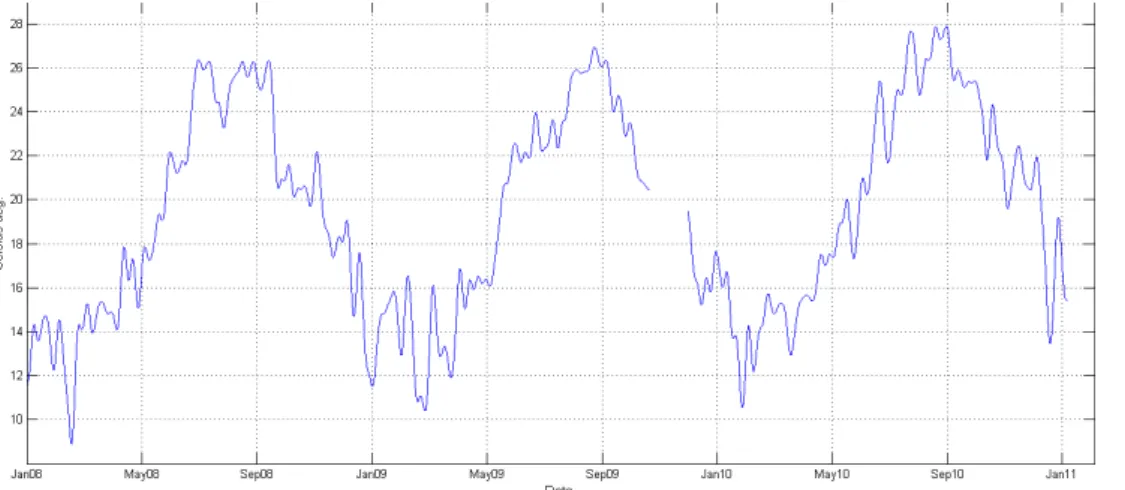
Air temperature variation for the 3 yr period presents the seasonal cycle with the low temperatures during winter period (9–18◦C) and high during summer (20–30◦C). Two transition periods are characterized by a gradual temperature drop (September– December) and rise (April–July) associated with the solar flux decrease and increase respectively (Fig. 4). The summer period of 2009 presents lower average temperature 20
OSD
10, 883–921, 2013Hydrodynamic variability based on the multi-parametric POSEIDON Pylos
D. Kassis et al.
Title Page
Abstract Introduction
Conclusions References
Tables Figures
◭ ◮
◭ ◮
Back Close
Full Screen / Esc
Printer-friendly Version
Interactive Discussion
Discussion
P
a
per
|
Di
scussion
P
a
per
|
Discussion
P
a
per
|
Discussi
on
P
a
per
|
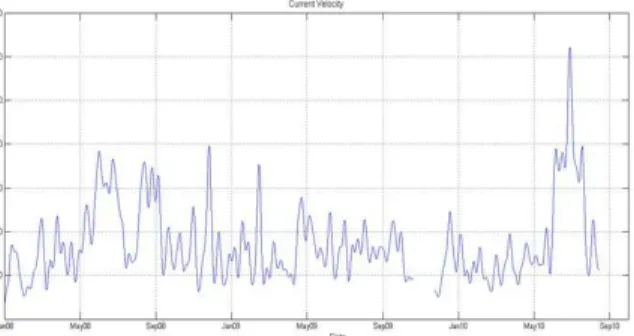
The wind field is characterized by an intense variability regarding wind velocity with values ranging from 2 to 9 m s−1and the prevailing winds are of north-west origin with a secondary distribution of a south-east component. The year 2010 presents a higher wind forcing and variability while during 2008 lower winds are dominating (Fig. 5). The sea surface circulation shows a larger distribution regarding direction. A dominant cir-5
culation pattern composed of southern and south-eastern currents with a secondary northern flow shows a significant affection of the local wind forcing. During 2009 current flow appears less energetic, especially during summer period in contradistinction with 2008 and 2010 (Fig. 6).
All direction data expressions are based on the meteorological circle (with north de-10
noted as zero). Wind values denote the origin (i.e. zero degrees refer to wind/wave originating from the north) while the current values denote the destination (zero de-grees refer to a flow that is moving northwards).
Current speed varies between 5 to 40 cm s−1
with an energy peak during summer of 2010 when reached velocities over 60 cm s−1. This was a northward flow associated 15
with the prevailing northern, north-western winds of that period as shown on the follow-ing feather diagrams (Figs. 7 and 8). An important thermohaline circulation is traced as a strong north-eastern current flow component (end of June–middle July) coexists with the prevailing northern winds of that period. However when northern winds get stronger (late June, July and August) this pattern is destroyed.
20
4.2 Hydrodynamic measurements of the water column
Temperature and salinity timeseries recorded at pre-assigned depths by CTD instru-mentation adjusted on the mooring line are presented after being checked and filtered with the procedures described previously. Furthermore CTD casting profiles were per-formed regularly during every maintenance mission with R/V AEGEO using a SBE 25
OSD
10, 883–921, 2013Hydrodynamic variability based on the multi-parametric POSEIDON Pylos
D. Kassis et al.
Title Page
Abstract Introduction
Conclusions References
Tables Figures
◭ ◮
◭ ◮
Back Close
Full Screen / Esc
Printer-friendly Version
Interactive Discussion
Discussion
P
a
per
|
Di
scussion
P
a
per
|
Discussion
P
a
per
|
Discussi
on
P
a
per
|
with the associated contour plots are presented. Short and long term variability of the surface and intermediate layers reveals the important changes on basic physical prop-erties in this transitional area. Two different water zones are studied separately as the surface layers (1–100 m) are characterized by abrupt changes and show intense strat-ification, whilst at intermediate depths (250–500 m) slower processes are dominating. 5
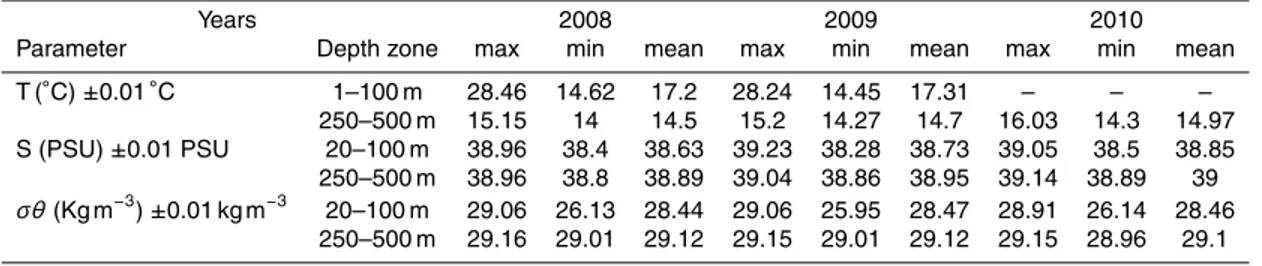
The table below (Table 2) shows indicative values regarding the range ofT,Sandσθ raw datasets for every year in each depth zone. Density fields present minor changes in terms of range and mean values in both depth zones. Nevertheless important dif-ferences appear to exist in the temperature and salinity records reflecting possible features and processes on an inter-annual timescale.
10
The distribution of the physical water properties (T, S) along time is presented on the next figure (Fig. 13) for each measured depth. As expected, subsurface layers are widely dispersed reflecting seasonal changes in the temperature and salinity fields. These changes are triggered not only by seasonal heating and cooling, but also from important thermohaline subsurface circulation, as the wide range of salinity field values 15
at these depths militates. A salinity increase after the second half of 2009 at interme-diate depths is also traced. This cause a significant density variation at a depth zone between 100 and 250 m as these layers cross theσθ isolines (28.5–29 Kg m−3). The T-S diagram derived from CTD casts on the site reveals the introduction of new water masses at the same period associated with the increased salinity values of the inter-20
mediate depths (Figs. 14 and 18). The contribution of deep water layers (>500 m) on the density field can also be derived by comparing timeseries and CTD castingT-S di-agrams. As shown, potential density does not exceed 1029.1 kg m−3at the first 500 m
(Fig. 13) while the less saline, cooler water underneathσθ isopycne of 29 (Fig. 14) is mainly deeper water layers (500–1600 m).
25
4.3 Upper depthsT&Sobservations
OSD
10, 883–921, 2013Hydrodynamic variability based on the multi-parametric POSEIDON Pylos
D. Kassis et al.
Title Page
Abstract Introduction
Conclusions References
Tables Figures
◭ ◮
◭ ◮
Back Close
Full Screen / Esc
Printer-friendly Version
Interactive Discussion
Discussion
P
a
per
|
Di
scussion
P
a
per
|
Discussion
P
a
per
|
Discussi
on
P
a
per
|
to deeper layers (50–100 m) during the late autumn and early winter period when the seasonal thermocline is gradually destroyed. This mechanism driven by cooling and mixing, causes inertial oscillations propagated sequentially in deeper layers as the isotherms increasingly converge (Figs. 9, 10). The rate of temperature difference over time shows this gradual deconstruction of stratification (Fig. 15) and the forming of 5
a well-mixed layer during January–May period which is also reflected in the density’s field. Although this pattern seems to have a seasonal variability, during 2009 a well-mixed subsurface layer is observed which is destroyed with an abrupt heating of the 20 m layer at the start of August. This is also shown in the salinity timeseries where a maximum subsurface (20–50 m) salinity signal appears during August–September 10
of 2009 associated with increased temperature, interrupting the presence of MAW (Fig. 12). The Density field is presenting an increase at 75–100 m associated with the higher salinities appearing that period. A less stratified density field is shown during the first semester of 2010 with surface and subsurface waters reaching the 250 m depth layer with values ranging from 28.45 kg m−3to 28.9 kg m−3.
15
An inter-annual positive trend can also be observed regarding the layers between 50–100 m leading to temperature and salinity differences of almost 1◦C and more than
0.1 PSU respectively between the summers of 2008 and 2010 (Figs. 16, 17). This trend, as much as the subsurface salinity maximum of 2009, is also observed on the salinity profile graphs derived from the regular station maintenance CTD castings (Fig. 18). 20
4.4 Intermediate depthsT&Sobservations
The stratification of the intermediate layers during 2008 is destroyed with an intense variability and mixing during spring and summer of 2009. New water masses are intro-duced with more homogenous characteristics and seem to dominate during 2010 be-tween intermediate depths of 250–500 m. That strong high salinity signal is introduced 25
OSD
10, 883–921, 2013Hydrodynamic variability based on the multi-parametric POSEIDON Pylos
D. Kassis et al.
Title Page
Abstract Introduction
Conclusions References
Tables Figures
◭ ◮
◭ ◮
Back Close
Full Screen / Esc
Printer-friendly Version
Interactive Discussion
Discussion
P
a
per
|
Di
scussion
P
a
per
|
Discussion
P
a
per
|
Discussi
on
P
a
per
|
2008, March 2009, November 2009 and July 2010 profile records (Fig. 18). The July 2010 profile shows increased salinity values (>38.9) inside an extended depth zone that reaches subsurface layers at a maximum of 300 m, where salinity exceeds 39.12 PSU. The low salinity subsurface layer signal, related to Atlantic Water (AW) during the end of 2008 which is replaced with higher salinity values later on, is also observed from 5
casts of November 2008, November 2009 and July 2010.
Finally, a positive trend of both T&S at surface layers is also indicated, leading to more warm and saline waters during 2010 compared to 2008. Gradually this mass seems to move upwards giving a strong signal especially at the 250 m layer which show 1◦C and 0.2 PSU higher temperature and salinity values at the end of 2010 and 10
forms a new stratification during the same year as it dissected from the underlying layers (Figs. 19, 20).
5 Conclusions
Multi-sensor fixed point observatories deliver valuable data that apart from operational purposes (assimilation, model validation) can also be used for studies of ocean dynam-15
ics at different scales, especially when consistent long time series are available. The first 3 yr of operation of the POSEIDON-Pylos observatory of the south-east Ionian Sea have delivered meteorological, sea surface and water column physical data that were used for studies of the regional thermohaline circulation. Air temperature presents the expected seasonal cycle with variations along the 3 yr period. This inter annual vari-20
ability affects the upper layers temperature such as the extended cold period during the first semester of 2009 causing a delay on the subsurface water warming and an in-tense surface thermocline. Local wind forcing seems to control sea surface circulation however the multi-scaled circulation pattern with intense spatial and temporal variability shows the presence of a significant thermohaline component. Water column physical 25
OSD
10, 883–921, 2013Hydrodynamic variability based on the multi-parametric POSEIDON Pylos
D. Kassis et al.
Title Page
Abstract Introduction
Conclusions References
Tables Figures
◭ ◮
◭ ◮
Back Close
Full Screen / Esc
Printer-friendly Version
Interactive Discussion
Discussion
P
a
per
|
Di
scussion
P
a
per
|
Discussion
P
a
per
|
Discussi
on
P
a
per
|
affecting both the temperature and salinity fields. The upper-layers temperature time-series demonstrate an intense synoptic and seasonal variability, which is the dominant signal in this area. One can observe the strong seasonal thermocline which is formed at much shallower depths during July and destroyed between September and October due to diminished insolation, water surface cooling and increased surface turbulence 5
which is propagated down to deeper layers. Although the time-series are relatively short, inter-annual variability signals such as a strong signal of LIW are observed at intermediate depths introduced during the spring of 2009 and becoming dominant dur-ing 2010 coverdur-ing the subsurface and intermediate depth area. This temperature and salinity maximum layer has probably been extended into the Ionian Basin by a north-10
ward flow through the Antikithira Strait. High salinity intermediate water branches that are reaching the northern Ionian basin are expected to also affect both the formation processes and the water properties produced in the Adriatic (Theocharis et al., 2002). The salinity minimum of the subsurface water during the second half of 2008 that is re-lated to presence of AW weakens and disappears during 2009 and is replaced by more 15
saline water as a result of the preceding intense mixing with the underlying layers.
Acknowledgements. The POSEIDON I and II projects were funded by the Financial Mechanism
of the European Economic Area and the Hellenic Program of Public Investments.
We would also like to thank all the people of the POSEIDON team (technicians and scientists) who contributed to this effort.
20
References
Amitai, E. and Nystuen, J.: Underwater acoustic measurements of rainfall, in: Precipitation: Advances in Measurement, Estimation and Prediction, edited by: Michaelides, S., Springer, 343–363, 2008.
Astraldi, M., Balopoulos, S., Candela, J., Font, J., Gacic, M., Gasparini, G. P., Manca, B.,
25
OSD
10, 883–921, 2013Hydrodynamic variability based on the multi-parametric POSEIDON Pylos
D. Kassis et al.
Title Page
Abstract Introduction
Conclusions References
Tables Figures
◭ ◮
◭ ◮
Back Close
Full Screen / Esc
Printer-friendly Version
Interactive Discussion
Discussion
P
a
per
|
Di
scussion
P
a
per
|
Discussion
P
a
per
|
Discussi
on
P
a
per
|
Balopoulos, E., Theocharis, A., Kontoyiannis, H., Varnavas, S., Voutsinou-Taliadouri, F., Iona, A., Souvermezoglou, A., Ignatiades, L., Gotsis-Skretas, O., and Pavlidou, A.: Major advances in the oceanography of the southern Aegean Sea – Cretan Straits system (east-ern Mediterranean), Prog. Oceanogr., 44, 109–130, 1999.
Cardin, V., Gacic, M., Nittis, K., Kovacevic, V., and Perini, L.: Sub-inertial variability in the Cretan
5
Sea from the M3A buoy, Ann. Geophys., 21, 89–102, doi:10.5194/angeo-21-89-2003, 2003. Georgopoulos, D., Theocharis, A., and Zodiatis, G.: Intermediate Water formation in the Cretan
Sea (S. Aegean Sea), Oceanol. Acta, 12, 353–359, 1989.
Gertman, I., Pinardi, N., Popov, Y., and Hecht, A.: Aegean Sea water masses during the early stages of the Eastern Mediterranean Climatic Transient (1988–1990), J. Phys. Oceanogr.,
10
36, 1841–1859, 2006.
Gonzalez, F. I., Milburn, H. M., Bernard, E. N., and Newman, J.: Deep-ocean assessment and reporting of tsunamis (DART): brief overview and status report, in: The NTHMP Tsunameter Network 37, Proceedings of the International Workshop on Tsunami Disaster Mitigation, Tokyo, Japan, 118–129, 1998.
15
Kassis, D. and Nittis, K.: Aegean Sea surface circulation dynamics derived from real-time buoy measurements, in: Proccedings of the 5th International Conference on EuroGOOS, Exeter – Met-Office UK, 22–25 May 2008, editet by: Dahlin, H., Bell, M. J., Flemming, N. C., and Petersson, S. E., EuroGOOS Publication no. 28, 2010.
Kassis, D., Hatzikosti, E., Nittis, K., Perivoliotis, L., and Tzimeas, K.: POSEIDON data
man-20
agement and quality control, marine data and information systems, IMDIS 2008, 31 March– 2 April 2008, Athens, Greece, Book of Abstracts, 161, 2008.
Kassis, D., Ballas, D., Nittis, K., Pagonis, P., and Georgopoulos, D.: An integrated ocean ob-serving system in the Ionian Sea., 3rd Conference on Underwater Acoustic Measurements: Technologies and Results, Nafplion, 21–26 June 2009, Book of Abstracts, 144, 2009.
25
Kassis, D., Petihakis, G., Nittis, K., Ballas, D., and Perivoliotis, L.: Operation and data man-agement of the E1M3A integrated ocean observing system, Marine Data and Information Systems, IMDIS 2010, 29–31 March 2010, Paris, France, Book of Abstracts, 26, 2010. Kontoyiannis, H., Theocharis, A., Balopoulos, E., Kioroglou, S., Papadopoulos, V., Collins, M.,
Velegrakis, A. F., and Iona, A.: Water fluxes through the Cretan Arc Straits, Eastern
Mediter-30
ranean Sea: March 1994 to June 1995, Prog. Oceanogr., 44, 511–529, 1999.
OSD
10, 883–921, 2013Hydrodynamic variability based on the multi-parametric POSEIDON Pylos
D. Kassis et al.
Title Page
Abstract Introduction
Conclusions References
Tables Figures
◭ ◮
◭ ◮
Back Close
Full Screen / Esc
Printer-friendly Version
Interactive Discussion
Discussion
P
a
per
|
Di
scussion
P
a
per
|
Discussion
P
a
per
|
Discussi
on
P
a
per
|
circulation in the Mediterranean Basin, Reports in Meteorology and Oceanography, Harvard University no. 40, 1, 314–334, 1992.
Lascaratos, A., Roether, W., Nittis, K., and Klein, B.: Recent changes in deep water formation and spreading in the Mediterranean Sea: a review, Prog. Oceanogr., 44, 5–36, 1999. Maillard, C., Fichaut, M., and MEDAR/MEDATLAS Group: MEDAR-MEDATLAS Protocol (V3)
5
Part I: Exchange format and quality checks for observed profiles, Rap. Int. IFREMER, Brest., TMSI/IDM/SISMER/SIS00-084, 2001.
Malanotte-Rizzoli, P., Manca, B. B., Rivera D’ Alcala, M., Theocharis, A., Bergamasco, A., Bre-gant, D., Budillon, G., Civitarese, G., Georgopoulos, D., Michelato, A., Sansone, E., Scaraz-zato, P., and Souverrmezoglou, E.: A synthesis of the Ionian hydrography, circulation and
10
water mass pathways during POEM – Phase I, Prog. Oceanogr., 39, 153–204, 1997. Malanotte-Rizzoli, P., Manca, B. B., Rivera D’ Alcala, M., Theocharis, A., Brenner, S.,
Budil-lon, G., and Özsoy, E.: The eastern Mediterranean in the 80s and in the 90s: the big transition in the intermediate and deep circulations, Dynam. Atmos. Oceans, 29, 365–395, 1999. Manca, B., Budillon, G., Scarazzato, P., and Ursella, L.: Evolution of dynamics in the
east-15
ern Mediterranean affecting water mass structures and properties in the Ionian and Adriatic Seas, J. Geophys. Res., 108, 8102, doi:10.1029/2002JC001664, 2003.
Manca, B., Burca, M., Giorgetti, A., Coatanoan, C., Garcia, M.-J., and Iona, A.: Physical and bio-chemical averaged vertical profiles in the Mediterranean regions: an important tool to trace the climatology of water masses and to validate incoming data from operational
oceanogra-20
phy, J. Marine Syst., 48, 83–116, 2004.
Millot, C. and Taupier-Letage, I.: Additional evidence of LIW entrainment across the Algerian subbasin by mesoscale eddies and not by a permanent westward flow, Prog. Oceanogr., 66, 231–250, 2005.
Nittis, K. and Perivoliotis, L.: Circulation and hydrological characteristics of the North Aegean
25
Sea: a contribution from real-time buoy measurements, Mediterranean Marine Science, 3, 21–31, 2002.
Nittis, K., Pinardi, N., and Lascaratos, A.: Characteristics of the summer 1987 flow field in the Ionian Sea, J. Geophys. Res., 98, 10171–10184, 1993.
Nittis, K., Zervakis, V., Papgeorgiou, E., and Perivoliotis, L.: Atmospheric and oceanic
observa-30
OSD
10, 883–921, 2013Hydrodynamic variability based on the multi-parametric POSEIDON Pylos
D. Kassis et al.
Title Page
Abstract Introduction
Conclusions References
Tables Figures
◭ ◮
◭ ◮
Back Close
Full Screen / Esc
Printer-friendly Version
Interactive Discussion
Discussion
P
a
per
|
Di
scussion
P
a
per
|
Discussion
P
a
per
|
Discussi
on
P
a
per
|
Nittis, K., Tziavos, C., Thanos, I., Drakopoulos, P., Cardin, V., Gacic, M., Petihakis, G., and Basana, R.: The Mediterranean Moored Multi-sensor Array (M3A): system development and initial results, Ann. Geophys., 21, 75–87, doi:10.5194/angeo-21-75-2003, 2003.
Ovchinnikov, I. M.: Formation of Intermediate Waters in the Mediterranean Sea, Oceanology, 24, 217–255, 1984.
5
Petihakis G., Nittis K., Ballas D., Kassis D., Pagonis P., Perivoliotis L., and Drakopoulos P., 2009: The POSEIDON reference time-series stations of the Eastern Mediterranean Sea, in Proceedings of the “OceanObs’09: Sustained Ocean Observations and Information for Society” Conference (Annex), Venice, Italy, 21-25 September 2009, Hall, J., Harrison D. E. and Stammer, D., Eds., ESA Publication WPP-306, 2010.
10
Pinardi, N. and Masetti, E.: Variability of the large scale general circulation of the Mediter-ranean Sea from observations and modelling: a review, Palaeogeogr. Palaeocl., 158, 153– 173, 2000.
POEM GROUP: General circulation of the Eastern Mediterranean, Earth Sci. Rev., 32, 285– 309, 1992.
15
Robinson, A. R. and Malanotte-Rizzoli, P.: Physical Oceanography of the Eastern Mediter-ranean Sea, Deep-Sea Res., Part II, vol. 40, Pergamon, Oxford, 300 pp., 1993.
Roether, W., Manca, B. B., Klein, B., Bregant, D., Georgopoulos, D., Beitzel, V., Kovacevic, V., and Luchetta, A.: Recent changes in eastern Mediterranean deep waters, Science, 271, 333–335, 1996.
20
Theocharis, A., Papageorgiou, E., and Zodiatis, G.: Flows and water mass exchanges between the Aegean and Ionian Seas through the Straits of Kithira and Antikithira (late summer 1987), Rapp. Comm. Int. Mer Medit., 32, 174–192, 1990.
Theocharis, A., Georgopoulos, D., Lascaratos, A., and Nittis, K.: Water masses and circula-tion in the central region of the Eastern Mediterranean: Eastern Ionian, South Aegean and
25
Northwest Levantine, 1986–1987, Deep-Sea Res. Pt. II, 40, 1121–1142, 1993.
Theocharis, A., Balopoulos, E., Kioroglou, S., Kontoyiannis, H., and Iona, A.: A synthesis of the circulation and hydrography of the South Aegean Sea and the Straits of the Cretan Arc (March 1994–January 1995), Prog. Oceanogr., 44, 469–509, 1999a.
Theocharis, A., Nittis, K., Kontoyannis, H., Papageorgiou, E., and Balopoulos, E.: Climatic
30
OSD
10, 883–921, 2013Hydrodynamic variability based on the multi-parametric POSEIDON Pylos
D. Kassis et al.
Title Page
Abstract Introduction
Conclusions References
Tables Figures
◭ ◮
◭ ◮
Back Close
Full Screen / Esc
Printer-friendly Version
Interactive Discussion
Discussion
P
a
per
|
Di
scussion
P
a
per
|
Discussion
P
a
per
|
Discussi
on
P
a
per
|
Theocharis, A., Klein, B., Nittis, K., and Roether, W.: Evolution and status of the Eastern Mediterranean Transient (1997–1999), J. Marine Syst., 33–34, 91– 116, 2002.
Tsimplis, M. N., Velegrakis, A. F., Drakopoulos, P., Theocharis, A., and Collins, M. B.: Cretan deep water outflow in the Eastern Mediterranean, Prog. Oceanogr., 44, 531–551, 1999. Velaoras, D. and Lascaratos, A.: Deep water mass characteristics and interannual variability in
5
OSD
10, 883–921, 2013Hydrodynamic variability based on the multi-parametric POSEIDON Pylos
D. Kassis et al.
Title Page
Abstract Introduction
Conclusions References
Tables Figures
◭ ◮
◭ ◮
Back Close
Full Screen / Esc
Printer-friendly Version
Interactive Discussion
Discussion
P
a
per
|
Di
scussion
P
a
per
|
Discussion
P
a
per
|
Discussi
on
P
a
per
|
Table 1.Configuration of Pylos observatory during 2010–2011.
Parameter Depth Sensor(s) used Accuracy
Wind speed/dir., Surface Young 04106 1 m s−1
, 10 deg
Air pressure, Surface Vaisala PTB 220A 0.15 hPa
Air temperature, Surface Omega 0.1oC
Wave height, direction, period Surface FugroOCEANOR Wavesense 0.1 m, 0.5 deg, 0.5 s
SST, SSS surface, Surface (1 m) Seabird SIP ±0.002◦C, 0.0003 S m−1
Currents Surface (1 m) Nortek Aquadopp current meter Sp:±0.5 cm s−1
Dir:±2 deg
Water Temperature 20, 50, 75, 100, 250, 400, 500 m Seabird 37-IM C-T 0.005◦C
Salinity 20, 50, 75, 100, 250, 400, 500 m Seabird 37-IM C-T 0.0005 S m−1
OSD
10, 883–921, 2013Hydrodynamic variability based on the multi-parametric POSEIDON Pylos
D. Kassis et al.
Title Page
Abstract Introduction
Conclusions References
Tables Figures
◭ ◮
◭ ◮
Back Close
Full Screen / Esc
Printer-friendly Version
Interactive Discussion
Discussion
P
a
per
|
Di
scussion
P
a
per
|
Discussion
P
a
per
|
Discussi
on
P
a
per
|
Table 2.Maximum, minimum and mean values for each parameter, depth zone and year.
Salin-ity andσθ potential density upper layer does not include surface (1 m) measures as surface conductivity sensor presented major drifts due to biofouling. A failure on the surface CT sensor made also temperature data unavailable for the second half of 2010 thus statistical values have not been calculated for the whole layer.
Years 2008 2009 2010
Parameter Depth zone max min mean max min mean max min mean
T (◦C)
±0.01◦C 1–100 m 28.46 14.62 17.2 28.24 14.45 17.31 – – –
250–500 m 15.15 14 14.5 15.2 14.27 14.7 16.03 14.3 14.97 S (PSU)±0.01 PSU 20–100 m 38.96 38.4 38.63 39.23 38.28 38.73 39.05 38.5 38.85 250–500 m 38.96 38.8 38.89 39.04 38.86 38.95 39.14 38.89 39
σθ(Kg m−3)
±0.01 kg m−3 20–100 m 29.06 26.13 28.44 29.06 25.95 28.47 28.91 26.14 28.46
OSD
10, 883–921, 2013Hydrodynamic variability based on the multi-parametric POSEIDON Pylos
D. Kassis et al.
Title Page
Abstract Introduction
Conclusions References
Tables Figures
◭ ◮
◭ ◮
Back Close
Full Screen / Esc
Printer-friendly Version
Interactive Discussion
Discussion
P
a
per
|
Di
scussion
P
a
per
|
Discussion
P
a
per
|
Discussi
on
P
a
per
|
Fig. 1.The POSEIDON buoy network. Green dots indicate coastal buoys while yellow deep
OSD
10, 883–921, 2013Hydrodynamic variability based on the multi-parametric POSEIDON Pylos
D. Kassis et al.
Title Page
Abstract Introduction
Conclusions References
Tables Figures
◭ ◮
◭ ◮
Back Close
Full Screen / Esc
Printer-friendly Version
Interactive Discussion
Discussion
P
a
per
|
Di
scussion
P
a
per
|
Discussion
P
a
per
|
Discussi
on
P
a
per
|
Fig. 8.Wind velocity vectors during summer 2010 (here the arrows denote the destination of
OSD
10, 883–921, 2013Hydrodynamic variability based on the multi-parametric POSEIDON Pylos
D. Kassis et al.
Title Page
Abstract Introduction
Conclusions References
Tables Figures
◭ ◮
◭ ◮
Back Close
Full Screen / Esc
Printer-friendly Version
Interactive Discussion
Discussion
P
a
per
|
Di
scussion
P
a
per
|
Discussion
P
a
per
|
Discussi
on
P
a
per
|
Fig. 18.Salinity profiles from 8 different CTD casts during the scheduled maintenance cruises
OSD
10, 883–921, 2013Hydrodynamic variability based on the multi-parametric POSEIDON Pylos
D. Kassis et al.
Title Page
Abstract Introduction
Conclusions References
Tables Figures
◭ ◮
◭ ◮
Back Close
Full Screen / Esc
Printer-friendly Version
Interactive Discussion
Discussion
P
a
per
|
Di
scussion
P
a
per
|
Discussion
P
a
per
|
Discussi
on
P
a
per
|