OSD
10, 1647–1705, 2013Ventilation of the Mediterranean Sea
T. Stöven and T. Tanhua
Title Page
Abstract Introduction
Conclusions References
Tables Figures
◭ ◮
◭ ◮
Back Close
Full Screen / Esc
Printer-friendly Version
Interactive Discussion
Discussion
P
a
per
|
D
iscussion
P
a
per
|
Discussion
P
a
per
|
Discuss
ion
P
a
per
|
Ocean Sci. Discuss., 10, 1647–1705, 2013 www.ocean-sci-discuss.net/10/1647/2013/ doi:10.5194/osd-10-1647-2013
© Author(s) 2013. CC Attribution 3.0 License.
Open Access
Ocean Science Discussions
This discussion paper is/has been under review for the journal Ocean Science (OS). Please refer to the corresponding final paper in OS if available.
Ventilation of the Mediterranean Sea
constrained by multiple transient tracer
measurements
T. Stöven and T. Tanhua
GEOMAR Helmholtz Centre for Ocean Research Kiel, Kiel, Germany
Received: 9 September 2013 – Accepted: 21 September 2013 – Published: 10 October 2013
Correspondence to: T. Stöven ([email protected])
OSD
10, 1647–1705, 2013Ventilation of the Mediterranean Sea
T. Stöven and T. Tanhua
Title Page
Abstract Introduction
Conclusions References
Tables Figures
◭ ◮
◭ ◮
Back Close
Full Screen / Esc
Printer-friendly Version
Interactive Discussion
Discussion
P
a
per
|
D
iscussion
P
a
per
|
Discussion
P
a
per
|
Discuss
ion
P
a
per
Abstract
Ventilation is the prime pathway for ocean surface perturbations, such as temperature anomalies, to be relayed to the ocean interior. It is also the conduit for gas exchange between atmosphere and ocean and thus the mechanism whereby, for instance, the interior ocean is oxygenated and enriched in anthropogenic carbon. The ventilation of
5
the Mediterranean Sea is fast in comparison to the world ocean and has large tempo-ral variability, so that quantification of Mediterranean Sea ventilation rates is challeng-ing and very relevant for Mediterranean oceanography and biogeochemistry. Here we present transient tracer data from a field-campaign in April 2011 that sampled a unique suite of transient tracers (SF6, CFC-12, tritium and 3He) in all major basins of the
10
Mediterranean. We apply the Transit Time Distribution (TTD) model to the data which then constrain the mean age, the ratio of the advective/diffusive transport mechanism, and the presence, or not, of more than one significant (for ventilation) water mass.
We find that the eastern part of the Eastern Mediterranean can be reasonable de-scribed with a one dimensional Inverse Gaussian (1IG) TTD, and thus constrained with
15
two independent tracers. The ventilation of the Ionian Sea and the Western Mediter-ranean can only be constrained by a multidimensional TTD. We approximate the venti-lation with a two-dimensional Inverse Gaussian (2IG) TTD for these areas and demon-strate one way of constraining a 2IG-TTD from the available transient tracer data. The deep water in the Ionian Sea has higher mean ages than the deep water of the
Lev-20
antine Basin despite higher transient tracer concentrations. This is partly due to the deep water of Adriatic origin having more diffusive properties in the transport and for-mation, i.e. a high ratio of diffusion over advection, compared to the deep water of Aegean Sea origin that still dominates the deep Levantine Basin deep water after the Eastern Mediterranean Transient (EMT) in the early 1990s. We also show that the deep
25
OSD
10, 1647–1705, 2013Ventilation of the Mediterranean Sea
T. Stöven and T. Tanhua
Title Page
Abstract Introduction
Conclusions References
Tables Figures
◭ ◮
◭ ◮
Back Close
Full Screen / Esc
Printer-friendly Version
Interactive Discussion
Discussion
P
a
per
|
D
iscussion
P
a
per
|
Discussion
P
a
per
|
Discuss
ion
P
a
per
|
deep water has higher transient tracer concentrations than the mid-depth water, but the mean age is similar.
1 Introduction
The Mediterranean Sea is a marginal sea, where the observational record shows distinctive variability and trends. The most prominent transient event in the Eastern
5
Mediterranean Sea (EMed) is the transfer of the deep water source from the Adriatic Sea to the Aegean and Cretan Sea and vice versa. The observed massive dense wa-ter input from the Aegean and Cretan Sea in the early 1990s is known as the Easwa-tern Mediterranean Transient (EMT) (Roether et al., 1996; Klein et al., 1999; Lascaratos et al., 1999). The extensive deep water formation in the Western Mediterranean Sea
10
(WMed) between 2004–2006, known as the Western Mediterranean Transition (WMT) (Schroeder et al., 2008, 2010), is presumed to be triggered respectively preconditioned by the EMT event (Schroeder et al., 2006). Nevertheless, both events are part of a gen-eral circulation pattern which can be observed in the Mediterranean Sea. The surface water in the Western Mediterranean Sea (WMed) is supplied by less dense Atlantic
15
Water (AW) through the Strait of Gibraltar. The AW flows eastwards at shallow depth
<200 m into the Tyrrhenian Sea and into the EMed via the Strait of Sicily. The salin-ity of the AW increases along the pathway from 36.5 to >38 due to net evaporation and is then described as Modified Atlantic Water (MAW) (Wuest, 1961). The heat loss during winter time of the MAW in the EMed leads to a sufficient increase of density to
20
form the Levantine Intermediate Water (LIW) at depth between 200–600 m (Brasseur et al., 1996; Wuest, 1961). The exact area of the LIW formation process is uncertain and possibly variable, but it is expected to be in the eastern part of the EMed near Rhodes (Malanotte-Rizzoli and Hecht, 1988; Lascaratos et al., 1993; Roether et al., 1998). The main volume of the LIW flows back westwards over the shallow sill
be-25
OSD
10, 1647–1705, 2013Ventilation of the Mediterranean Sea
T. Stöven and T. Tanhua
Title Page
Abstract Introduction
Conclusions References
Tables Figures
◭ ◮
◭ ◮
Back Close
Full Screen / Esc
Printer-friendly Version
Interactive Discussion
Discussion
P
a
per
|
D
iscussion
P
a
per
|
Discussion
P
a
per
|
Discuss
ion
P
a
per
where it serves as an initial source of the Adriatic Sea Overflow Water (ASOW). The formation of ASOW in the Adriatic Pit is based on interactions between the LIW and water masses coming from the northern Adriatic Sea as well as the natural precondi-tioning factors, e.g. wind stress and heat loss (Artegiani et al., 1996a, b). The ASOW flows over the sill of Otranto into the Ionian Sea intruding the bottom layer and thus
5
representing a source of the Eastern Mediterranean Deep Water (EMDW) (Schlitzer et al., 1991; Roether and Schlitzer, 1991). Furthermore, the Ionian Sea is connected with the Levantine Sea via the Cretan Passage, following that parts of newly formed EMDW also reach the deep water of the Levantine Sea. In 1992/93 the water mass conditions in the well ventilated Aegean and Cretan Sea changed into a more salty and
10
cold state, sufficient enough to initialize the massive dense water input of Cretan Deep Water (CDW) into the abyssal basins of the EMed (Klein et al., 1999). This EMT event led to a disruption of the usual formation pattern of the EMDW. The Adriaitc Sea as major deep water source was thereby replaced by the Aegean and Cretan Sea with the consequence that the bottom layer of the Ionian Sea was now supplied with dense
15
water via the Antikythera Strait and the Levantine Sea via the Kasos Strait. Not only the simultaneous dense water input into both basins, but also the large amount of the out-flow caused an uplift of the intermediate water layers in the Ionian and Levantine Sea. One consequence of the EMT seems to be the preconditioning of the WMT in 2004– 2006 by uplifted water masses entering the WMed via the Strait of Sicily. An extensive
20
deep water formation in the WMed took place in the Gulf of Lyon and the Balearic Sea, whereat the major triggering factor was the heat loss due to the Mistral in this area. Although the total magnitude of the WMT was smaller than the one of the EMT it ef-fects nearly a complete renewal of the Western Mediterranean Deep Water (WMDW). Recent water mass analyses indicate, that the EMed is returning to a pre EMT state
25
Dichlorodi-OSD
10, 1647–1705, 2013Ventilation of the Mediterranean Sea
T. Stöven and T. Tanhua
Title Page
Abstract Introduction
Conclusions References
Tables Figures
◭ ◮
◭ ◮
Back Close
Full Screen / Esc
Printer-friendly Version
Interactive Discussion
Discussion
P
a
per
|
D
iscussion
P
a
per
|
Discussion
P
a
per
|
Discuss
ion
P
a
per
|
fluoromethane (CFC-12) and Sulfur Hexafluoride (SF6) as well as helium isotopes and tritium were measured to provide a comprehensive data set of time dependent tracers.
2 Materials and method
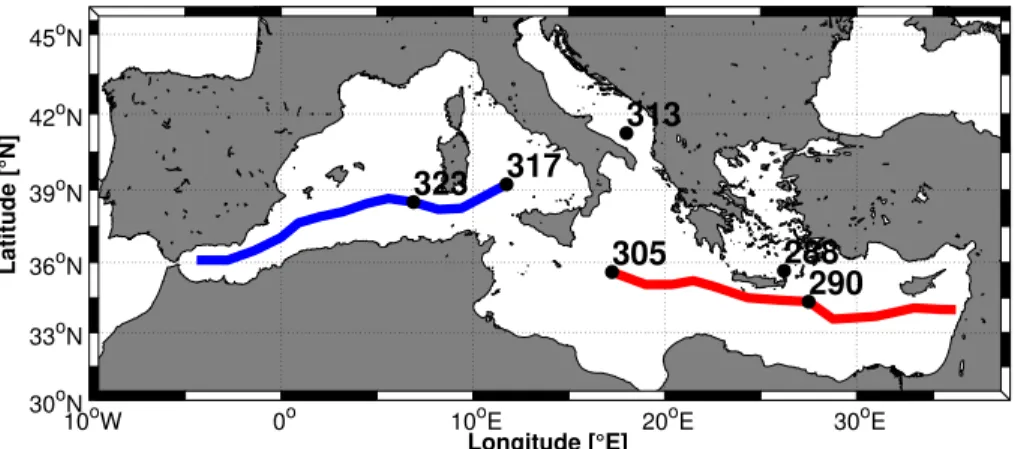
The expedition M84/3 from Istanbul to Vigo took place from the 5–28 April 2011 on the german research vessel FS Meteor (Tanhua et al., 2013a, b). Figure 1 shows an
5
overview of the different sample stations separated in CFC-12, CFC-12 with isotopes and transient tracer stations including SF6. The transient tracers CFC-12 and SF6were sampled at nearly all stations in the EMed whereas only three stations of SF6exist in
the WMed. The measurements of CFC-12 and SF6were mainly performed on board.
The water samples were taken with 250 mL glass syringes or 300 mL glass ampules
10
under exclusion of atmosphere from niskin bottles whereat the sampling depths were chosen to cover the complete water column in a sufficient resolution. The syringes and ampules were stored in a cooling box filled with water of ≈0◦C to prevent outgas-ing of the tracers. The measurements were carried out with similar analytical systems as described by Bullister and Wisegarver (2008); Law et al. (1994). One measurement
15
system named VS1 consisted of a Shimadzu GC14a gas chromatograph equipped with an Electron Capture Detector (ECD), stainless steel tubing system and Valco valves. The 1/8′′precolumn was packed with 30 cmPorasil C, the 1/16′′trap with 70 cm Hey-sep Dand the 1/8′′ main column with 180 cmCarbograph 1ACand a 20 cmMolsieve 5 Åtail-end. An evacuated vacuum sparge tower (VST) was used to transfer the water
20
sample out of the glass ampule into the measurement system. Due to the low pressure in the VST, most of the dissolved gases pass over into the head space during the fill-ing process. The residual was purged out with nitrogen in ECD-quality. The trap was installed in a Dewar filled with a bottom layer of liquid nitrogen. The distance between trap and cooling medium was regulated by a Lab Boy to hold a temperature range
be-25
tween−70◦C to
OSD
10, 1647–1705, 2013Ventilation of the Mediterranean Sea
T. Stöven and T. Tanhua
Title Page
Abstract Introduction
Conclusions References
Tables Figures
◭ ◮
◭ ◮
Back Close
Full Screen / Esc
Printer-friendly Version
Interactive Discussion
Discussion
P
a
per
|
D
iscussion
P
a
per
|
Discussion
P
a
per
|
Discuss
ion
P
a
per
sealed in glass ampules for a later onshore measurement. The sealed ampules were measured during summer 2011 at the IfM-GEOMAR in Kiel with the repaired VS1 in-strument and an installed ampule cracker system similar to Vollmer and Weiss (2002). The second measurement system PT3 consisted of a Shimadzu GC2014 gas chro-matograph with a similar basic setup like the VS1 system but with a different
col-5
umn composition, sample chamber and trap system. The 1/8′′precolumn consisted of 60 cmPorasil Cand 10 cmMolsieve 5 Å, the 1/8” main column of 180 cmCarbograph 1ACand 30 cmMolsieve 5 Å. Insufficient base line separation prevented a quantitative analysis of SF6with this column setup. For a measurement an aliquot of≈200 mL was
injected into the sample chamber with a sampling syringe and then also purged with
10
highly purified nitrogen. Instead of a trap system with liquid nitrogen, a pressure reg-ulated ethanol bath was used. The ethanol was cooled by a Julabo cooling finger to a minimum temperature of−68◦C. For the purge and trap process the fill level is raised until the trap dips into the ethanol and is lowered again for the heating process (Bullis-ter and Wisegarver, 2008). The traps of both measurement systems were heated to
15
90◦C by an electrical current flow, which was automatically regulated by a Proportional-Integral-Derivative controller (PID). A detailed description of the data set, the sampling, the calibration and measuring procedure as well as a precise technical overview can be found in Stöven (2011).
The samples of tritium and helium-3 were measured by J. Sültenfuß at the Institute of
20
Environmental Physics of the University of Bremen. Details of the measuring procedure and statistical evaluations can be found in Sültenfuß et al. (2009).
3 Transient tracers
3.1 Chronological transient tracers
The chronological transient tracers are based on an increasing tracer concentration in
25
OSD
10, 1647–1705, 2013Ventilation of the Mediterranean Sea
T. Stöven and T. Tanhua
Title Page
Abstract Introduction
Conclusions References
Tables Figures
◭ ◮
◭ ◮
Back Close
Full Screen / Esc
Printer-friendly Version
Interactive Discussion
Discussion
P
a
per
|
D
iscussion
P
a
per
|
Discussion
P
a
per
|
Discuss
ion
P
a
per
|
SF6. The concentrations of trace gases in the atmosphere are, for example, mea-sured by the world wide AGAGE network, so that the input history over time is well known (Walker et al., 2000; Bullister, 2011). The production of CFC’s and thus the emission was lowered and finally stopped in the late 80’s respectively early 90’s in the course of the Montreal Protocol which concerns of the handling of ozone depleting
5
compounds. As a consequence, the concentration of CFC-12 currently decreases in the atmosphere, so that a cut-offlimit of >532 ppt in 2011 occurs. Every concentra-tion above this limit describes two dates in the atmospheric history of the tracer shown in Fig. 2 and thus these CFC-12 concentrations are inconclusive for tracer age deter-mination between 1994–2011. SF6 has still an increasing concentration gradient but
10
compared to the CFC’s a very low emission rate. The recent concentration in the at-mosphere is below 8 ppt but increasing roughly linearly. The production and use of SF6
has partly local restrictions, but there is no international agreement yet despite of the high Global Warming Potential of 22 000 (IPCC, 1996). The tracers enter the oceans surface layer via gas exchange, following that the solubility is a function of temperature,
15
salinity and the physical nature of the molecule. Such solubility functions like Eq. (1) are available for most of the CFC’s and SF6 (Warner and Weiss, 1985; Bullister et al., 2002).
ln(F)=a1+a2
100 T
+a3ln
T 100
+a4ln
T 100
2
+S
"
b1+b2
T 100
+b3
T 100
2#
(1)
20
The influence of wind speed, pressure and temperature drops in terms of under- or oversaturation is normally low and a saturation of 100 % is supposed to be correct. These solubility functions are used to convert the measured gravimetric units, e.g. pmol kg−1for CFC-12 and fmol kg−1for SF
6, into the partial pressure in ppt of a tracer.
The partial pressure should be the preferred choice instead of the gravimetric units,
25
com-OSD
10, 1647–1705, 2013Ventilation of the Mediterranean Sea
T. Stöven and T. Tanhua
Title Page
Abstract Introduction
Conclusions References
Tables Figures
◭ ◮
◭ ◮
Back Close
Full Screen / Esc
Printer-friendly Version
Interactive Discussion
Discussion
P
a
per
|
D
iscussion
P
a
per
|
Discussion
P
a
per
|
Discuss
ion
P
a
per
parable within the complete water column and atmosphere. Chronological tracers are conserved tracers with no significant sources or sinks in the ocean interior. The con-centration in the water column depends on the last time the water parcel was in contact with the atmosphere and of course also on the influence of mixing and diffusion.
3.2 Radioactive transient tracers 5
The radioactive tracers such as tritium and its decay product helium (3He) form the second class of transient tracers. Tritium has a natural background concentration of ≈0.3 Tritium Units (TU) in the atmosphere, where 1 TU equals the number of one tritium atom per 1018hydrogen atoms (Ferronsky and Polyakov, 1982). Due to nuclear bomb tests in the late 50s and 60s the tritium concentration increased up to 100 TU in the
10
atmosphere and declined afterwards to a current concentration of 1–1.2 TU in 2011. The input of tritium into the ocean surface layer is a function of radioactive decay in the atmosphere, vapor pressure and the variance of location and extend of precipitation. Tritium decays to 3He which equilibrates with the atmosphere as long as the water parcel remains in the boundary layer of gas exchange. Once the water reaches the
15
ocean’s interior, the radioactive decay serves as time varying sink.
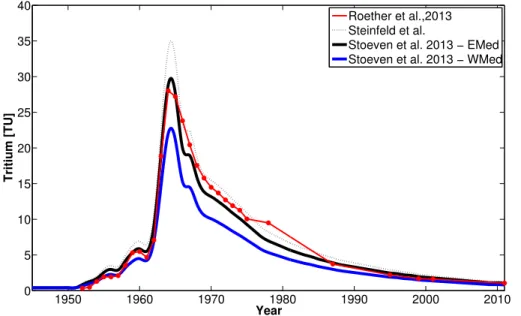
The Mediterranean is characterized by higher tritium concentrations than the At-lantic due to continental influences in terms of weather conditions and fresh water input. A commonly used tritium input function (TIF) for the North Atlantic was ob-tained by Dreisigacker and Roether (1978) and further developed for the EMed by
20
Roether et al. (1992). Based on this data set, another TIF for the EMed was created by R. Steinfeld (unpublished) where the data after 1974 was extrapolated by using the de-cay function of tritium. In the WMed the surface layer is mainly influenced by the inflow of Atlantic Water (AW), so that the input function needs to be corrected for the degree of dilution. The tritium stations of the M84/3 cruise can be used for a simple approach.
25
OSD
10, 1647–1705, 2013Ventilation of the Mediterranean Sea
T. Stöven and T. Tanhua
Title Page
Abstract Introduction
Conclusions References
Tables Figures
◭ ◮
◭ ◮
Back Close
Full Screen / Esc
Printer-friendly Version
Interactive Discussion
Discussion
P
a
per
|
D
iscussion
P
a
per
|
Discussion
P
a
per
|
Discuss
ion
P
a
per
|
EMed and 35 % lower in the WMed than suggested in the original input function. Under the assumption that the determined offset is constant over years, both factors can be used as offset correction to create two alternative input functions (Fig. 3) which can be applied to a TTD mixing model, see below.
Figure 3 shows also the recent TIF of the Med by Roether et al. (2013), which also
5
relies on the data set of Dreisigacker and Roether (1978). This TIF was recalculated for the EMed by using a dilution factor and mean surface tritium concentrations obtained during several cruises between 1974 and 2011. Comparing both recent TIFs of the EMed one can see that the shape of both curves are relatively similar. This points out that both input functions seem to be useful approaches for the EMed despite of
10
the different buildup structure. However, by using an interpolated form of the input function of Roether et al. (2013) one yield higher mean ages compared to to the input function we obtained. The main deviation from the decay based input function is the data point of 1978 following that the interpolated tritium concentrations are significant elevated between 1975 and 1987, producing differences in mean ages. The mean
15
deviation between the different TIFs and the original TIF of the North Atlantic are 86 % respectively 61 % (Roether et al., 2013) for the EMed and 43 % for the WMed.
4 Tracer age and the Transit Time Distribution
The age of a water parcel can be described in different ways. For chronological tran-sient tracers the measured concentration of a samplecin yeartscan be set in relation
20
to the concentrationc0and yearthistof the atmospheric history of the tracer (Eq. 2).
c(ts)=c0(thist) (2)
The difference of the sampling yeartsand the obtained yearthistdefines the tracer age
τ(Eq. 3).
τ=ts−thist (3)
OSD
10, 1647–1705, 2013Ventilation of the Mediterranean Sea
T. Stöven and T. Tanhua
Title Page
Abstract Introduction
Conclusions References
Tables Figures
◭ ◮
◭ ◮
Back Close
Full Screen / Esc
Printer-friendly Version
Interactive Discussion
Discussion
P
a
per
|
D
iscussion
P
a
per
|
Discussion
P
a
per
|
Discuss
ion
P
a
per
The tracer age of radioactive tracers depends on first order kinetics shown in Eq. (4). The initial concentration [A0] and the decay constantλare the required parameters to calculate the elapsed time of a tracer in a water parcel.
τ=1
λ·ln
A0
[A]
!
(4)
As mentioned above, tritium has in addition to the radioactive decay a relevant input
5
function and thus an unknown part for [A0]. Therefore, the decay product of tritium needs to be measured. The tritiugenic3He replaces the initial concentration of tritium and Eq. (4) can be rewritten to Eq. (5). A generally accepted value for the decay con-stant of tritium isλ=0.05576/a(Unterweger et al., 1980; Taylor and Roether, 1982).
τ=1
λ·ln
1+
h3
Hetri i
3
H
(5)
10
The significance of a tracer age is relatively low because it is based on the assumption of a complete advective behavior neglecting any diffusive mixing process. However, there are also some approaches like dilution models (Roether et al., 2013) and the tracer age of CFC-12 and SF6with a≈14 yr time-lag (Tanhua et al., 2013c; Schneider
et al., 2013) which allow an estimation of changes in ventilation. A model which
ac-15
counts for mixing and diffusion is the Transit Time Distribution (TTD) model. The TTD is based on the Green’s function and was invented to describe atmospheric ventilation processes (Hall and Plumb, 1994). However, the basic idea that a parcel of molecules changes its location under the influence of advection and diffusion can also be applied to ventilation processes of the ocean. Equation (6) is an analytical expression of the
20
OSD
10, 1647–1705, 2013Ventilation of the Mediterranean Sea
T. Stöven and T. Tanhua
Title Page
Abstract Introduction
Conclusions References
Tables Figures
◭ ◮
◭ ◮
Back Close
Full Screen / Esc
Printer-friendly Version
Interactive Discussion
Discussion
P
a
per
|
D
iscussion
P
a
per
|
Discussion
P
a
per
|
Discuss
ion
P
a
per
|
Transit Time Distribution (1D-IG-TTD).
G(t)=
s
Γ3
4π∆2t3·exp
−Γ(t−Γ)2 4∆2t
!
(6)
The key variables in this equation areΓ for the mean age and ∆ for the width of the distribution. The age spectratis defined by the initial yeartiof the atmospheric history respectively the input function of the tracer and the year of samplingts. Equation (7) 5
shows for example the time range of CFC-12 for the sampling year 2011.
tCFC-12=1936(ti). . .2011(ts) (7)
To give a statement on the share of advection and diffusion the∆/Γratio can be used. A low ratio like 0.4–0.8 indicates a high advective part e.g. extensive deep water for-mations whereas a high ratio like 1.2–1.8 indicates a more diffusive character of the
10
water parcel. The definite integral of Eq. (8) contains the link between the measured concentration of a samplec(ts) and the mean age of the TTD.
c(ts)=
∞
Z
0
c0(t)·G(t)dt (8)
A further approach to determine a mean age is the linear combination of two distribu-tions which is shown in Eq. (9). Similar to an one Inverse-Gaussian-TTD, a possible
15
solution is a two Inverse-Gaussian-TTD (1D-2IG-TTD) and can be envisioned for two water masses with different histories (age), but with similar density, that mixes in the ocean interior. This model has been explored by, for instance, Waugh et al. (2002).
c(ts)= ∞
Z
0
OSD
10, 1647–1705, 2013Ventilation of the Mediterranean Sea
T. Stöven and T. Tanhua
Title Page
Abstract Introduction
Conclusions References
Tables Figures
◭ ◮
◭ ◮
Back Close
Full Screen / Esc
Printer-friendly Version
Interactive Discussion
Discussion
P
a
per
|
D
iscussion
P
a
per
|
Discussion
P
a
per
|
Discuss
ion
P
a
per
The number of possible combinations of distributions and parameters provides a com-prehensive concept of age modeling in the ocean. The main complexity consists of finding accurate and reasonable solutions fitting to the field data. The mean age is then determined by Eq. (10).
Γ =α·Γ1+(1−α)·Γ2 (10)
5
5 Practical application of the TTD model
A common procedure described in several published articles (e.g., Schneider et al., 2010; Waugh et al., 2006, 2004) is to apply the 1IG-TTD with a ratio of∆/Γ =1 to the tracer data to calculate a water mass mean age. The∆/Γhas been demonstrated to be close to one in large parts of the world ocean. This might be a helpful and sufficient
10
approach where data of only one tracer exists. Furthermore, a TTD related approach of age spectra modeling was carried out by Steinfeldt (2004) for the EMed in 1987. Another reasonable case is to analyze transient tracer time series in terms of changes in ventilation where the rate of age growth per year is more in focus than a precise mean age (Huhn et al., 2013). Furthermore the standard procedure should be used
15
within tracer surveys with few sample points because local outliers of constrained data points can produce significant flaws in interpolation. For a comprehensive data set, consisting of more than one transient tracer, a constrained TTD model should be the preferred choice. The determined∆/Γratios provide a first insight into the water mass structure concerning the advective and dispersive behavior. The further analysis of
20
OSD
10, 1647–1705, 2013Ventilation of the Mediterranean Sea
T. Stöven and T. Tanhua
Title Page
Abstract Introduction
Conclusions References
Tables Figures
◭ ◮
◭ ◮
Back Close
Full Screen / Esc
Printer-friendly Version
Interactive Discussion
Discussion
P
a
per
|
D
iscussion
P
a
per
|
Discussion
P
a
per
|
Discuss
ion
P
a
per
|
5.1 Constraining the IG-TTD model
The prerequisite to constrain the IG-TTD is a transient tracer couple. The tracers of the couple need to have sufficiently different atmospheric histories to constrain the∆/Γ ra-tio. For tracer couples with quite similar atmospheric histories like CFC-12 and CFC-11 one yield a wide range of possible solutions and thus a non-constrained TTD. Useful
5
couples are CFC-12/SF6and tritium/SF6. The first step of data processing includes the
calculation of mean ages for∆/Γratios between 0.0–1.8 for every data point and tracer, always taking into account the correct surface ocean history of the source region. The determined data points of mean age vs. ∆/Γ ratio are used to obtain polynomial re-gressions of second order. Following that every sample point of every tracer can be
10
expressed by a mean age function (Eq. 11).
Γ =a∆/Γ2+b∆/Γ+c (11)
The intersection between two mean age functions denotes the constrained∆/Γ ratio and mean age. In some cases where no exact intersection can be found it is useful to determine the local minimum of a combined mean age function in the range of
15
∆/Γ. A local minimum indicates the point of the smallest difference in mean ages, which should be used to a maximum difference of 5 yr to ensure also the consideration of a maximum analytical error of ≈4 %. To obtain the mean age of such a minimum function, the average of both mean ages needs to be calculated. However, in some cases it is more meaningful to use one of the tracer mean ages than the average mean
20
age. For example are SF6 mean ages for recently ventilated waters more significant
than CFC-12 mean ages. In contrast, CFC-12 mean ages should be used in older water layers where SF6concentrations are close to the detection limit.
A further aspect of the IG-TTD model is the validity area of each tracer couple, which defines the possible range of IG-TTD solutions. A rough classification of the specific
25
OSD
10, 1647–1705, 2013Ventilation of the Mediterranean Sea
T. Stöven and T. Tanhua
Title Page
Abstract Introduction
Conclusions References
Tables Figures
◭ ◮
◭ ◮
Back Close
Full Screen / Esc
Printer-friendly Version
Interactive Discussion
Discussion
P
a
per
|
D
iscussion
P
a
per
|
Discussion
P
a
per
|
Discuss
ion
P
a
per
the sampling year of 2011), it indicates that a 1IG distribution cannot explain the tracer distribution, and more refined models of the TTD are needed, for instance the linear combination of two IG-TTDs.
5.2 Constraining the 2IG-TTD model
Due to the five free parametersα,Γ1,Γ2,∆1and∆2the system of equations is under-5
determined for any tracer survey with less than five measured transient tracers. Most surveys include two or three transient tracers with sufficiently differences in atmo-spheric histories. Here we introduce one way to use an under-determined 2IG-TTD model. Based on oceanographic water mass analysis one can estimate the composi-tion of the current state of the water masses and roughly the underlying mixing
pro-10
cesses. As described above the Western and Eastern Mediterranean are both affected by an extensive deep water formation with fresh and salty water from the surface and intermediate layer respectively. The null hypothesis is that an old and more stationary water mass can be described by a 1IG-TTD which is or was intruded by a younger water parcel described by another 1IG-TTD. Hereby the younger water parcel might be
15
characterized by a more advective behavior with a low ratio, e.g.∆/Γ =0.6. The ratio of the more stationary water mass is set to∆/Γ =1.4, describing a typical ratio of a more diffusive/dispersive behavior. By making assumptions about the∆/Γratio of both 1IG-TTDs one can calculate mean age matrices for different α’s with x = Γ1,y = Γ2 and
z=Ctracer. The concentration of a measured sample generates different concentration 20
OSD
10, 1647–1705, 2013Ventilation of the Mediterranean Sea
T. Stöven and T. Tanhua
Title Page
Abstract Introduction
Conclusions References
Tables Figures
◭ ◮
◭ ◮
Back Close
Full Screen / Esc
Printer-friendly Version
Interactive Discussion
Discussion
P
a
per
|
D
iscussion
P
a
per
|
Discussion
P
a
per
|
Discuss
ion
P
a
per
|
6 Results and discussion
6.1 General ventilation pattern
6.1.1 Eastern Mediterranean Sea
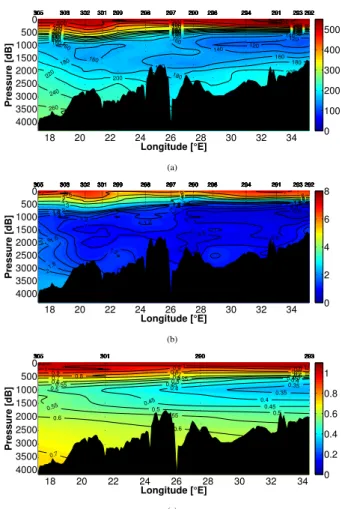
The zonal sections of the transient tracer concentrations of the Ionian and Levantine Sea show some significant characteristics of their ventilation (Fig. 5, 6). Between 27◦E
5
and the coast of Lebanon a clear Tracer Minimum Zone (TMZ) can be identified by all three tracers which vertically spreads approximately from 700–1600 m depths. The core concentration of the TMZ is 106 ppt for CFC-12, 0.3 ppt for SF6 and 0.3 TU for tritium whereat the lowest values are not visible in the gridded fields shown in Fig. 6. Beneath this TMZ the tracer concentrations are elevated in the deep water due to the
10
deep water formation in the Eastern Mediterranean Sea that led to a high volume input of tracer rich and dense water masses. The bottom concentration of the tracers are ≈200 ppt for CFC-12,≈1.1 ppt for SF6 and ≈0.6 TU for tritium. In the westerly parts
of the section (i.e. the deep Ionian Sea) the tracer concentration is higher in the deep and bottom layer than in the east. This water mass characteristic belongs to recent
15
intrusions of ASOW coming from the deep water source in the Adriatic Sea. Station 313 in the Adriatic Pit can be used as representative example for the source region of the ASOW. The concentration profiles show, that the Adriatic Pit is a well mixed and ventilated basin with minimum tracer concentrations of CFC-12>429 ppt, SF6>5 ppt
and tritium>0.9 TU (Fig. 7). The high concentrations of CFC-12 and tritium throughout
20
the whole water column at station 288 in the Cretan Sea can be related to the time range between 1990s until today (Fig. 8). The concentration gradient of SF6 indicates
a recent return to a more layered structure in the Cretan Sea, following that the high concentrations of CFC-12 and tritium in the intermediate and deep water have to be formed before this layering process, probably during the 1990s. This would imply that
25
OSD
10, 1647–1705, 2013Ventilation of the Mediterranean Sea
T. Stöven and T. Tanhua
Title Page
Abstract Introduction
Conclusions References
Tables Figures
◭ ◮
◭ ◮
Back Close
Full Screen / Esc
Printer-friendly Version
Interactive Discussion
Discussion
P
a
per
|
D
iscussion
P
a
per
|
Discussion
P
a
per
|
Discuss
ion
P
a
per
weak input functions of CFCs since early 1990s, i.e. the onset of the EMT. CFC-12 and tritium concentrations cannot be used to identify the recent change in ventilation of the Cretan Sea. A further aspect is the distribution of SF6in the Ionian and Levantine Sea
which looks more homogeneous in the intermediate and deep water compared to CFC-12. This is based on the relatively young atmospheric history of SF6, following that the 5
deep water masses are less effected by this tracer. Accurate measurements between 1 ppt and the detection limit are needed to have an useful resolution. As mentioned above, CFC-12 has a long atmospheric history with a rapid concentration increase over several decades. Thus, CFC-12 has a large dynamic scale within the measurement range, so that CFC-12 is an important tracer for intermediately old water masses.
10
6.1.2 Western Mediterranean Sea
The CFC-12 and tritium section from the Tyrrhenian Sea through the Western Basin into the Alboran Sea show, that the Western Mediterranean Deep Water (WMDW) is completely intruded by recently ventilated water masses coming from the extensive deep water formation during 2004–2006 (Fig. 5, 9, 10) (Schroeder et al., 2008, 2010).
15
The CFC-12 concentrations are>260 ppt and the tritium concentrations are>0.5 TU throughout the whole bottom layer of the Western Basin reaching the channel between Sardinia and Sicily (Fig. 9, 10). Figure 11 shows in detail that newly formed WMDW starts to enter the Tyrrhenian Sea along this bottom contour without reaching the inte-rior water masses in 2011. The Tyrrhenian Sea is characterized by CFC-12
concentra-20
tions below 180 ppt and tritium concentrations<0.5 TU suggesting that this basin was not effected by input of the 2004–2006 deep water formation into the deep and bottom water layers by 2011. These relatively low tracer concentrations from the Tyrrhenian Basin rudimentary extends as tongue into the intermediate layer between 700–1300 m of the Western Basin which correlates with the results of Rhein et al. (1999).
OSD
10, 1647–1705, 2013Ventilation of the Mediterranean Sea
T. Stöven and T. Tanhua
Title Page
Abstract Introduction
Conclusions References
Tables Figures
◭ ◮
◭ ◮
Back Close
Full Screen / Esc
Printer-friendly Version
Interactive Discussion
Discussion
P
a
per
|
D
iscussion
P
a
per
|
Discussion
P
a
per
|
Discuss
ion
P
a
per
|
6.2 Transit Time Distributions
6.2.1 1IG-TTD
The first approach of mean ages is based on the obtained ∆/Γ ratios for the 1IG-TTD model which also provide further information on water mass characteristics. For samples of the EMed the major share of ∆/Γ ratios was determinable for the
CFC-5
12/SF6tracer couple in a reasonable range. Figure 12 shows the section of∆/Γratios as interpolated macrostructure in the EMed based on CFC-12 and SF6 and the
1IG-TTD model. The sectional interpolation quality is reduced due to non constrainable data points. Figure 12 indicates that the TMZ spreading is more effected by the EMT event than the tracer concentrations suggest. The water below 1200 m in the Levantine
10
Basin have ratios between 0.4 to 0.6 indicating a high advective behavior of the EMT event. The TMZ has ratios between 1.0 to 1.3 as expected for a stable water mass where diffusion predominates. The low∆/Γratios of the EMT water masses are also observed in the easterly deep waters of the Ionian Sea whereas the deep waters further west formed by ASOW have ratios between 1.2–1.4. Combining the second tracer
15
couple consisting of SF6and tritium with the corrected input function one yield a similar
trend of∆/Γ ratios in the EMed (Fig. 13). However, there are only four stations with tritium measurements available within the section of the EMed (290, 292, 301, 305) and thus the sectional interpolation is restricted to 34 data points which does not allow a resolution of local phenomena but only provides a rough overview.
20
Comparing the∆/Γ ratios in the intermediate and deep water layers of the Cretan Sea (Fig. 14) with the EMT water masses in the Ionian and Levantine Sea (Fig. 12), one can see that the formation of the Cretan Sea Overflow Water (CSOW) as well as the EMT event itself were based on distinctly advective processes with expected mean ages nearby the tracer ages. In contrast, water masses coming from Adriatic Deep
25
OSD
10, 1647–1705, 2013Ventilation of the Mediterranean Sea
T. Stöven and T. Tanhua
Title Page
Abstract Introduction
Conclusions References
Tables Figures
◭ ◮
◭ ◮
Back Close
Full Screen / Esc
Printer-friendly Version
Interactive Discussion
Discussion
P
a
per
|
D
iscussion
P
a
per
|
Discussion
P
a
per
|
Discuss
ion
P
a
per
points with a mean age difference between 6–25 yr. One can suppose that the forma-tion of ASOW is based on slower dispersive processes of different water masses. The westerly bottom water of the Ionian Sea show the same dispersive characteristics as the ASOW (Fig. 12). This indicates that both states of∆/Γ ratios were mainly defined by the formation process of ASOW/CSOW source water and only in minor share by
5
mixing processes along the current pathway from source region into the interior of the Levantine and Ionian Sea. Therefore, the transient tracer concentrations of both deep water masses are not necessarily simply indicators of their ventilation.
Figures 16 and 17 show the determined mean ages constrained by either CFC-12 and SF6or tritium and SF6. The tritium/SF6 based maximum mean age of the TMZ in
10
the Levantine Sea is 260 yr and the deep and bottom water have mean ages between 70–80 yr. In contrast, the CFC-12/SF6based maximum mean age of the TMZ is 230 yr
with further high mean ages in the Ionian Sea between 120–180 yr. The deep and bottom water from the EMT event is the youngest water with mean ages between 50– 80 yr. Station 290 which is near the overflow area of the CSOW which can be seen by
15
the young EMT mean ages up to the intermediate layers. The deep water in the Ionian Basin has a mean age of 100 yr which underlines the difference of both deep water formations: Although the Adriatic deep water formation is contemporary and the EMT event replenished large parts of the deep waters in the early 1990s, the deep water layer formed by water masses from the Cretan Sea is much younger than the one from
20
the Adriatic Sea. The mean ages of both source regions are quite young with maximum mean ages in the deep water of ≈20 yr in the Aegean Sea, which highly correlates with the timing of the EMT event in the early 1990s, and≈10−17 yr in the Adriatic Sea (Fig. 18, 19). The mean age gradient with depth is much steeper in the Adriatic Sea than in the Cretan Sea which also show that the ventilation processes of both basins
25
OSD
10, 1647–1705, 2013Ventilation of the Mediterranean Sea
T. Stöven and T. Tanhua
Title Page
Abstract Introduction
Conclusions References
Tables Figures
◭ ◮
◭ ◮
Back Close
Full Screen / Esc
Printer-friendly Version
Interactive Discussion
Discussion
P
a
per
|
D
iscussion
P
a
per
|
Discussion
P
a
per
|
Discuss
ion
P
a
per
|
one transient tracer, and should not be used due to the uncertainty by using different transient tracers with the same “approached” constraints. Figures 20 and 21 show the mean age functions of CFC-12 and SF6 including the analytical error range of 4 %.
Figure 20 shows an example of the Cretan Sea deep water and Fig. 21 of the Adriatic Sea deep water. Both plots show the differences in water mass structure, in terms of
5
advective/diffusive ratios, despite of uncertainties in the mean age calculations. Neglecting any systematic errors in sampling and measurements, the ages of a TTD model are strongly influenced by the atmospheric history respectively the input function of a transient tracer. The atmospheric histories of CFC-12 and SF6are very well known
and the data can be used for every survey region due to the fast atmospheric mixing.
10
However, the input function of tritium in the Mediterranean is much more complex. The regional impact of tritium concentrations in precipitations and local transport processes is mostly unknown so that the obtained input function of tritium by Dreisigacker and Roether (1978) and Roether et al. (1992) is a rough estimate of a mean input of tritium into the surface layer of the ocean. Nevertheless, this input function is the best
exist-15
ing approach and the results of the offset corrected input function clearly show that the shape of the curve tends to be correct. The corrected input function of the EMed generates similar but still slightly higher mean ages compared to the ones obtained by CFC-12 and SF6(Fig. 16). This indicates that the corrected input function probably
still over estimates the mean input of tritium in the Eastern Mediterranean Sea. The
20
1IG-TTD provides significant results for the EMed using the tracer couple of CFC-12 and SF6, whereas SF6and tritium should be used with some caution.
The analysis of∆/Γratios in the WMed is restricted to only three stations (317, 323, 334) for which the concentration ratios between the two transient tracer couples were not usable with the 1IG-TTD model. The simple approach of water mass analysis
con-25
OSD
10, 1647–1705, 2013Ventilation of the Mediterranean Sea
T. Stöven and T. Tanhua
Title Page
Abstract Introduction
Conclusions References
Tables Figures
◭ ◮
◭ ◮
Back Close
Full Screen / Esc
Printer-friendly Version
Interactive Discussion
Discussion
P
a
per
|
D
iscussion
P
a
per
|
Discussion
P
a
per
|
Discuss
ion
P
a
per
in the EMed. The young and advective EMT water mass can be described by the 1IG-TTD, whereas the mean ages of the intermediate water and parts of the deep water in the EMed as well as the complete WMed might be better evaluated by a 2IG-TTD. The limiting difference also depends on the tracer concentration to some extend. Follow-ing that the mixed layer and parts of the pycnocline can also be described by the 1IG
5
model, although the tracer age difference is larger than 10 yr. To develop a clear math-ematical definition of validity areas of different tracer couples and distribution models will be part of future work.
6.2.2 2IG-TTD
The predefined 2IG-TTD was applied to several key stations in the EMed and WMed
10
(290, 305, 317, 323) shown in Fig. 5. As mentioned above we assumed fixed ∆/Γ
ratios for both TTDs so that ∆1/Γ1=1.4 and ∆2/Γ2=0.6, respectively and that the
mean agesΓ2<Γ1under the assumption that Γ2describes the younger water parcel.
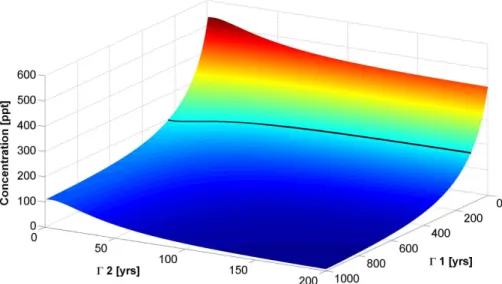
The concentration curve (Fig. 4) of each transient tracer were combined in one matrix to determine the intersections. The weighting factorαwas separated in 10 % steps and
15
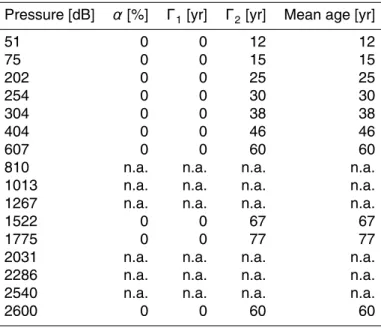
thus one yield eleven concentration matrices for each sample point. The determination of the intersections was carried out numerically to obtain a first overview of possible 2IG-TTD results which are shown in Table 1–4 where the mean ages are based on the concentrations of CFC-12, SF6and to some extent also tritium, see discussion below.
Station 290 in the Levantine Sea can be perfectly described by the 1IG-TTD which
20
is also indicated by the 2IG-TTD results. As shown in Table 1 the best fits for all sam-ples are obtained forα=0 which is the lower limiting case where the 2IG-TTD turns into a 1IG-TTD withΓ = Γ2. Hence, the mean ages of the 2IG-TTD are the same as
the ones from the constrained 1IG-TTD where∆/Γ =0.6. The missing data in Table 1 corresponds to the mean ages of 1IG-TTD’s with∆/Γ ratios <0.6. Figure 23 shows
25
in-OSD
10, 1647–1705, 2013Ventilation of the Mediterranean Sea
T. Stöven and T. Tanhua
Title Page
Abstract Introduction
Conclusions References
Tables Figures
◭ ◮
◭ ◮
Back Close
Full Screen / Esc
Printer-friendly Version
Interactive Discussion
Discussion
P
a
per
|
D
iscussion
P
a
per
|
Discussion
P
a
per
|
Discuss
ion
P
a
per
|
creasingαare of different extend. The rate of change is highest for tritium, followed by CFC-12 and lowest for SF6. This means that one can expect curve intersections under
the condition ofΓ2(Tritium)>Γ2(CFC-12)>Γ2(SF6) atα=0.
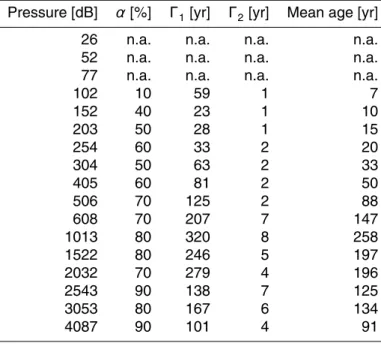
This condition can be found at station 305, which is a key station in the Ionian Sea where the 1IG-TTD is less constrainable in the intermediate and deep water. However,
5
CFC-12 and SF6 intersect each other for several choices of alpha, so we choose the
one with the lowest difference to the tritium intersection (Fig. 24). Table 2 shows the re-sults of the 2IG-TTD for station 305. The intermediate and deep water is characterized by highα values between 80–90 % indicating a stronger influence of more stationary water masses. Looking at the single results of the two mean ages of the distribution, the
10
total mean age is mainly influenced byΓ1 rather thanΓ2, whereat these single results are not significant for statements about real mixing processes. They are rather part of the predefined model characteristics and provide only tendencies of the water mass behavior. Whereas the total mean age from the constrained and exact determined TTD model describes the solved equation and thus a significant form of age of a water
par-15
cel. The highest mean age of 260 yr can be found at ≈1000 m depth, whereas the mean age decreases to 90 yr at the bottom layer. This is in full compliance with the expected younger water masses belonging to the ASOW. Compared to the 1IG-TTD, which indicates a mean age of 100 yr for most of the water column, the 2IG-TTD shows a more differentiated structure with a clear mean age maximum. Indicating that in this
20
case the 2IG-TTD provides more reasonable results.
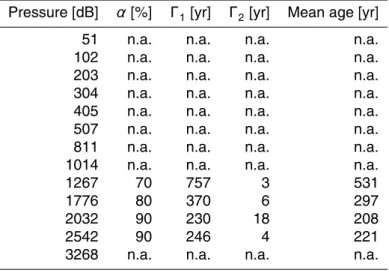
The order of tracer mean ages at station 317 in the Tyrrhenian Sea changes from the required standard condition intoΓ2(CFC-12)>Γ2(Tritium)>Γ2(SF6) for depths
shal-lower than 1250 m. This change in order is also the limit of the used model following that only four samples could be determined in the Tyrrhenian Sea (Tab. 3). The mean
25
OSD
10, 1647–1705, 2013Ventilation of the Mediterranean Sea
T. Stöven and T. Tanhua
Title Page
Abstract Introduction
Conclusions References
Tables Figures
◭ ◮
◭ ◮
Back Close
Full Screen / Esc
Printer-friendly Version
Interactive Discussion
Discussion
P
a
per
|
D
iscussion
P
a
per
|
Discussion
P
a
per
|
Discuss
ion
P
a
per
Γ1 are increasing with decreasing depth up to 757 yr. The used mean age matrices
have a size of 1000×200 following that a maximum mean age of 1000 yr can be deter-mined forΓ1. The shape of the curves of CFC-12 and SF6show the tendency to have
intersections beyond this limit and thus much higher mean ages for Γ1 than 1000 yr.
Another possible reason might be the assumed values of∆/Γ ratios of the 2IG-TTD.
5
With bigger mean age matrices or different choices of parameters the mean age should be also determinable in this part of the Mediterranean Sea.
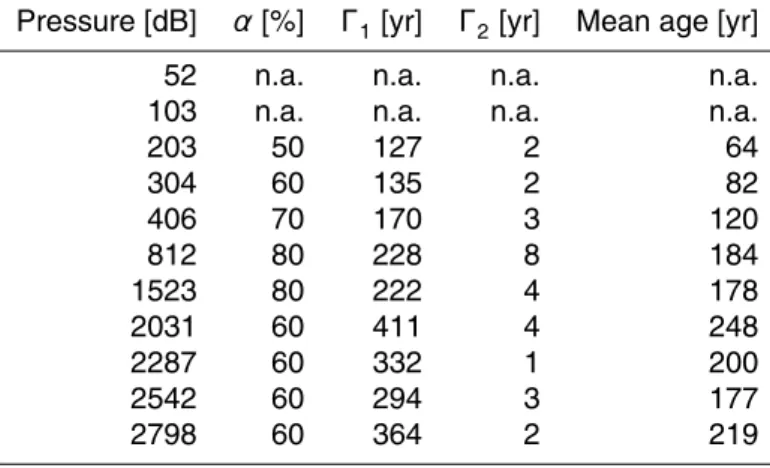
Station 323 in the Alghero–Provençial Basin shows significant characteristics of the newly formed deep and bottom water layer with a constantα of 60 % and mean ages between 170–250 yr (Table 4, Fig. 25). The lower values ofα besides relatively high
10
mean ages describe the extensive intrusion of young water masses into an old deep water layer. The interbasin circulation pattern between the Alghero–Provençial Basin and the Tyrrhenian Sea is characterized by highα values denoting less influence of advective water mass input at depth between 1500–800 m. However, the mean ages are relatively lower at this depth range than one would expect at station 323. Even
15
though the massive inflow of recently ventilated water of 2004–2006 might have notably lowered the mean age, one can still find the oldest water masses in the deep and bottom water. Suggesting that these water layers of the Western Basin were probably less mixed over decadal to centennial time scales. This illustrates the power of the 2IG-TTD approach: whereas the 1IG-TTD and tracer age concepts both indicates the
20
oldest waters at intermediate depths (e.g., Rhein et al., 1999; Schneider et al., 2013), our analysis show the highest mean ages in the deep water.
6.3 Best mean age approach
Figure 26 shows the mean age section in the EMed based on the combination of both TTD models. For non constrainable data points within the 1IG-TTD the predefined
25
OSD
10, 1647–1705, 2013Ventilation of the Mediterranean Sea
T. Stöven and T. Tanhua
Title Page
Abstract Introduction
Conclusions References
Tables Figures
◭ ◮
◭ ◮
Back Close
Full Screen / Esc
Printer-friendly Version
Interactive Discussion
Discussion
P
a
per
|
D
iscussion
P
a
per
|
Discussion
P
a
per
|
Discuss
ion
P
a
per
|
layers of the Levantine and Ionian Basin with mean ages between 60–80 yr and the newly formed deep water in the westerly parts of the Ionian Basin with mean ages between 120–160 yr. The mean age maximum layer extends from 600 m to 2000 m depth throughout the whole EMed withmean ages between 160–290 yr. The maximum mean age of 290 yr can be found in the TMZ in the Levantine Sea. This high mean age
5
layer is disrupted by lower mean ages of≈140 yr at the outflow areas of the Cretan Sea (station 299 and 290) as well as in the area near Rhodes (station 293) also with mean ages of≈140 yr.
7 Conclusions
We have described a comprehensive set of transient tracer data sampled during the
10
Meteor 84/3 cruise through the Mediterranean Sea in April 2011. For the first time mea-surements of SF6, CFC-12, tritium and
3
He were performed simultaneous on a cruise covering all major basins of the Mediterranean Sea. With this data set we constrain ventilation characteristics using the Transit Time Distribution (TTD) framework. In par-ticular we constrain the TTD assuming Inverse Gaussian (IG) shape of the TTD, either
15
as an one (1IG) or two-modal (2IG) distribution. The shape-determining parameters of the IG distribution are the width (∆) and mean age (Γ), the relative contribution of the two water-masses of a 2IG distribution (α), as well as the ratio of∆/Γthat is indicative of the diffusive to advective transport characteristic of a water mass.
Most parts of the EMed can be described by the 1IG-TTD model but with widely
20
different∆/Γcharacteristic of the two main deep-water sources, the Cretan Deep Wa-ter (CDW) and the Adriatic Sea Overflow WaWa-ter (ASOW), that have developed already their origin region rather than along the flow pathway. The Aegean Sea source water shows a more advective (i.e. a low∆/Γ ratio) behavior than the Adriatic Sea source water that have a more diffusive behavior. The majority of the deep water in the Eastern
25
OSD
10, 1647–1705, 2013Ventilation of the Mediterranean Sea
T. Stöven and T. Tanhua
Title Page
Abstract Introduction
Conclusions References
Tables Figures
◭ ◮
◭ ◮
Back Close
Full Screen / Esc
Printer-friendly Version
Interactive Discussion
Discussion
P
a
per
|
D
iscussion
P
a
per
|
Discussion
P
a
per
|
Discuss
ion
P
a
per
this event might explain the advective characteristics of this water-mass, having a mean age between 50 and 80 yr. The mean ages of the EMT-induced water masses in the Levantine Basin are thus still younger than the deep water in the deep Ionian Sea that has mean ages of approximately 120–160 yr using the 2IG TTD model. This is, at first sight, counter-intuitive considering the higher CFC-12 concentration in the deep Ionian
5
Sea due to recent contribution from the deep water source in the Adriatic Sea, com-pared to the Levantine Basin. All tracers show a distinct minimum at around 1000 m depth throughout the Med, although the origin of this Tracer Minimum Zone (TMZ) is slightly different for the eastern and western basins. For the EMed horizontal gradients in the∆/Γ ratio lead to a mean age distribution that is not directly correlated to the
10
tracer concentrations, with lower mean ages southeast of Crete, in the outflow region of water from the Cretan Sea, and higher ages in the Levantine Basin and Ionian Sea. Although most of the EMed ventilation can be described by a 1IG-TTD model, there are areas where this model of mixing cannot explain the observed tracer distributions. We found the 1IG-TTD approximation to be invalid for water samples with a
tracer-15
age difference exceeding≈10 yr (for the SF6-CFC-12 couple sampled in 2011). Thus
we use a 2IG model to constrain the TTD in the western part of the Ionian Sea and most of the WMed. The Western Mediterranean Transition (WMT) event with enhanced deep-water formation during the winters of 2004–2006 in the Western Basin can be characterized by the 2IG-TTD model, where the recently ventilated deep-water with
20
advective properties mixes with more stationary water of more diffusive character. The contemporaneous deep water in WMed has approximately 40% contribution of recently ventilated waters from the WMT, leading to mean ages of about 200 yr, which is similar or higher than the mean ages higher up in the water column that have lower CFC-12 and SF6 concentrations. This highlights the need to constrain the TTD in order to 25
OSD
10, 1647–1705, 2013Ventilation of the Mediterranean Sea
T. Stöven and T. Tanhua
Title Page
Abstract Introduction
Conclusions References
Tables Figures
◭ ◮
◭ ◮
Back Close
Full Screen / Esc
Printer-friendly Version
Interactive Discussion
Discussion
P
a
per
|
D
iscussion
P
a
per
|
Discussion
P
a
per
|
Discuss
ion
P
a
per
|
the Western Basin suggest that the TTD structure determined at station 323, SW of Sardinia, can be extrapolated to large parts of the WMed.
The results presented here points to the need to consider alternatives to the com-monly applied 1IG-TTD model, particularly in regions with variable ventilation or where more water masses mix with each other. For observational constrains of more
com-5
plex TTDs, a suite of transient tracers needs to be measured and interpreted. For such regions in the ocean, we show that a predefined 2IG-TTD provides a useful tool.
Acknowledgements. The authors want to thank the captain and crews on the research vessels Meteor for the excellent cooperation during the campaign. The Meteor cruise M84/3 and the transient tracer measurements were supported by a grant from the Deutsche 10
Forschungsgemeinschaft-Senatskommission für Ozenographie (DFG), and from a grant from the DFG; TA 317/3-1. Furthermore we would like to thank Wolfgang Roether for his support, help and inspiring discussions of particular matters of helium and tritium.
The service charges for this open access publication 15
have been covered by a Research Centre of the Helmholtz Association.
References
Artegiani, A., Bregant, D., Paschini, E., Pinardi, N., Raicich, F., and Russo, A.: The Adriatic Sea General Circulation, Part I: air-sea interactions and water mass structure, J. Phys. Oceanogr., 20
27, 1492–1514, 1996a. 1650
Artegiani, A., Bregant, D., Paschini, E., Pinardi, N., Raicich, F., and Russo, A.: The Adriatic Sea General Circulation, Part II: baroclinic circulation structure, J. Phys. Oceanogr., 27, 1515– 1532, 1996b. 1650
Brasseur, P., Beckers, J., Brankart, J., and Schoenauen, R.: Seasonal temperature and salinity 25
OSD
10, 1647–1705, 2013Ventilation of the Mediterranean Sea
T. Stöven and T. Tanhua
Title Page
Abstract Introduction
Conclusions References
Tables Figures
◭ ◮
◭ ◮
Back Close
Full Screen / Esc
Printer-friendly Version
Interactive Discussion
Discussion
P
a
per
|
D
iscussion
P
a
per
|
Discussion
P
a
per
|
Discuss
ion
P
a
per
Bullister, J. L.: Atmospheric CFC-11, CFC-12, CFC-113, CCl4 and SF6 Histo-ries (1910–2011), Carbon Dioxide Information Analysis Center, available at: http://cdiac.ornl.gov/oceans/new_atmCFC.html, 2011. 1653
Bullister, J. L. and Wisegarver, D.: The shipboard analysis of trace levels of sulfur hexafluo-ride, chlorofluorocarbon-11 and chlorofluorocarbon-12 in seawater, Deep-Sea Res. Pt. I, 55, 5
1063–1074, 2008. 1651, 1652
Bullister, J., Wisegarver, D., and Menzia, F.: The solubility of sulfur hexafluoride in water and seawater, Deep-Sea Res. Pt. I, 49, 175–187, 2002. 1653
Dreisigacker, E. and Roether, W.: Tritium and90Sr in North Atlantic surface water, Earth Planet. Sc. Lett., 38, 301–312, 1978. 1654, 1655, 1665
10
Ferronsky, V. and Polyakov, V.: Environmental Isotopes in the Hydrosphere, John Wiley & Sons, Chichester, New York, 1982. 1654
Hainbucher, D., Rubino, A., and Klein, B.: Water mass characteristics in the deep layers of the western Ionian Basin observed during May 2003, Geophys. Res. Lett., 33, L05608, 2006. 1650
15
Hall, T. and Plumb, R.: Age as a diagnostic of stratospheric transport, J. Geophys. Res., 99, 1059–1070, 1994. 1656
Huhn, O., Rhein, M., Hoppema, M., and van Heuven, S.: Decline of deep and bottom water ventilation and slowing down of anthropogenic carbon storage in the Weddell Sea, 1984– 2011, Deep-Sea Res. Pt. I, 76, 66–84, doi:10.1016/j.dsr.2013.01.005, 2013. 1658
20
IPCC: Radiative Forcing of Climate Change, Report of the Scientific Assessment Working Group of IPCC, in: Climate Change 1995, The Science of Climate Change, edited by: Houghton, J. T., Meira Filho, L. G., Callander, B. A., Harris, N., Kattenberg, A., and Maskell, K., Cambridge University Press, Cambridge, UK, 1996. 1653
Klein, B., Roether, W., Manca, B., Bregant, D., Beitzel, V., Kovacevic, V., and Luchetta, A.: The 25
large deep water transient in the eastern Mediterranean, Deep-Sea Res. Pt. I, 46, 371–414, doi:10.1016/S0967-0637(98)00075-2, 1999. 1649, 1650
Lascaratos, A., Williams, R., and Tragou, E.: A Mixed-Layer Study of the Formation of Levantine Intermediate Water, J. Geophys. Res., 98, 14739–14749, 1993. 1649
Lascaratos, A., Roether, W., Nittis, K., and Klein, B.: Recent changes in deep water forma-30
OSD
10, 1647–1705, 2013Ventilation of the Mediterranean Sea
T. Stöven and T. Tanhua
Title Page
Abstract Introduction
Conclusions References
Tables Figures
◭ ◮
◭ ◮
Back Close
Full Screen / Esc
Printer-friendly Version
Interactive Discussion
Discussion
P
a
per
|
D
iscussion
P
a
per
|
Discussion
P
a
per
|
Discuss
ion
P
a
per
|
Law, C., Watson, A., and Liddicoat, M.: Automated vacuum analysis of sulphur hexafluoride in seawater: derivation of the atmospheric trend (1970–1993) and potential as a transient tracer, Mar. Chem., 48, 57–69, 1994. 1651
Malanotte-Rizzoli, P. and Hecht, A.: Large scale properties of the eastern Mediterranean: a re-view., Oceanol. Acta, 11, 323–335, 1988. 1649
5
Rhein, M., Send, U., Klein, B., and Krahmann, G.: Interbasin deep water ex-change in the western Mediterranean, J. Geophys. Res. Oceans, 104, 23495–23508, doi:10.1029/1999JC900162, 1999. 1662, 1668
Roether, W. and Schlitzer, R.: Eastern Mediterranean deep water renewal on the basis of chlo-rofluoromethane and tritium data, Dynam. Atmos. Oceans, 15, 333–354, 1991. 1650 10
Roether, W., Schlosser, P., Kuntz, R., and Weiss, W.: Transient-tracer studies of the thermoha-line circulation of the Mediterranean, Reports in Meteorology and Oceanography, 41, 291– 317, 1992. 1654, 1665
Roether, W., Manca, B., Klein, B., Bregant, D., Georgopoulos, D., Beitzel, V., Kovacevic, V., and Luchetta, A.: Recent changes in eastern Mediterranean deep waters, Science, 271, 333– 15
335, 1996. 1649
Roether, W., Klein, B., Beitzel, V., and Manca, B.: Property distributions and transient-tracer ages in Levantine intermediate water in the eastern Mediterranean, J. Marine Syst., 18, 71– 87, 1998. 1649
Roether, W., Jean-Baptiste, P., Fourrè, E., and Sültenfuß, J.: The transient distribution of nuclear 20
weapon-generated tritium and its decay product3He in the Mediterranean Sea, 1952–2011, and their oceanographic potential, Ocean Sci., 10, 649–690, doi:10.5194/osd-10-649-2013, 2013. 1655, 1656, 1682
Rubino, A. and Hainbucher, D.: A large abrupt change in the abyssal water masses of the eastern Mediterranean, Geophys. Res. Lett., 34, L23607, doi:10.1029/2007GL031737, 2007. 25
1650
Schlitzer, R., Roether, W., Oster, H., Junghans, H., Hausmann, M., Johannsen, H., and Michelato, A.: Chlorofluoromethane and oxygen in the eastern Mediterranean, Deep-Sea Res. Pt. I, 38, 1531–1551, 1991. 1650
Schneider, A., Tanhua, T., Koertzinger, A., and Wallace, D.: High anthropogenic carbon content 30