Effects of Sodium Azide on the Abundance of
Prokaryotes and Viruses in Marine Samples
Christian Winter1*, Marie-Emmanuelle Kerros , Markus G. Weinbauer2,3 2,3
1Department of Marine Biology, University of Vienna, Vienna, Austria,2Microbial Ecology and Biogeochemistry Group, Centre National de la Recherche Scientifique, Laboratoire d’Oce´anographie de Villefranche, Villefranche-sur-Mer, France Laboratoire d’Oce ´anographie de Villefranche, Universite ´Pierre et Marie Curie-Paris 6, Villefranche-sur-Mer, France
Abstract
Flow cytometry is set to become the standard method for enumerating prokaryotes and viruses in marine samples. However, the samples need to be flash-frozen in liquid nitrogen directly after aldehyde fixation. Because liquid nitrogen may not always be available, we tested the potential of sodium azide as a preservative for prokaryotes and viruses in marine samples as a possible alternative. For that we conducted incubation experiments with untreated and sodium azide treated marine water samples at 4uC and room temperature. The data indicate that sodium azide cannot be used to maintain marine samples used for the enumeration of prokaryotes and viruses.
Citation:Winter C, Kerros M-E, Weinbauer MG (2012) Effects of Sodium Azide on the Abundance of Prokaryotes and Viruses in Marine Samples. PLoS ONE 7(5): e37597. doi:10.1371/journal.pone.0037597
Editor:Bryan A. White, University of Illinois, United States of America
ReceivedMarch 21, 2012;AcceptedApril 25, 2012;PublishedMay 18, 2012
Copyright:ß2012 Winter et al. This is an open-access article distributed under the terms of the Creative Commons Attribution License, which permits unrestricted use, distribution, and reproduction in any medium, provided the original author and source are credited.
Funding:Financial support was provided by the European Commission in the form of a Marie Curie postdoctoral fellowship to CW (project ILVIROMAB, no. 007712). The cruises were financed by Institut National des Sciences de l’Univers - Centre National de la Recherche Scientifique. The funders had no role in study design, data collection and analysis, decision to publish, or presentation of the manuscript.
Competing Interests:The authors have declared that no competing interests exist.
* E-mail: [email protected]
Introduction
Given the ubiquitous distribution of prokaryotes and viruses in marine environments, measurements of their abundance have become important parameters for many marine studies. Since only a small fraction of prokaryotes found in the ocean can be cultured on conventional media, it is necessary to enumerate prokaryotes directly. Current methods involve staining of prokaryotes with fluorochromes, followed by determining their abundance using epifluorescence microscopy [1,2] or flow cytometry [3]. Similarly, viral abundance can be determined directly using transmission electron microscopy [4] or, upon staining with fluorochromes, using epifluorescence microscopy [5,6] and flow cytometry [7]. Common to all of these direct-counting techniques is the need for the samples to be preserved with aldehyde-based fixatives. It was demonstrated that storage conditions of aldehyde-fixed samples for the enumeration of prokaryotes [8,9] and viruses [10] are critical and may substantially alter abundances. Especially, storage of fixed samples at 4uC leads to a substantial decrease in prokaryotic abundance within days and for viruses within hours.
Sodium azide (NaN3) is a potent bacteriostatic that is frequently
used to protect a diverse array of stock solutions (e.g., antibodies) and samples (e.g., milk, fecal specimens) from prokaryotic contaminants. NaN3 binds to heme-iron (cytochrome oxidase,
catalase; [11]) leading to chemical asphyxiation of affected cells. However, the bacteriostatic effects of NaN3appear to be limited to
Gram-negativeBacteria, whereas Gram-positiveBacteriaare largely resistant to the compound [12,13]. Based on studies conducted mostly with non-marine, archaeal isolates obtained from environ-ments such as acidic hot springs or solar salterns, the effects of NaN3on archaeal metabolism vary among taxa from susceptible
to resistant [14].
Currently, samples for the concomitant enumeration of prokaryotes and viruses need to be processed immediately after aldehyde fixation in order to avoid decay of prokaryotes and viruses [8,9,10]. This involves either the preparation of filter slides and subsequent storage at220uC for epifluorescence microscopy or flash-freezing of samples in liquid nitrogen and storage at
280uC for flow cytometry. However, this may not be possible in every case (e.g., large numbers of samples obtained at once, sample transport). Since flow cytometry is set to replace epifluorescence microscopy as the new standard method [15], availability of liquid nitrogen used to prepare flow cytometry samples for storage may become a limiting factor. The aim of this study was to test the potential of NaN3as a preservative for marine
samples to obtain accurate numbers of prokaryotes and viruses. However, our data indicate that preservation with NaN3is not a
viable alternative for aldehyde-fixation and flash-freezing.
Results and Discussion
Treatment effects
Initial prokaryotic and viral abundance was 7.76105ml21and
6.36106ml21for Exp. 1, 7.96105ml21and 24.56106ml21for Exp. 2, and 0.86105ml21 and 1.06106ml21 for Exp. 3, respectively. Overall, temperature significantly affected the tem-poral development of prokaryotic (Mann-WhitneyUtest: variation of U= 3.32–6.92, variation of p=,0.0001–0.0008) and viral abundance (Mann-Whitney U test: variation of U= 2.43–6.24, variation ofp=,0.0001–0.0150). Thus, for all experiments, the deviation from initial prokaryotic and viral abundances was smaller at 4uC as compared to 21uC (Table 1, Figure 1). However, the effects of NaN3 on abundances of prokaryotes and viruses
varied among the experiments (Tables 2–3).
PLoS ONE | www.plosone.org 1 May 2012 | Volume 7 | Issue 5 | e37597
Consistent differences were found in Exps. 1–2, where the deviation from initial prokaryotic abundance was significantly smaller at 4uC compared to 21uC-0.01% NaN3 (Tables 1–2;
Figure 1). Also, the deviation of prokaryotic abundance from initial conditions in Exps. 1–2 was significantly smaller at 4u C-0.005% NaN3and 4uC-0.01% compared to 21uC-0.005%, 21u
C-0.01%, and 4uC (Tables 1–2; Figure 1). However, in Exp. 3 the deviation from the original prokaryotic abundance was signifi-cantly higher only at 21uC compared to 21uC-0.01% NaN3, 4uC,
4uC-0.005%, and 4uC-0.01%, no further differences were found (Tables 1–2). Based on average values alone, a trend towards higher deviations from initial prokaryotic abundance from 21uC to 21uC-0.005% NaN3and 21uC-0.01% in Exps. 1–2 was
observ-able, however, this trend was reversed in Exp. 3 (Table 1). Changes in prokaryotic and viral abundance were positively correlated in Exp. 1 (r= 0.57, p,0.0001) and Exp. 2 (r= 0.67,
p,0.0001), but only weakly in Exp. 3 (r= 0.20,p= 0.0369). Water for Exp. 3 was retrieved from 2000 m depth and initial prokaryotic abundance was an order of magnitude lower as compared to Exps. 1–2. Thus, differences in the prokaryotic communities between surface and deep samples might be responsible for the varying effects of NaN3.
The influence of NaN3 on the deviation from initial viral
abundances was not consistent among experiments (Tables 1 and 3). In Exp. 1, the smallest change in viral abundance was found at 4uC-0.01% NaN3(Tables 1 and 3; Figure 1). The data for Exps.
2–3 are not significantly different among all treatments, however, low deviations from initial viral abundances were detected at 21uC in Exp. 2, and at 4uC in Exp. 3 (Tables 1 and 3). In Exp. 2, the highest deviation from initial viral abundance was detected at
21uC-0.01% NaN3 (Tables 1 and 3). Differences between
treatments were not consistently significant, however, high deviations from initial viral abundances were detected at 21u C-0.01% NaN3in Exp. 1 (Figure 1), and at 21uC-0.005% NaN3in
Exp. 3 (Tables 1 and 3). Thus, the data suggest that the addition of NaN3appears to stimulate virus production at 21uC.
Conclusions
Occasionally, it took more than one day for deviations from initial viral abundance to exceed 65% or 610% in Exps. 2–3 (Table 1). However, the influence of NaN3 on the temporal
development of viral abundance was variable among experiments. For surface samples (Exps. 1–2, Fig. 1), a final concentration of 0.01% (wt./vol.) NaN3 in combination with storage at 4uC
resulted in stable numbers of prokaryotes for 2–7 days (Table 1). However, this was not reproducible in Exp. 3 (Table 1), conducted with water from 2000 m depth. In summary, we conclude that NaN3 is not a viable alternative to preserve prokaryotes and
viruses in marine samples.
Materials and Methods
Ethics Statement
No specific permits were required for the described field studies. Sampling locations are not privately-owned or protected and sampling did not involve endangered or protected species.
Sampling and experimental set-up
Water samples (1 L; Niskin bottles) were retrieved from 5 m and 2000 m depth at the DYFAMED time series station (43u259N,
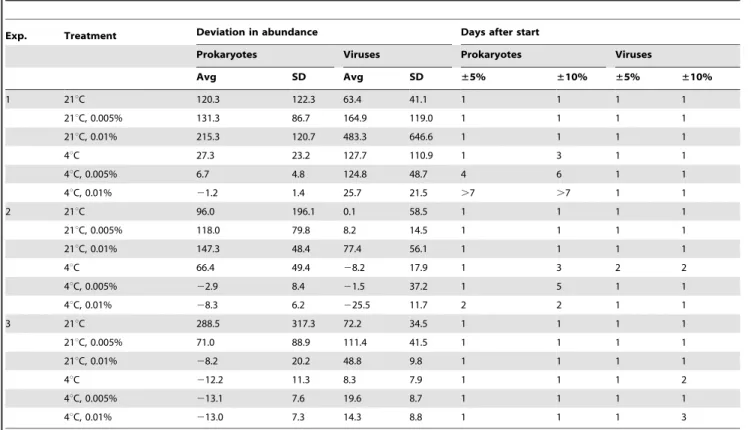
Table 1.Deviation from initial prokaryotic and viral abundance.
Exp. Treatment Deviation in abundance Days after start
Prokaryotes Viruses Prokaryotes Viruses
Avg SD Avg SD ±5% ±10% ±5% ±10%
1 21uC 120.3 122.3 63.4 41.1 1 1 1 1
21uC, 0.005% 131.3 86.7 164.9 119.0 1 1 1 1
21uC, 0.01% 215.3 120.7 483.3 646.6 1 1 1 1
4uC 27.3 23.2 127.7 110.9 1 3 1 1
4uC, 0.005% 6.7 4.8 124.8 48.7 4 6 1 1
4uC, 0.01% 21.2 1.4 25.7 21.5 .7 .7 1 1
2 21uC 96.0 196.1 0.1 58.5 1 1 1 1
21uC, 0.005% 118.0 79.8 8.2 14.5 1 1 1 1
21uC, 0.01% 147.3 48.4 77.4 56.1 1 1 1 1
4uC 66.4 49.4 28.2 17.9 1 3 2 2
4uC, 0.005% 22.9 8.4 21.5 37.2 1 5 1 1
4uC, 0.01% 28.3 6.2 225.5 11.7 2 2 1 1
3 21uC 288.5 317.3 72.2 34.5 1 1 1 1
21uC, 0.005% 71.0 88.9 111.4 41.5 1 1 1 1
21uC, 0.01% 28.2 20.2 48.8 9.8 1 1 1 1
4uC 212.2 11.3 8.3 7.9 1 1 1 2
4uC, 0.005% 213.1 7.6 19.6 8.7 1 1 1 1
4uC, 0.01% 213.0 7.3 14.3 8.8 1 1 1 3
Average (Avg in % of initial abundance) and standard deviation (SD) of the changes in prokaryotic and viral abundance relative to initial abundances for all treatments (temperature, NaN3concentration) during 7 days of incubation. The table also gives the number of days until prokaryotic and viral abundance changed more than65% and610% relative to initial abundances.
doi:10.1371/journal.pone.0037597.t001
Effects of Sodium Azide on Prokaryotes and Viruses
07u529E), and surface water was retrieved with a sterile glass bottle from the Bay of Villefranche (France). Within one hour of sampling, the untreated water samples were dispensed into 50 mL polycarbonate tubes. For each sample (DYFAMED 5 m: Exp. 1; Bay of Villefranche: Exp. 2; DYFAMED 2000 m: Exp. 3), the following 6 treatments, each in triplicates, were set-up: 21uC, 21uC and 0.005% (weight:volume) NaN3, 21uC and 0.01% NaN3, 4uC,
4uC and 0.005% NaN3, and 4uC with 0.01% NaN3. The
experiments were incubated in the dark for 7 days.
Prokaryotic and viral abundance
Samples (1.8 mL) for prokaryotic and viral abundance were retrieved every 24 hours, fixed with glutaraldhyde (0.5% final concentration) in the dark for 15 min, flash-frozen in liquid nitrogen, and stored at280uC until analysis. Upon thawing, the samples were stained with SYBR Green I (Invitrogen-Molecular Probes) and the abundance of prokaryotes and viruses was determined on a FACSCalibur (BD Biosciences) flow cytometer as previously described [3,7].
Figure 1. Example of the temporal development of prokaryotic and viral abundance.The figure shows the changes in prokaryotic and viral abundance relative to initial abundances in Exp. 1 (5 m depth, DYFAMED station) for each treatment. The data are given as the average of triplicate incubations and error bars represent standard deviations.
doi:10.1371/journal.pone.0037597.g001
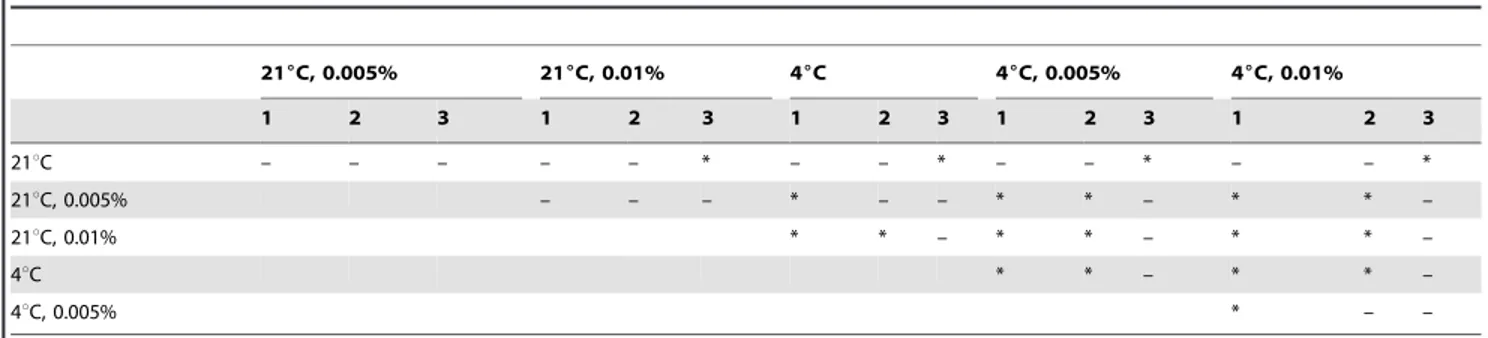
Table 2.Differences in the deviation from initial prokaryotic abundance among treatments.
216C, 0.005% 216C, 0.01% 46C 46C, 0.005% 46C, 0.01%
1 2 3 1 2 3 1 2 3 1 2 3 1 2 3
21uC – – – – – * – – * – – * – – *
21uC, 0.005% – – – * – – * * – * * –
21uC, 0.01% * * – * * – * * –
4uC * * – * * –
4uC, 0.005% * – –
The table shows the results of multiple Mann-Whitney tests to test for significant differences in the deviation from initial prokaryotic abundance among the treatments. Statistically significant differences (Bonferroni-corrected: p#0.0083) are indicated by ‘*’.
doi:10.1371/journal.pone.0037597.t002
Effects of Sodium Azide on Prokaryotes and Viruses
Statistical analyses
Kruskal-Wallis tests were used to test for significant differences among the treatments; significant results were further explored using Mann-Whitney pairwise comparisons. Spearman rank correlation coefficients (r) were used to test for significant correlations between the deviations from initial prokaryotic and viral abundance. Statistical tests were assumed significant at p -values#0.05. In case of multiple comparison tests,p-values were corrected according to Bonferroni [16].
Acknowledgments
We thank Jean-Claude Marty, Jacques Chiaverini, Floriane Girard, and Ste´phane Gouy for organizing the cruises to the DYFAMED site. The captains and crews ofRV Tethys IIare acknowledged for their assistance at sea.
Author Contributions
Conceived and designed the experiments: CW MGW. Performed the experiments: CW MEK. Analyzed the data: CW MEK. Wrote the paper: CW.
References
1. Hobbie JE, Daley RJ, Jasper S (1977) Use of nucleopore filters for counting bacteria by fluorescence microscopy. Appl Environ Microbiol 33: 1225–1228. 2. Porter KG, Feig YS (1980) The use of DAPI for identifying and counting aquatic
microflora. Limnol Oceanogr 25: 943–948.
3. Marie D, Partensky F, Vaulot D, Brussaard CPD (1999) Enumeration of phytoplankton, bacteria, and viruses in marine samples. In: Robinson JP, Darzynkiewicz Z, Dean PN, Orfao A, Rabinovitch PS, Stewart CC, Tanke HJ, Wheeless LL, eds. Current protocols in cytometry. New York: John Wiley & Sons, Inc. pp 11.11.1–11.11.15.
4. Bergh Ø, Børsheim KY, Bratbak G, Heldal M (1989) High abundance of viruses found in aquatic environments. Nature 340: 467–468.
5. Hennes KP, Suttle CA (1995) Direct counts of viruses in natural waters and laboratory cultures by epifluorescence microscopy. Limnol Oceanogr 40: 1050–1055.
6. Noble RT, Fuhrman JA (1998) Use of SYBR Green I for rapid epifluorescence counts of marine viruses and bacteria. Aquat Microb Ecol 14: 113–118. 7. Brussaard CPD (2004) Optimization of procedures for counting viruses by flow
cytometry. Appl Environ Microbiol 70: 1506–1513.
8. Gundersen K, Bratbak G, Heldal M (1996) Factors influencing the loss of bacteria in preserved seawater samples. Mar Ecol Prog Ser 137: 305–310. 9. Turley CM, Hughes DJ (1992) Effects of storage on direct estimates of bacterial
numbers of preserved seawater samples. Deep Sea Res Part A 39: 375–394. 10. Wen K, Ortmann AC, Suttle CA (2004) Accurate estimation of viral abundance
by epifluorescence microscopy. Appl Environ Microbiol 70: 3862–3867. 11. Heim WG, Appleman D, Pyrofrom HJ (1956) Effects of 3-amino 1,2,4-triazole
on catalase and other compounds. Am J Physiol 186: 19–23.
12. Gerencser VF, Weaver RH (1959) A new technique for the use of sodium azide (Hydrazoic Acid) as an inhibitive agent. Appl Microbiol 7: 113–115. 13. Lichstein HC, Soule MH (1944) Studies of the effect of sodium azide on
microbic growth and respiration. J Bacteriol 47: 239–251.
14. Scha¨fer G, Engelhard M, Mu¨ller V (1999) Bioenergetics of the Archaea. Microbiol Mol Biol Rev 63: 570–620.
15. Brussaard CPD, Payet JP, Winter C, Weinbauer MG (2010) Quantification of aquatic viruses by flow cytometry. In: Wilhelm SW, Weinbauer MG, Suttle CA, eds. Manual of Aquatic Viral Ecology ASLO. pp 102–109.
16. Rohlf FJ, Sokal RR (1994) Biometry W. H. Freeman & Co. Ltd. 880 p.
Table 3.Differences in the deviation from initial viral abundance among treatments.
216C, 0.005% 216C, 0.01% 46C 46C, 0.005% 46C, 0.01%
1 2 3 1 2 3 1 2 3 1 2 3 1 2 3
21uC * – – * * – – – * * – * * – *
21uC, 0.005% – * * – – * – – * * * *
21uC, 0.01% – * * – * * * * *
4uC – – – * – –
4uC, 0.005% * – –
The table shows the results of multiple Mann-Whitney tests to test for significant differences in the deviation from initial viral abundance among the treatments. Statistically significant differences (Bonferroni-corrected: p#0.0083) are indicated by ‘*’.
doi:10.1371/journal.pone.0037597.t003
Effects of Sodium Azide on Prokaryotes and Viruses