The Role of Liver in Determining Serum
Colon-Derived Uremic Solutes
Cheng-Jui Lin1,3,4*, Tai-Cherng Liou2,5, Chi-Feng Pan1,3, Pei-Chen Wu1, Fang-Ju Sun3,6, Hsuan-Liang Liu4, Han-Hsiang Chen1,3, Chih-Jen Wu1,5,7
1Division of Nephrology and Department of Internal Medicine, Mackay Memorial Hospital, Taipei, Taiwan,
2Division of Gastroenterology and Department of Internal Medicine, Mackay Memorial Hospital, Taipei, Taiwan,3Mackay Junior College of Medicine, Nursing and Management, Taipei, Taiwan,4Institute of Biotechnology, National Taipei University of Technology, Taipei, Taiwan,5Department of Medicine, Mackay Medical College, New Taipei City, Taiwan,6Department of Medical Research, Mackay Memorial Hospital, Taipei, Taiwan,7Graduate Institute of Medical Science, Taipei Medical University, Taipei, Taiwan
Abstract
Evidence has shown that indoxyl sulfate (IS) and p-cresyl sulfate (PCS) may be alternative predictors of clinical outcomes in chronic kidney disease (CKD). Both toxins are derived from the gastrointestinal tract and metabolised in the liver. However, it is unclear whether the liver affects the production of IS and PCS. Here, we explore the association between IS and PCS levels in liver cirrhosis and a CKD-based cohort (N = 115). Liver and kidney func-tion was assessed and classified by a Child-Pugh score (child A–C) and a modified version of the Modification of Diet in Renal Disease (MDRD) equation (Stages 1–4), respectively. An animal model was also used to confirm the two toxin levels in a case of liver fibrosis. In patients with early liver cirrhosis (child A), IS and PCS were significantly associated with CKD stages. In contrast, serum IS and PCS did not significantly change in advanced liver cirrhosis (child C). A stepwise multiple linear regression analysis also showed that T-PCS was significantly associated with stages of liver cirrhosis after adjusting for other confound-ing factors (B = -2.29,p= 0.012). Moreover, the serum and urine levels of T-PCS and T-IS were significantly lower in rats with liver failure than in those without (p<0.01,p<0.05 and
p<0.01,p<0.05, respectively). These results indicated that in addition to the kidneys, the liver was an essential and independent organ in determining serum IS and PCS levels. The production rate of IS and PCS was lower in patients with advanced liver cirrhosis.
Introduction
Metabolic disarray in chronic kidney disease (CKD) starts from the moment of progressive loss of kidney function as a result of the accumulation of a large number of solutes that are nor-mally excreted in urine. [1]. These retained uremic solutes are preferentially classified into three kinds of groups according to their physicochemical characteristics. [2]. Some com-pounds, such as urea, can be removed through dialysis. Many other retained compounds can-not. [3–5]. Protein-bound uremic toxins, including indoxyl sulphate (IS) and p-cresyl sulphate
OPEN ACCESS
Citation:Lin C-J, Liou T-C, Pan C-F, Wu P-C, Sun F-J, Liu H-L, et al. (2015) The Role of Liver in Determining Serum Colon-Derived Uremic Solutes. PLoS ONE 10(8): e0134590. doi:10.1371/journal. pone.0134590
Editor:Juan Sastre, University of Valencia, SPAIN
Received:February 1, 2015
Accepted:July 13, 2015
Published:August 10, 2015
Copyright:© 2015 Lin et al. This is an open access article distributed under the terms of theCreative Commons Attribution License, which permits unrestricted use, distribution, and reproduction in any medium, provided the original author and source are credited.
Data Availability Statement:All relevant data are within the paper.
Funding:This study was supported in part by a Grant from Taiwan National Science Council (NSC 102-2314-B-195-004) and Mackay Memorial Hospital (MMH-103-12, MMH-102-25 and MMH 102-29).
(PCS), belong to this group because high albumin binding limits their clearance. Previous in vitro studies have shown that the two toxins were capable of inducing the production of reac-tive oxygen species[6–8], and had a detrimental effect on endothelial function. [9–11]. This may further contribute to negative clinical outcomes in CKD, including infection-related hos-pitalisation, [12,13] renal function progression, [14,15] cardiovascular events and all-cause mortality. [13,16–18].
However, both IS and PCS emanate from the gastrointestinal tract. The precursors of the two solutes were generated by metabolism of dietary protein by the intestinal flora. Subse-quently, they were metabolised by the cytosolic enzymes of hepatocyte, before finally being secreted due to systemic circulation. Serum levels of IS and PCS depended primarily upon the severity of CKD, [14,19] and neither could be removed efficiently by haemodialysis or perito-neal dialysis. [20,21]. However, little evidence exists to demonstrate whether liver function is able to affect IS and PCS concentrations.
Thus, we propose a thesis that there is a close association between liver function and serum IS and PCS levels. Our study’s purpose is to investigate whether or not liver function is able to determine serum concentrations of IS and PCS in a cohort with liver cirrhosis.
Results
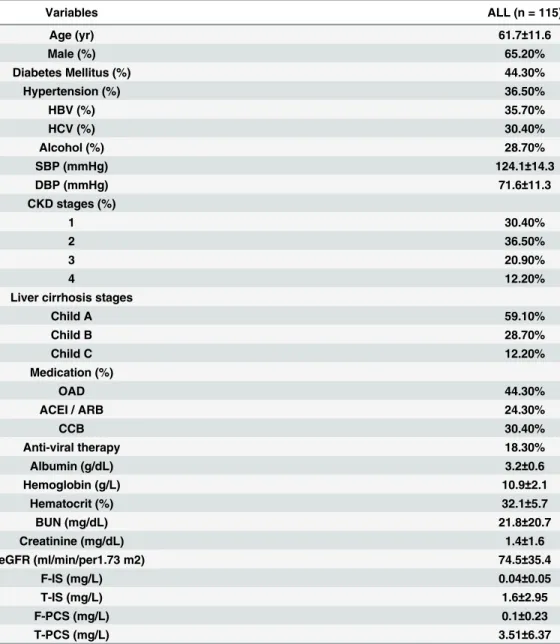
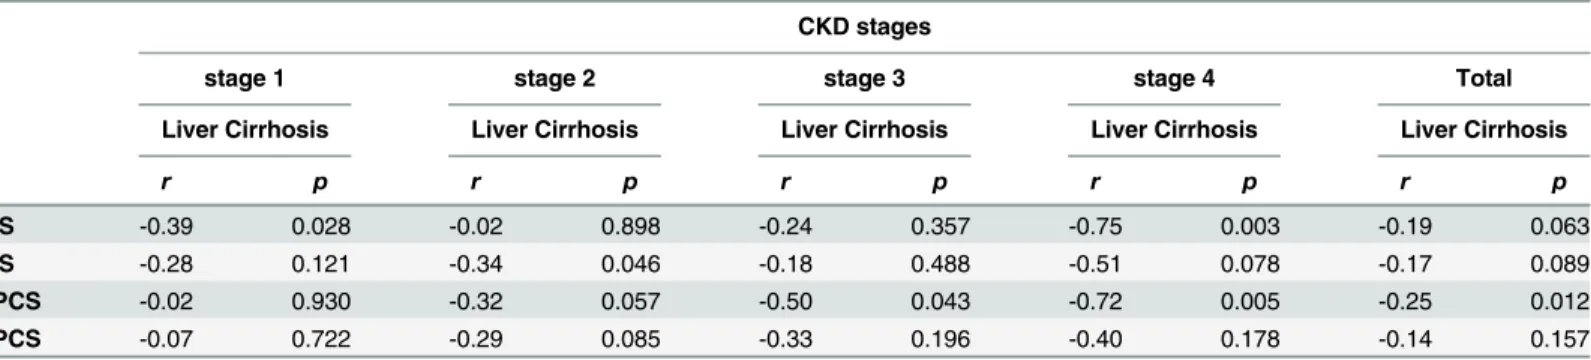
Table 1shows the demographic and clinical characteristics of patients. In all, 115 stable CKD patients (Stages 1–4) with liver cirrhosis (child A–C) were recruited for the study. The partici-pants consisted of 65.2% males and 34.8% females with a mean age of 61.7 ± 11.6 years. Over-all, 35.7% of the patients had HBV, 30.4% of the patients had HCV and 28.7% of the patients had alcoholic liver disease. The average free and total serum IS was 0.04 ± 0.05, 1.60 ± 2.95 mg/ L, respectively. The average free and total PCS was 0.10 ± 0.23, 3.51 ± 6.37 mg/l, respectively. Pearson’s analysis was used to determine the correlation between liver cirrhosis and protein-bound uremic toxins at different CKD stages, as shown inTable 2. In patients with early CKD (Stages 1–3), most serum protein-bound uremic toxins did not significantly correlate to a liver cirrhosis stage. However, total IS (T-IS) and total PCS (T-PCS) (r = -0.75,p= 0.003, r = -0.72,
p= 0.005, respectively) were negatively associated with liver stage in advanced CKD (Stage 4).
Table 3illustrates the correlation between CKD stages and protein-bound uremic toxins in different liver cirrhosis stages. Serum T-IS, free IS (F-IS), T-PCS and free PCS (F-PCS) showed a strong positive correlation with CKD stages in all patients with liver cirrhosis. This trend was also present in patients with child A liver cirrhosis. Only F-IS and F-PCS (r= 0.57,p= 0.001,
r= 0.45,p= 0.016, respectively) reached a level of significant change in child B liver cirrhosis. There was no obvious difference between serum uremic toxins and CKD stages in patients with child C liver cirrhosis.
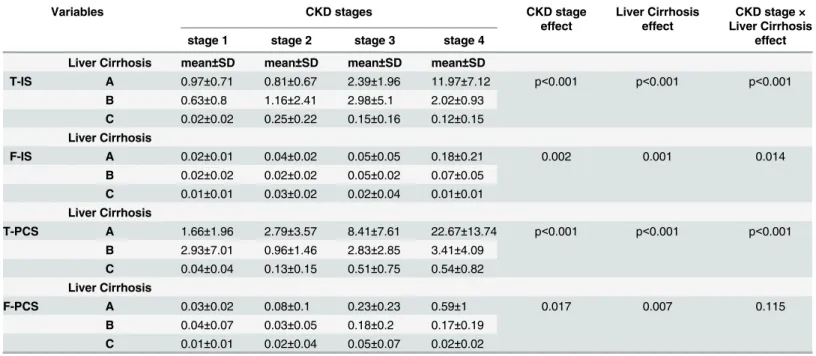
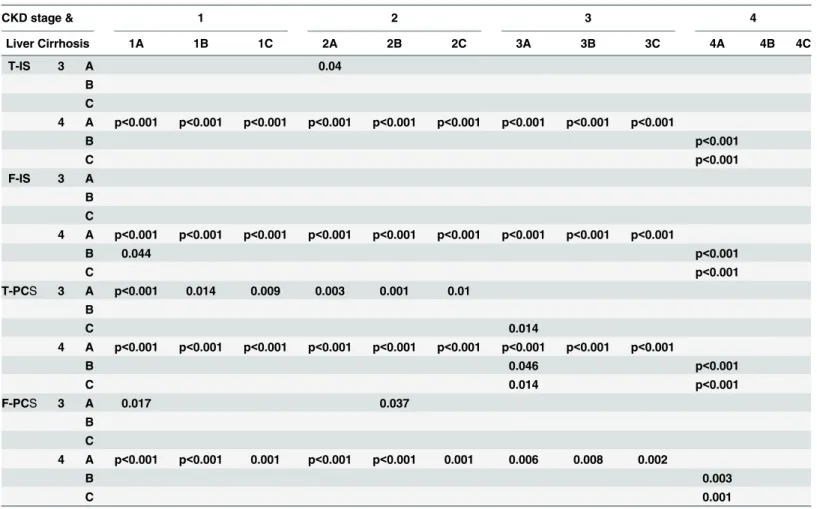
We used a two-way ANOVA with a Least Squares Means test to approach the interaction effect between CKD stages and liver cirrhosis stages.Table 4outlines the means and interac-tions in the different subgroups of CKD and liver cirrhosis stages. Only F-PCS did not have an interaction effect between different CKD and liver cirrhosis stage (p= 0.115). There was an interaction for F-IS, T-IS and T-PCS (please seeTable 5). The results showed that in patients with early CKD or liver cirrhosis, the serum protein-bound uremic toxin concentration did not change significantly. Until renal function declined (advanced CKD Stages 3 and 4), we found that the four toxin concentrations increased, reaching a significant difference as compared to different liver cirrhosis stages.Fig 1shows the four toxins at different CKD and liver cirrhosis stages.
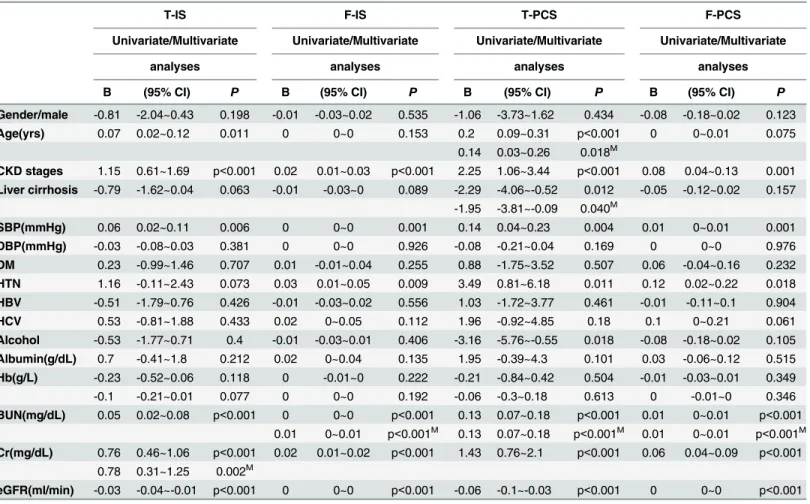
univariate analysis, T-IS was correlated with age (p= 0.01), CKD stage (p<0.01), systolic
blood pressure (p= 0.06), blood urea nitrogen (BUN) (p<0.001), creatinine (Cr) (p<0.001)
and estimated glomerular filtration rate (eGFR) (p<0.001); F-IS was associated with CKD
stage (p<0.001), systolic blood pressure (p<0.001), hypertension (HTN) (p<0.009), BUN
(p<0.001), Cr (p<0.001) and eGFR (p<0.001); T-PCS was correlated with age (p<0.001),
CKD stage (p<0.001), liver cirrhosis stage (p= 0.012), systolic blood pressure (p= 0.004),
HTN (p= 0.011), alcohol consumption (p= 0.018), BUN (p<0.001), Cr (p<0.001) and
eGFR (p<0.001); F-PCS was correlated with CKD stage (p= 0.001), systolic blood pressure
(p= 0.001), HTN (p= 0.018), BUN (p<0.001), Cr (p<0.001) and eGFR (p<0.001). After
adjusting for other confounding factors using a multivariate analysis, T-IS was only correlated with Cr (p= 0.002); F-IS was associated with BUN (p<0.001); T-PCS was correlated with age
(p= 0.018), liver cirrhosis stage (p= 0.040), and BUN (p<0.001); F-PCS was associated with
BUN (p<0.001).
Table 1. Baseline characteristics of the study patients.
Variables ALL (n = 115)
Age (yr) 61.7±11.6
Male (%) 65.20%
Diabetes Mellitus (%) 44.30%
Hypertension (%) 36.50%
HBV (%) 35.70%
HCV (%) 30.40%
Alcohol (%) 28.70%
SBP (mmHg) 124.1±14.3
DBP (mmHg) 71.6±11.3
CKD stages (%)
1 30.40%
2 36.50%
3 20.90%
4 12.20%
Liver cirrhosis stages
Child A 59.10%
Child B 28.70%
Child C 12.20%
Medication (%)
OAD 44.30%
ACEI / ARB 24.30%
CCB 30.40%
Anti-viral therapy 18.30%
Albumin (g/dL) 3.2±0.6
Hemoglobin (g/L) 10.9±2.1
Hematocrit (%) 32.1±5.7
BUN (mg/dL) 21.8±20.7
Creatinine (mg/dL) 1.4±1.6
eGFR (ml/min/per1.73 m2) 74.5±35.4
F-IS (mg/L) 0.04±0.05
T-IS (mg/L) 1.6±2.95
F-PCS (mg/L) 0.1±0.23
T-PCS (mg/L) 3.51±6.37
In order to confirm the effect of the liver on serum protein-bound uremic toxins, an animal model with CBD ligation was used for the study. The liver function of the study group increased dramatically as compared to the control group (AST: 81.2 ±11.4 vs. 804.1 ± 215.6) (ALT: 51.5 ± 18.6 vs. 154.7 ± 47.6). There was a significant reduction of serum T-IS (2.5±0.5 vs. 0.3±0.1 mg/L, p<0.01) (N = 5) concentrations before and three weeks after bile duct ligation
(Fig 2A). The T-PCS level was extremely low before and after surgery, and it did not demon-strate a statistically significant change (0.05 ± 0.03 vs. 0.03 ± 0.04 mg/L, p = NS) (N = 5) (Fig 2B). The urine levels of T-IS and T-PCS were also markedly decreased in rats with liver failure (55.4 ± 13.1 vs. 12.2 ± 13.5, 16.9 ± 10.1 vs. 4.9 ± 3.2 mg/L, respectively) (p<0.05) (N = 5) (Fig 3).
Discussion
Our results showed that kidney function was a predominant factor in determining serum IS and PCS levels in patients with early liver cirrhosis. However, this effect was not present in patients with advanced liver cirrhosis. The two toxin concentrations did not increase in patients with advanced liver and kidney failure. Thus, we demonstrated that in addition to the kidneys, the liver function was an independent factor affecting serum IS and PCS levels.
In recent years, a growing number of publications confirmed the toxicity of IS and PCS from in vitro studies and supported their role in vascular and renal disease progression, con-tributing to adverse outcomes in CKD patients. [6–8,12–18]. Thus, this evidence indicated that IS and PCS were not only a vascular toxin but were also nephrotoxins. As we know, the two toxins were generated from the gastrointestinal tract. Indole was the precursor of IS from the fermentation of tryptophan by intestinal flora. [22]. Nevertheless, fermentation of the amino acid tyrosin generates 4-hydroxylphenylacetic acid, which is decarboxylated to p-cresol
Table 2. Correlation between liver cirrhosis and T-IS, F-IS, T-PCS and F-PCS in different CKD sages by Pearson’s analysis.
CKD stages
stage 1 stage 2 stage 3 stage 4 Total
Liver Cirrhosis Liver Cirrhosis Liver Cirrhosis Liver Cirrhosis Liver Cirrhosis
r p r p r p r p r p
T-IS -0.39 0.028 -0.02 0.898 -0.24 0.357 -0.75 0.003 -0.19 0.063
F-IS -0.28 0.121 -0.34 0.046 -0.18 0.488 -0.51 0.078 -0.17 0.089
T-PCS -0.02 0.930 -0.32 0.057 -0.50 0.043 -0.72 0.005 -0.25 0.012
F-PCS -0.07 0.722 -0.29 0.085 -0.33 0.196 -0.40 0.178 -0.14 0.157
doi:10.1371/journal.pone.0134590.t002
Table 3. Correlation between CKD stages and T-IS, F-IS, T-PCS and F-PCS in different liver cirrhosis sages by Pearson’s analysis.
Liver Cirrhosis
child A child B child C Total
CKD CKD CKD CKD
r p r p r p r p
T-IS 0.60 p<0.001 0.28 0.147 0.14 0.663 0.39 p<0.001
F-IS 0.45 p<0.001 0.57 0.001 0.06 0.845 0.36 p<0.001
T-PCS 0.64 p<0.001 0.07 0.724 0.41 0.185 0.36 p<0.001
F-PCS 0.45 p<0.001 0.45 0.016 0.17 0.602 0.34 p<0.001
or demethylated to phenol. [23]. These precursors were absorbed, passing through the intesti-nal mucosa, before being further metabolised by a hepatic cytosolic sulfotransferase and glu-curonyltransferase to indoxyl sulfate, p-cresyl sulfate or p-cresyl glucuronide, respectively. Subsequently, the uremic solutes were secreted to systemic circulation, and were finally removed by renal tubular secretion. [13,14]. Thus, serum IS and PCS in vivo might be deter-mined by the rate of the generation and accumulation of toxic end products from the gut, intes-tinal flora, liver and kidney.
A previous report by Aronov et al. confirmed the colonic origin of IS and PCS by comparing HD patients with and without a colon. [24]. In addition, indoxyl-β-D-glucuronide, 5-hydro-xyindole andα-phenylacetyl-L-glutamine were also identified as colon-derived uremic solutes. The modulation of gut microbiota was regarded as being different approaches to the same the-ory. One study evaluating the effects of probiotics on serum uremic solutes in a HD cohort [25] showed that serum levels of IS were reduced, probably due to the lower intestinal production of toxins. The use of synbiotics was reported to decrease serum PCS levels in HD patients. [26]. One another small study also suggested that the prebiotic oligofructose-inulin could signifi-cantly reduce PCS generation and serum concentrations in HD patients. [27]. The researcher’s findings indicated that changing the intestinal microbiota was an alternative way of affecting IS and PCS concentrations. This evidence supports the thesis of gut-kidney axis in patients with CKD.
Advanced chronic liver disease is responsible for a significant number of physiological changes affecting circulation and kidney perfusion. These changes are associated with primary and secondary kidney disease and have a marked impact on survival. [28]. The glomerular fil-tration rate was decreased in patients with advanced liver disease, especially those with hepa-toranal syndrome. [29]. However, there are very few studies that have investigated whether or not the liver is also an essential organ affecting production of protein-bound uremic solutes. From our results, IS and PCS levels were increased in patients with CKD and early liver cirrho-sis. However, the two solutes were lower in CKD with advanced liver cirrhocirrho-sis. The results
Table 4. The mean of T-IS, F-IS, T-PCS.F-PC in different CKD and liver Cirrhosis stages and their interaction analyzed by two-way ANOVA.
Variables CKD stages CKD stage Liver Cirrhosis CKD stage ×
effect effect Liver Cirrhosis
stage 1 stage 2 stage 3 stage 4 effect
Liver Cirrhosis mean±SD mean±SD mean±SD mean±SD
T-IS A 0.97±0.71 0.81±0.67 2.39±1.96 11.97±7.12 p<0.001 p<0.001 p<0.001 B 0.63±0.8 1.16±2.41 2.98±5.1 2.02±0.93
C 0.02±0.02 0.25±0.22 0.15±0.16 0.12±0.15
Liver Cirrhosis
F-IS A 0.02±0.01 0.04±0.02 0.05±0.05 0.18±0.21 0.002 0.001 0.014
B 0.02±0.02 0.02±0.02 0.05±0.02 0.07±0.05 C 0.01±0.01 0.03±0.02 0.02±0.04 0.01±0.01
Liver Cirrhosis
T-PCS A 1.66±1.96 2.79±3.57 8.41±7.61 22.67±13.74 p<0.001 p<0.001 p<0.001 B 2.93±7.01 0.96±1.46 2.83±2.85 3.41±4.09
C 0.04±0.04 0.13±0.15 0.51±0.75 0.54±0.82
Liver Cirrhosis
F-PCS A 0.03±0.02 0.08±0.1 0.23±0.23 0.59±1 0.017 0.007 0.115
B 0.04±0.07 0.03±0.05 0.18±0.2 0.17±0.19 C 0.01±0.01 0.02±0.04 0.05±0.07 0.02±0.02
indicated that the effect of toxin accumulation from kidney failure was counteracted by liver failure. Studies using animal models with liver failure also confirmed this effect. Thus, we sup-posed that IS and PCS were significantly dependent on both kidney and liver function.
Several kinds of cytoplasmic sulphotransferases, including phenolsulfotransferases, estrogen sulfotransferase and dehydroepiandrosterone sulphotransferase were expressed in the human liver. Sulfotransferase activity was diminished in liver disease due to a lack of enzyme presence. [30]. Activity of the hepatic enzyme responsible for the modification of these precursors might be lower in the case of liver cirrhosis, leading to a lower generation of the two toxins, though we do not have direct evidence of this point. However, it is unclear on whether having a lower toxin level would have any effect on clinical outcomes. We assume that the gut-kidney axis should be changed to the gut-liver-kidney axis.
There are also two other factors that affect serum toxin concentrations. One is low protein diet, which has been reported to delay CKD progression. [31]. Thus, a low protein diet might affect the serum IS and PCS levels. Patel KP et al. demonstrated that the production of IS and PCS is different in vegetarians versus omnivores. [32]. PCS and IS production rates are markedly lower in vegetarians than they are in individuals that consume an unrestricted diet. The second factor in decreasing toxin concentration is the use of intestinal sorbents, such as AST-120 (Kremezin). Although the effect in delaying kidney function progression was not
Table 5. Interaction analysis between patients with different CKD and liver cirrhosis stages for protein-bound uremic toxins by Least Squares Means.
CKD stage & 1 2 3 4
Liver Cirrhosis 1A 1B 1C 2A 2B 2C 3A 3B 3C 4A 4B 4C
T-IS 3 A 0.04
B
C
4 A p<0.001 p<0.001 p<0.001 p<0.001 p<0.001 p<0.001 p<0.001 p<0.001 p<0.001
B p<0.001
C p<0.001
F-IS 3 A
B
C
4 A p<0.001 p<0.001 p<0.001 p<0.001 p<0.001 p<0.001 p<0.001 p<0.001 p<0.001
B 0.044 p<0.001
C p<0.001
T-PCS 3 A p<0.001 0.014 0.009 0.003 0.001 0.01 B
C 0.014
4 A p<0.001 p<0.001 p<0.001 p<0.001 p<0.001 p<0.001 p<0.001 p<0.001 p<0.001
B 0.046 p<0.001
C 0.014 p<0.001
F-PCS 3 A 0.017 0.037
B
C
4 A p<0.001 p<0.001 0.001 p<0.001 p<0.001 0.001 0.006 0.008 0.002
B 0.003
C 0.001
found to be significant, AST-120 therapy could lower serum IS through the intestinal absorp-tion of indoles and interference of tryptophan metabolism. [33,34].
This study has some limitations. First, the sample size was small and all of the subjects were enrolled from one medical centre. Second, urine samples were not available in our study, so we could not analyse the change of urinary IS and PCS. This analysis could have provided more information about the production of the two solutes. Third, liver function was only assessed and classified by using the Child-Pugh score, rather than using the Indocyanine green (ICG) test. The latter is a more reliable test for determining liver function. In addition, we did not measure the activity of the hepatic cytosolic enzyme for precursor modification. Thus, addi-tional prospective investigations are required to answer these questions.
In summary, our study demonstrated that, in addition to the kidneys, the liver affected serum IS and PCS levels. The gut-kidney axis in CKD should be modified to the gut-liver-kid-ney axis. Further studies are required to show whether lower levels of uremic toxins have any clinical significance in CKD and liver cirrhosis patients.
Materials and Methods
Subjects
This study recruited 115 stable patients with liver cirrhosis and CKD (Stage 1 to Stage 5) receiv-ing treatment from a medical centre. Patients with acute infection, malignancy, with the excep-tion of hepatitis-related hepatoma, or those who were younger than 18 years were excluded. The aetiology of CKD in the patients included type 2 diabetic nephropathy (44.3%) and chronic glomerular nephritis (cGN) (55.7%). The study was performed according to the
Fig 1. Serum levels of protein-bound uremic toxins (A) T-IS, (B) F-IS, (C) T-PCS and (D) F-PCS in patients with different CKD and liver cirrhosis.
Table 6. Univariate and multivariate (Stepwise) linear regression analyses for evaluating the relationship between independent variables and clini-cal outcomes in CKD and liver cirrhosis patients.
T-IS F-IS T-PCS F-PCS
Univariate/Multivariate Univariate/Multivariate Univariate/Multivariate Univariate/Multivariate
analyses analyses analyses analyses
B (95% CI) P B (95% CI) P B (95% CI) P B (95% CI) P
Gender/male -0.81 -2.04~0.43 0.198 -0.01 -0.03~0.02 0.535 -1.06 -3.73~1.62 0.434 -0.08 -0.18~0.02 0.123
Age(yrs) 0.07 0.02~0.12 0.011 0 0~0 0.153 0.2 0.09~0.31 p<0.001 0 0~0.01 0.075
0.14 0.03~0.26 0.018M
CKD stages 1.15 0.61~1.69 p<0.001 0.02 0.01~0.03 p<0.001 2.25 1.06~3.44 p<0.001 0.08 0.04~0.13 0.001
Liver cirrhosis -0.79 -1.62~0.04 0.063 -0.01 -0.03~0 0.089 -2.29 -4.06~-0.52 0.012 -0.05 -0.12~0.02 0.157 -1.95 -3.81~-0.09 0.040M
SBP(mmHg) 0.06 0.02~0.11 0.006 0 0~0 0.001 0.14 0.04~0.23 0.004 0.01 0~0.01 0.001
DBP(mmHg) -0.03 -0.08~0.03 0.381 0 0~0 0.926 -0.08 -0.21~0.04 0.169 0 0~0 0.976
DM 0.23 -0.99~1.46 0.707 0.01 -0.01~0.04 0.255 0.88 -1.75~3.52 0.507 0.06 -0.04~0.16 0.232
HTN 1.16 -0.11~2.43 0.073 0.03 0.01~0.05 0.009 3.49 0.81~6.18 0.011 0.12 0.02~0.22 0.018
HBV -0.51 -1.79~0.76 0.426 -0.01 -0.03~0.02 0.556 1.03 -1.72~3.77 0.461 -0.01 -0.11~0.1 0.904
HCV 0.53 -0.81~1.88 0.433 0.02 0~0.05 0.112 1.96 -0.92~4.85 0.18 0.1 0~0.21 0.061
Alcohol -0.53 -1.77~0.71 0.4 -0.01 -0.03~0.01 0.406 -3.16 -5.76~-0.55 0.018 -0.08 -0.18~0.02 0.105
Albumin(g/dL) 0.7 -0.41~1.8 0.212 0.02 0~0.04 0.135 1.95 -0.39~4.3 0.101 0.03 -0.06~0.12 0.515
Hb(g/L) -0.23 -0.52~0.06 0.118 0 -0.01~0 0.222 -0.21 -0.84~0.42 0.504 -0.01 -0.03~0.01 0.349
-0.1 -0.21~0.01 0.077 0 0~0 0.192 -0.06 -0.3~0.18 0.613 0 -0.01~0 0.346
BUN(mg/dL) 0.05 0.02~0.08 p<0.001 0 0~0 p<0.001 0.13 0.07~0.18 p<0.001 0.01 0~0.01 p<0.001 0.01 0~0.01 p<0.001M 0.13 0.07~0.18 p<0.001M 0.01 0~0.01 p<0.001M Cr(mg/dL) 0.76 0.46~1.06 p<0.001 0.02 0.01~0.02 p<0.001 1.43 0.76~2.1 p<0.001 0.06 0.04~0.09 p<0.001
0.78 0.31~1.25 0.002M
eGFR(ml/min) -0.03 -0.04~-0.01 p<0.001 0 0~0 p<0.001 -0.06 -0.1~-0.03 p<0.001 0 0~0 p<0.001
M: Multivariate stepwise linear regression analysis
doi:10.1371/journal.pone.0134590.t006
principles of the Declaration of Helsinki and the ethics committee of the Mackay Memorial Hospital approved the study. All of the patients signed an informed consent form before partic-ipating in the study.
Laboratory assessment
After enrolment in the study, fasting blood samples were obtained for all CKD patients. The estimated GFR (eGFR) was calculated using a modified version of the Modification of Diet in Renal Disease (MDRD) equation, as follows: 175Scr^-1.154Age^-0.2030.742 (if female).
The following data were collected: BUN (md/dl), creatinine (mg/dl), haemoglobin (g/dl), hae-matocrit (%), albumin (g/dl), IS (mg/l), and PCS (mg/l). The bromocresol green method was used for the determination of albumin levels. The Child-Pugh score was used to assess the sta-tus of liver cirrhosis, including five clinical measures of liver disease.
Serum IS and PCS were measured with LC-MS/MS (4000 QTRAP, USA). In brief, serum samples were prepared and deproteinised by heat denaturation. The free concentrations of IS and PCS were measured in serum ultrafiltrates, obtained by using Microcon YM-30 separators (Millipore, Billerica, MA, USA). HPLC was performed at room temperature using a dC18 col-umn (3.0 × 50 mm, Atlantis, Waters). The buffers used were (A) 0.1% formic acid and (B) 1mM NH4OAc + 0.1% formic acid in 100% acetonitrile. The flow rate was 0.6 mL/min with a
3.5-min gradient cycling from 90% A/10% B to 10% A/90% B. Under these conditions, both PCS and IS were eluted at 2.73 and 2.48 min, respectively. Standard curves for PCS and IS were set at 1, 5, 10, 50, 250, 500 and 1000μg/L; both were processed in the same manner as
the serum samples, and they correlated with the serum samples with average r2values of 0.996 ± 0.003. These samples were diluted if the IS or PCS concentrations exceeded the stan-dard curve. Quantitative results were obtained and calculated in terms of their concentrations (mg/L). The sensitivity of this assay was 1μg/L for PCS and 1μg/L for IS.
Experimental model of liver fibrosis
Male Sprague-Dawley rats (about 260 g) were used in this study. On day two, the common bile ducts were double ligated under halothane anaesthesia. PCS and IS concentrations in the serum and urine were measured before the operation and three weeks after the operation. The
local committee for care and use of laboratory animals at the Mackay Memorial Hospital approved this study.
Statistical analysis
The demographic data were expressed as the mean ± standard deviation (SD). A Pearson’s cor-relation coefficient was used to analyse the cor-relationship of serum IS or PCS levels with the liver cirrhosis stages and CKD stages. The interaction effect between the CKD stages and liver cir-rhosis stages for the increased means of T-IS, F-IS, T-IS and T-PCS were examined using a two-way ANOVA with a Least Squares Means multiple comparison test. In addition, univariate and multivariate (Stepwise) linear regression analyses were used to analyse the relationship between IS or PCS with other independent variables in all of the study patients. In the animal model with liver failure, the serum T-IS and T-PCS levels before and three weeks after surgery were compared using Student t-tests. A value ofP<0.05 was considered statistically significant.
All of the statistical analyses were conducted using the SPSS v.17.0 software programme (SPSS, Chicago, IL).
Acknowledgments
We would like to thank all the patients who were involved in this study. This study was sup-ported in part by a Grant from Taiwan National Science Council (NSC 102-2314-B-195-004) and Mackay Memorial Hospital (MMH-102-25 and MMH 102–29).
Author Contributions
Conceived and designed the experiments: CJL TCL CJW. Performed the experiments: CJL TCL. Analyzed the data: CJL FJS. Contributed reagents/materials/analysis tools: CJL TCL. Wrote the paper: CJL CJW. Revised manuscript: HLL. Provided lab equipment: HHC. Reviewed medical record: CFP PCW.
References
1. Duranton F, Cohen G, De Smet R, Rodriguez M, Jankowski J, Vanholder R, et al, European Uraemic Toxin Work Group (EUTox). (2012) Normal and pathologic concentrations of uremic toxins. J Am Soc Nephrol 23: 1258–1270. doi:10.1681/ASN.2011121175PMID:22626821
2. Vanholder R, De Smet R, Glorieux G, Argiles A, Baurmeister U, Brunet P, et al, European Uraemic Toxin Work Group (EUTox). (2003) Review on uremic toxin classification, concentration, and interindi-vidual variability. Kidney Int 63: 1934–1943. PMID:12675874
3. Vanholder RC, De Smet RV, Ringoir SM. (1992) Assessment of urea and other uremic markers for quantification of dialysis efficacy. Clin Chem 38: 1429–1436. PMID:1643710
4. Lesaffer G, De Smet R, Lameire N, Dhondt A, Duym P, Vanholder R. (2000) Intradialytic removal of pro-tein-bound uraemic toxins: role of solute characteristics and of dialyser membrane. Nephrol Dial Trans-plant 15: 50–57.
5. Eloot S, Torremans A, De Smet R, Marescau B, De Deyn PP, Verdonck P, et al. (2007) Complex com-partmental behavior of small water-soluble uremic retention solutes: evaluation by direct measure-ments in plasma and erythrocytes. Am J Kidney Dis 50: 279–288. PMID:17660029
6. Dou L, Bertrand E, Cerini C, Faure V, Sampol J, Vanholder R, et al. (2004) The uremic solutes p-cresol and indoxyl sulfate inhibit endothelial proliferation and wound repair. Kidney Int 65: 442–451. PMID: 14717914
7. Owada S, Goto S, Bannai K, Hayashi H, Nishijima F, Niwa T. (2008) Indoxyl sulfate reduces superoxide scavenging activity in the kidneys of normal and uremic rats. Am J Nephrol 28: 446–454. PMID: 18160814
8. Yu M, Kim YJ, Kang DH. (2011) Indoxyl sulfate-induced endothelial dysfunction in patients with chronic kidney disease via an induction of oxidative stress. Clin J Am Soc Nephrol 6: 30–39. doi:10.2215/CJN.
9. Dou L, Cerini C, Brunet P, Guilianelli C, Moal V, Grau G, et al. (2002) P-cresol, a uremic toxin, decreases endothelial cell response to inflammatory cytokines. Kidney Int 62: 1999–2009. PMID: 12427124
10. Tumur Z, Niwa T. (2009) Indoxyl sulfate inhibits NO production and cell viability by inducing oxidative stress in vascular endothelial cells. Am J Nephrol 29: 551–557. doi:10.1159/000191468PMID: 19129694
11. Meijers BK, Van Kerckhoven S, Verbeke K, Dehaen W, Vanrenterghem Y, Hoylaerts MF, et al. (2009) The uremic retention solute p-cresyl sulfate and markers of endothelial damage. Am J Kidney Dis 54: 891–901. doi:10.1053/j.ajkd.2009.04.022PMID:19615803
12. De Smet R, Van Kaer J, Van Vlem B, De Cubber A, Brunet P, Lameire N,et al. (2003) Toxicity of free p-cresol: A prospective and cross-sectional analysis. Clin Chem 49: 470–478. PMID:12600960 13. Lin CJ, Wu V,Wu PC, Wu CJ. (2015) Meta-Analysis of the Associations of p-Cresyl Sulfate (PCS) and
Indoxyl Sulfate (IS) with Cardiovascular Events and All-Cause Mortality in Patients with Chronic Renal Failure. PLoS One 10 [Epub ahead of print].
14. Liabeuf S, Barreto DV, Barreto FC, Meert N, Glorieux G, Schepers E, et al, European Uraemic Toxin Work Group (EUTox). (2010) Free p-cresylsulphate is a predictor of mortality in patients at different stages of chronic kidney disease. Nephrol Dial Transplant 25: 1183–1191. doi:10.1093/ndt/gfp592
PMID:19914995
15. Wu IW, Hsu KH, Lee CC, Sun CY, Hsu HJ, Tsai CJ, et al. (2011) p-Cresyl sulphate and indoxyl sulphate predict progression of chronic kidney disease. Nephrol Dial Transplan 26: 938–947.
16. Bammens B, Evenepoel P, Keuleers H, Verbeke K, Vanrenterghem Y. (2006) Free serum concentra-tions of the proteinbound retention solute p-cresol predict mortality in hemodialysis patients. Kidney Int 69: 1081–1087. PMID:16421516
17. Meijers BK, Bammens B, De Moor B, Verbeke K, Vanrenterghem Y, Evenepoel P. (2008) Free p-cresol is associated with cardiovascular disease in hemodialysis patients. Kidney Int 73: 1174–1180. doi:10.
1038/ki.2008.31PMID:18305466
18. Barreto FC, Barreto DV, Liabeuf S, Meert N, Glorieux G, Temmar M, et al, European Uraemic Toxin Work Group (EUTox). (2009) Serum indoxyl sulfate is associated with vascular disease and mortality in chronic kidney disease patients. Clin J Am Soc Nephrol 4: 1551–1558. doi:10.2215/CJN.03980609
PMID:19696217
19. Lin CJ, Chen HH, Pan CF, Chung CK, Wang TJ, Sun FJ, et al. (2011) P-cresylsulfate and Indoxyl Sul-fate Level at Different Stages of Chronic Kidney Disease. J Clin Lab Anal 25: 191–197. doi:10.1002/
jcla.20456PMID:21567467
20. Bammens B, Evenepoel P, Verbeke K. (2005) Time profiles of peritoneal and renal clearances of differ-ent uremic solutes in inciddiffer-ent peritoneal dialysis patidiffer-ents. Am J Kidney Dis 46: 512–519. PMID: 16129214
21. Martinez AW, Recht NS, Hostetter TH, Meyer TW. (2005) Removal of P-cresol sulfate by hemodialysis. J Am Soc Nephrol 16: 3430–3436. PMID:16120820
22. Niwa T. (2010) Indoxyl sulfate is a nephro-vascular toxin. J Ren Nutr 20[Suppl]: S2–S6.
23. Vanholder R, Bammens B, de Loor H, Glorieux G, Meijers B, Schepers E, et al. (2011) Warning: The unfortunate end of p-cresol as a uraemic toxin. Nephrol Dial Transplant 26: 1464–1467. doi:10.1093/
ndt/gfr056PMID:21406546
24. Aronov PA, Luo FJ, Plummer NS, Quan Z, Holmes S, Hostetter TH, et al. (2011) Colonic contribution to uremic solutes. J Am Soc Nephrol 22: 1769–1776. doi:10.1681/ASN.2010121220PMID:21784895 25. Takayama F, Taki K, Niwa T. (2003) Bifidobacterium in gastro-resistant seamless capsule reduces
serum levels of indoxyl sulfate in patients on hemodialysis. Am J Kidney Dis 41: S142–S145. PMID: 12612972
26. Nakabayashi I, Nakamura M, Kawakami K, Ohta T, Kato I, Uchida K, et al. (2011) Effects of synbiotic treatment on serum level of p-cresol in hemodialysis patients: a preliminary study. Nephrol Dial Trans-plant 26: 1094–1098. doi:10.1093/ndt/gfq624PMID:20929916
27. Meijers BK, De Preter V, Verbeke K, Vanrenterghem Y, Evenepoel P. (2010)p-Cresyl sulfate serum
concentrations in haemodialysis patients are reduced by the prebiotic oligofructose-enriched inulin. Nephrol Dial Transplant 25: 219–224. doi:10.1093/ndt/gfp414PMID:19692415
28. Slack A, Yeoman A, Wendon J. (2010) Renal dysfunction in chronic liver disease. Crit Care 14: 214.
doi:10.1186/cc8855PMID:20236458
30. Elekima OT, Mills CO, Ahmad A, Skinner GR, Ramsden DB, Bown J, et al. (2000) Reduced hepatic content of dehydroepiandrosterone sulphotransferase in chronic liver diseases. Liver 20: 45–50.
PMID:10726960
31. Klahr S, Levey AS, Beck GJ, Caggiula AW, Hunsicker L, Kusek JW, et al. (1995) The effects of dietary protein restriction and blood-pressure control on the progression of chronic renal disease. Modification of Diet in Renal Disease Study Group. N Engl J Med 330:877–884.
32. Patel KP, Luo FJ, Plummer NS, Hostetter TH, Meyer TW. (2012) The production of p-cresol sulfate and indoxyl sulfate in vegetarians versus omnivores. Clin J Am Soc Nephrol 7: 982–988. doi:10.2215/CJN.
12491211PMID:22490877
33. Schulman G, Agarwal R, Acjarya M, Berl T, Blumenthal S, Kopyt N, et al. (2006) A multicenter, random-ized, double blind, placebo controlled, dose ranging study of AST-120 (Kremezin) in patients with mod-erate to severe CKD. Am J Kidney Dis 47: 565–577. PMID:16564934
34. Schulman G, Berl T, Beck GJ, Remuzzi G, Ritz E, Arita K, et al. (2015) Randomized Placebo-Controlled EPPIC Trials of AST-120 in CKD. J Am Soc Nephrol 26:1732–1746. doi:10.1681/ASN.2014010042