In Vivo
Effects of Free Form Astaxanthin
Powder on Anti-Oxidation and Lipid
Metabolism with High-Cholesterol Diet
Yung-Yi Chen1, Pei-Chi Lee2, Yi-Long Wu3, Li-Yun Liu2*
1Department of Immunity and Infection, Liver research unit, University of Birmingham, Birmingham, United Kingdom,2Department of Food Science, Nutrition and Nutraceutical Biotechnology, Shih Chien University, Taipei, Taiwan,3Research & development department, Bioptik Technologies Inc. Hsin-Tzu Science Park, Hsin-Tzu, Taiwan
*liyun@g2.usc.edu.tw
Abstract
Astaxanthin extracted fromPomacea canaliculataeggs was made into free-form astax-anthin powder (FFAP) and its effects on lipid metabolism, liver function, antioxidants activi-ties and astaxanthin absorption rate were investigated. 45 hamsters were split into 5 groups and fed with normal diet, high-cholesterol control (0.2% cholesterol), 1.6FFAP (control +1.6% FFAP), 3.2FFAP (control+3.2% FFAP) and 8.0FFAP (control+8.0% FFAP), respec-tively, for 6 weeks. FFAP diets significantly decreased the liver total cholesterol, triglyceride levels and increased liver fatty acids (C20:5n3; C22:6n3) compositions. It decreased plasma alanine aminotransferase and aspartate aminotransferase. In terms of anti-oxida-tive activities, we found 8.0 FFAP diet significantly decreased plasma and liver malonalde-hyde (4.96±1.96μg TEP eq./mL and 1.56±0.38μg TEP eq./g liver) and liver 8-isoprostane levels (41.48±13.69μg 8-ISOP/g liver). On the other hand, it significantly increased liver cat-alase activity (149.10±10.76μmol/min/g liver), Vitamin C (2082.97±142.23μg/g liver), Vita-min E (411.32±81.67μg/g liver) contents, and glutathione levels (2.13±0.42 mg GSH eq./g liver). Furthermore, 80% of astaxanthin absorption rates in all FFAP diet groups suggest FFAP is an effective form in astaxanthin absorption. Finally, astaxanthin was found to re-distribute to the liver and eyes in a dose dependent manner. Taken together, our results suggested that the appropriate addition of FFAP into high cholesterol diets increases liver anti-oxidative activity and reduces the concentration of lipid peroxidase and therefore, it may be beneficial as a material in developing healthy food.
Introduction
Free radicals are oxidative products produced during metabolic processes. It is responsible for modulation of cell growth and signal transduction between cells[1]. Under normal physiologi-cal conditions, the excessive free radiphysiologi-cals produced in the body can be removed by internal antioxidants and anti-oxidative systems. Insufficient antioxidants in the body can cause OPEN ACCESS
Citation:Chen Y-Y, Lee P-C, Wu Y-L, Liu L-Y (2015) In VivoEffects of Free Form Astaxanthin Powder on Anti-Oxidation and Lipid Metabolism with High-Cholesterol Diet. PLoS ONE 10(8): e0134733. doi:10.1371/journal.pone.0134733
Editor:Patricia Aspichueta, University of Basque Country, SPAIN
Received:March 4, 2015
Accepted:July 13, 2015
Published:August 11, 2015
Copyright:© 2015 Chen et al. This is an open access article distributed under the terms of the Creative Commons Attribution License, which permits unrestricted use, distribution, and reproduction in any medium, provided the original author and source are credited.
Data Availability Statement:All relevant data are within the paper and its Supporting Information files.
damage to health, such as protein degeneration, cell and tissue injury, atherosclerosis, induce cardiovascular diseases, cancer, and promote the aging process[2][3]. Therefore, maintaining the dynamic balance of free radicals and anti-oxidative system in the body is very important. Natural antioxidants not only prevent cell damage caused by free radicals, but also enhance the immune response[4]. Carotenoids are natural antioxidants, with more than 600 known types to date. They can be split into two categories, xanthophyll and carotenes. Astaxanthin (3,3’ -dihydroxy-β,β-carotene-4,4’dione, C40H52O4, ASTA) is a xanthophyll carotenoid which is found in many microorganisms and marine animals, such as shrimp, crayfish, crustaceans, salmon, trout, krill, microalgae as well as yeast; and it’s believed to be the most widely distrib-uted lutein in the biosphere. It is a fat-soluble pigment, which plays a pivotal role in maintain-ing physiological functions. The structure of ASTA consists of two terminal rmaintain-ings joined by a polyene chain[5], which has two asymmetric carbons located at the 3, 3’position of theβ -ionone ring with hydroxyl functional group on each end of the molecule and this increases it ability in capturing per-oxidants[6]. It has been shown to have many biological functions, including anti-oxidative effects, anti-lipid peroxidation[7], anti-inflammatory properties and enhancement of the immune response[7][8][9]. Researches has suggested that the anti-oxida-tive properties of ASTA can contribute to the prevention of cancer, diabetes and cardiovascular diseases [8][9]. Furthermore, ASTA has a higher anti-oxidative activity on cell membrane, compared toβ-carotene and it is a super antioxidant with an anti-oxidative activity that is higher than most of the other antioxidants, including vitamin C, vitamin E,β-carotene, lutein, lycopene, and other catechins[9]. Therefore, in recent years, ASTA has been widely used as a material in the food industry[10].
Pomacae canaliculatais a type of large snail, which was originally found in South America. In 2004, research by Dreon MSet al., suggestedPomacae canaliculataeggs to be rich in ASTA isoforms, which possess high anti-oxidative activity, and is able to inhibit the oxidation response in liver microsomes[11]. Given thatPomacae canaliculataeggs contain a high con-centration of ASTA, they may be a valuable source in developing ASTA related products in the health food industry. ASTA easily loses its anti-oxidative activity when exposed to heat and light, therefore in this study, the free-form ASTA extracted from thePomacae canaliculata eggs was packaged with mung bean powder and made into free-form ASTA powder (FFAP). The anti-oxidative activities and its effects on lipid metabolism were investigated.
Materials and Methods
Astaxanthin extraction and the production of free-form astaxanthin
powder diets
ASTA and FFAP (S1 Fig) used in this study were produced and provided by Bioptik Technol-ogy Inc (Taiwan). ASTA extraction was performed according to a method described in the US patent US8030523B2, filed by Bioptik Technology Inc. Briefly,Pomacae canaliculataeggs were mixed proportionally with deionized water, homogenized (POLYTRON PT-2100, Bestway International Corporation, Taiwan), and the egg shells were removed to obtain a glycoprotein carotenoid solution. Then the protein, sugar, and lipid in the glycoprotein carotenoid solution were removed sequentially to obtain the carotenoid solution. Finally, the pure ASTA was extracted using 95% ethanol and the purity of ASTA was measured using the method described by Skredeet al(1986). The purity of the ASTA used in this study was>99.9%. Then, the extracted ASTA was mixed with mung bean powder using a specialized emulsification tech-nique and made into FFAP. The final concentration of ASTA within the FFAP is 1%. The gen-eral composition of FFAP was analyzed using the AACC method[12]. Finally, the FFAP was used as a material to produce 3 different FFAP diets in this study (1.6FFAP, 3.2FFAP and 8.0 Competing Interests:The authors received funding
FFAP;S1B Fig) according to the diet formula shown inTable 1. The doses of ASTA of the 3 FFAP diets are equivalent to 8mg/kg/day, 16mg/kg/day and 40mg/kg/day, respectively. The FFAP diets chosen for this study were based on the ASTA concentrations previous published in animal experiments and clinical studies, which have demonstrated significant beneficial effects of the ASTA in, for example, controlling blood pressure (5mg/kg/day and 50mg/kg/ day), lowering liver TG level (30mg/kg/day), reducing liver metastasis (1mg/kg/day), modulat-ing glucose levels (50mg/kg/day) and weight loss (30mg/kg/day) [13–23]
Animal and ethics statement
45 male Golden Syrian hamsters,Mesocricetus auratus, (8-week old) were purchased from the National Laboratory Animal Centre (NLAC, Taipei, Taiwan). The hamsters were acclimatized and housed in a standard animal house with 24 hour air-conditioning at 22±2°C, 12 hr. dark/ light cycle and permitted free access to water and food (MGF, Oriental Yeast Co., LTD) for 2 weeks. The animals were monitored daily during the study. The protocols for the animal exper-iments in this study were approved by the Institutional Animal Care and Use Committee (IACUC), Shih Chien University and conducted according to the guidelines laid down by the IACUC.
In vivo
Animal study
Forty five 10-week old male Golden Syrian hamsters (Mesocricetus auratus) purchased from the National Laboratory Animal Centre were randomly split into 5 groups, each group con-tained 9 hamsters, and were fed with 5 different diets, including: normal diet, high cholesterol control diet, 1.6% FFAP diet, 3.2% FFAP diet and 8.0 FFAP diet for 6 weeks. During the experi-mental period, animals were permitted free water and food, according toad libitummethod. Water was replaced daily and the water intake was recorded. The corks were sterilized everyday in an 80°C water bath for 10 minutes. All animals were checked for changes in body weight once a week. Food consumption, water intake, bowel movements and body weight changes were also recorded. Total ASTA intake was calculated using the formula shown below:
Total ASTA intakeðgÞ ¼ Food intakeðgÞx FFAPð%Þx1%ðASTA concentration in FFAPÞ
Sample collections
At the end of the 6-week experiment period, all animal were fasted for 12 hours before being sacrificed, and the liver, kidney, epididymis, heart, lung and eyes harvested from each animal, weighed, snap frozen and stored at -80°C for future analysis. Blood samples were taken by car-dio-puncture and collected in heparin tubes. Plasma was obtained by centrifuging blood sam-ple at 3000rpmfor 10 minutes at 4°C. The supernatant was then collected and stored at -20°C. Fecal samples were collected 3 days before the end of experiment and stored at -20°C for future analysis.
Biochemical analysis
wavelength. ALT (Alanine aminotransferase) and AST (Asparate aminotransferase) were tested using Alanine aminotransferase kit and Asparate aminotransferase kit (Randox Labora-tories Limited, UK) and determined by reading the absorbance at 454nm wavelength using a plate reader. Liver and plasma Trolox equivalent antioxidant capacity (TEAC) were deter-mined according to ABTS radical cation (ABTS+) decolorization assay[24] by mixing 10μl sample (tissue homogenate) with 1ml of ABTS+(2, 2’-azino-bis (3-ethylbenzothiazoline-6-sul-phonic acid)) solution for 6 minutes in the dark and the anti-oxidative capacity was determined at 734nm wavelength. Vitamin C concentration was tested based on the method from Jagota and Daniet al., by mixing sample and Folin-Ciocalteius reagent for 10 minutes. The concentra-tion of Vitamin C was then determined at wavelength of 760nm[25]. Vitamin E was tested using HPLC according to Miller, K.W.et al., protocol[26]. Plasma and liver MDA (malondial-dehyde) was tested using the thiobarbituric acid reactive substance (TBARS) principle with the result determined at 533nm absorbance[27]. Finally, 8-isoprostane (8-ISOP), catalase (CAT) and superoxide dismutase (SOD) was tested using ELISA kits (8-Isoprostane EIA kit, Catalase Assay kit and Superoxide Dismutase Assay kit) purchased from Cayman Chemical (Michigan, USA) according to manufacturing protocols. Glutathione (GSH) concentration was deter-mined by mixing 100μl sample with 900μl phosphate-EDTA and 100μlο-phthaladehyde for 15 minutes in dark, at room temperature[28]. The result was recorded at Ex350nm/Em420nm using a fluorescent spectrophotometer.
Liver fatty acid composition
Liver fatty acid composition was tested using gas chromatography (GC) based on the protocol published by Del Rio, J. C.et al[29]. Briefly, 3ml liver extract was mixed with 1.5ml ethanol and 500μl of 25% TAMH (Tetramethyl ammonium hydroxide), incubated for 10 minutes before addition of 2ml dH2O. Finally, the anhydrous sodium sulfate was collected, from which 2μl was analyzed in a gas chromatography, GC. The fatty acid composition was analyzed by calculating the integral area and retention time.
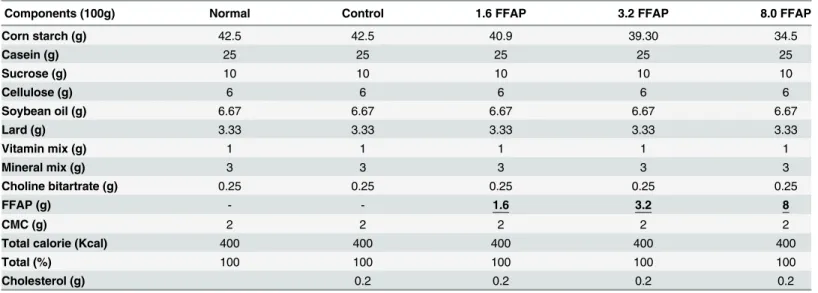
Table 1. Diet formula.
Components (100g) Normal Control 1.6 FFAP 3.2 FFAP 8.0 FFAP
Corn starch (g) 42.5 42.5 40.9 39.30 34.5
Casein (g) 25 25 25 25 25
Sucrose (g) 10 10 10 10 10
Cellulose (g) 6 6 6 6 6
Soybean oil (g) 6.67 6.67 6.67 6.67 6.67
Lard (g) 3.33 3.33 3.33 3.33 3.33
Vitamin mix (g) 1 1 1 1 1
Mineral mix (g) 3 3 3 3 3
Choline bitartrate (g) 0.25 0.25 0.25 0.25 0.25
FFAP (g) - - 1.6 3.2 8
CMC (g) 2 2 2 2 2
Total calorie (Kcal) 400 400 400 400 400
Total (%) 100 100 100 100 100
Cholesterol (g) 0.2 0.2 0.2 0.2
Normal: Normal diet; Control: Normal diet + 0.2% cholesterol; 1.6FFAP: control diet + 1.6%FFAP; 3.2FFAP: control diet + 3.2% FFAP; 8.0FFAP: control diet + 8.0%FFAP.
Liver reducing power
The liver reducing power was tested based on the protocol published by Oyaizu, M.et al., (1986). 100μl sample was mixed with 100μl of PBS (0.2M, pH6.6) and 500μl of 1% K3Fe(CN)6, and incubated in 50°C water bath for 20 minutes. 500μl of 10% TCA was then added, followed by centrifuging at 3000rpmfor 10 minutes. The supernatant was collected and incubated with 500μl deionized water and 100μl of 1% FeCl3•6H2O for 10 minutes. Finally, the result was recorded by a spectrophotometer at 700nm wavelength.
ASTA distribution
Tissues, including heart, kidney, lung, epididymis, liver, eyes, and faecal sample were collected as described above. The amount of ASTA in each sample was measured according to Kang, C. K.et al., using a high-performance liquid chromatography, HPLC, by passing the sample through Phenomenex C18 Reverse phase column (4.6mm x 250mm, 5μm). Mobile phase: [Methanol: Acetonitrile: Chloroform = 47:47:6 (v/v/v)] at 1.0 mL/min flow rate at 25°C. Then the data was recorded at 474nm wavelength[30]. The content of ASTA was calculated using the integral area and retention time of each sample.
Statistics
All data in this study was tested using Duncan’s multiple range tests, which provides signifi-cance levels for the difference between any pair of means. Pearson correlation coefficient was used to study the correlations between plasma and liver MDA and its anti-oxidant activities. Significance between groups (p<0.05) is denoted by dissimilar lowercase letters.
Results
Feed efficiency
Astaxanthin is a type of lipid-soluble substance, which consists of 2 forms, the free form and the ester form. The free form ASTA is easier for digestion and absorption; however, it easily loses its anti-oxidative activity when exposed to heat and light. In order to preserve its anti-oxi-dative functions, free-form ASTA was made into free form astaxanthin powder (FFAP) by mix-ing ASTA with mung bean powder. The FFAP was analyzed for ASTA content usmix-ing HPLC and its general composition was analyzed according to the AACC method (Fig 1). The diet for-mula for each experimental group, including normal diet, high cholesterol diet, 1.6 FFAP, 3.2 FFAP and 8.0 FFAP diet is shown inTable 1. To investigate the effect of FFAP on feed effi-ciency, food intake, water intake and body weight changes were recorded. The food intake and body weight changes of the hamsters during the 6 weeks experiment periods were recorded and shown inS2 Fig. Overall, there were no significant differences in these factors between each diet group. The feed efficiency was calculated using the formula:Body weight changes (g) / Food intake (g) x 100%. From the results, we found that the normal diet had the highest feed efficiency, at 6.40±1.42%; and the high cholesterol diet had the lowest feed efficiency, at 5.28 ±1.38% diet. When 1.6 FFAP, 3.2 FFAP and 8.0 FFAP were added into high cholesterol diet, the feed efficiency increased from 5.28±1.38% to 5.69±0.73%, 5.70±2.63% and 6.06±1.76%, respectively. However, there were no significant differences between each group,Table 2.
Plasma and liver lipid concentrations and liver fatty acid compositions
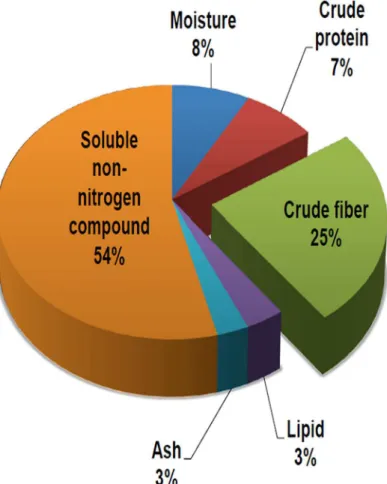
respectively) and epididymal adipose levels (1.9±0.1g, 8.0 FFAP diet). All data are mean ± SD, p<0.05, compared to high cholesterol control, n = 9 (Duncan’s multiple range tests). In addi-tion, total cholesterol (TC) and triglycerides (TG) in the plasma and liver were screened to study the effects of FFAP diets on plasma and liver lipids changes. As expected, the high choles-terol diet significantly increased plasma TC (90.69±2.69 mg/dL) and TG (60.31±4.76 mg/dL) Fig 1. The general compositions of the FFAP.The pie chart represents the general compositions of FFAP. This form of astaxanthin contains large amount of crude fiber and therefore can be used as a source of high fiber food.
doi:10.1371/journal.pone.0134733.g001
Table 2. The feed efficiency (%) of all test groups.
Group Feed efficiency (%)
Normal 6.40±1.42a
Control 5.28±1.38a
1.6FFAP 5.69±0.73a
3.2FFAP 5.70±2.63a
8.0FFAP 6.06±1.76a
All values are Mean±SD, n = 9. All data was tested using Duncan’s multiple range tests, where significance between groups (p<0.05) is denoted by dissimilar lowercase letters. Normal: Normal diet; Control: Normal diet + 0.2% cholesterol; 1.6FFAP: control diet + 1.6%FFAP; 3.2FFAP: control diet + 3.2% FFAP; 8.0FFAP: control diet + 8.0%FFAP.
levels; as well as liver TC (56.1±0.48 mg/g) and TG levels (87.3±0.45 mg/g) compared to nor-mal diet. The addition of FFAP into high cholesterol diets significantly decreased the levels of liver TC (41.4±0.15 mg/g liver, 8.0 FFAP) and TG (69.6±0.18 mg/g liver, 3.2 FFAP and 71.1 ±0.31 mg/g liver, 8.0 FFAP). All data are mean ± SD,p<0.05, compared to high cholesterol control, n = 9 (Duncan’s multiple range tests). However, there was no significant reduction in the levels of plasma TC and TG,Table 4. In addition to TC and TG, the plasma HDL-C and LDL-C values were also studied. The ratio between LDL-C and HDL-C were used as an index of liver lipid metabolism to reflect the risk for atherosclerosis,Table 4. The result showed that despite the concentration of HDL-C and LDL-C in FFAP diets and high cholesterol controls being significantly higher than normal diet, the LDL-C to HDL-C ratio remained stable. This data supports the studies by Iwamoto, T.et al., (2000) and Augusti P. R.et al., (2012), which also found ASTA diet has no effect on the levels of total cholesterol and the liver lipid metabo-lisms[31,32].
In terms of liver fatty acid composition, we noticed that the percentages of EPA (C20:5n3) and DHA (C22:6n3) in the liver fatty acid compositions increased when animals were fed with FFAP diets, compared with controls (Fig 2). From the result, we can see that the liver EPA (C20:5n3) and DHA (C22:6n3) were at 7.55% and 4.28%, when animals were fed with normal control diet; and the percentage decreased to 6.29% and 3.77% respectively when hamsters were fed with high cholesterol control diet. The percentages of EPA and DHA in the liver fatty acid composition increased by nearly 2 fold (EPA: 8.09%, 10.04% and 13.47%; DHA: 5.20%, Table 3. The organ coefficients (%) of all test groups.
Group Liver (g) Liver / body weight (%) Epididymal adiopse (g) Epididymal adipose / body weight (%)
Normal 3.03±0.08c 2.60±0.10c 2.18±0.16ab 1.85±0.26a
Control 3.96±0.18a 3.38±0.14a 2.49±0.18ab 2.16±0.13a
1.6FFAP 3.41±0.13b 3.00±0.16b 2.00±0.11c 1.79±0.18b
3.2FFAP 3.40±0.21b 2.95±0.12b 1.99±0.12c 1.71±0.22b
8.0FFAP 3.40±0.10b 3.13±0.19b 1.90±0.10c 1.71±0.18b
Result suggested that FFAP diets significantly decreased liver weights (3.41±0.13g, 3.40±0.21g and 3.40±0.1g, respectively) and epididymal adipose levels. All values are Mean±SD, n = 9. All data was tested using Duncan’s multiple range tests, where significance between groups (p<0.05) is denoted
by dissimilar lowercase letters. Normal: Normal diet; Control: Normal diet + 0.2% cholesterol; 1.6FFAP: control diet + 1.6%FFAP; 3.2FFAP: control diet + 3.2% FFAP; 8.0FFAP: control diet + 8.0%FFAP.
doi:10.1371/journal.pone.0134733.t003
Table 4. Plasma and liver lipid concentrations in all test group.
Blood Liver
Group TG (mg/dL) TC (mg/dL) HDL-C (mg/dL) LDL-C (mg/dL) LDL/HDL-C ratio TC (mg/g) TG (mg/g)
Normal 51.64±3.20b 74.65±3.45b 25.3±1.65b 47.3±3.76b 1.89±0.14a 45.0±0.21ab 75.2±0.37ab
Control 60.31±4.76a 90.69±2.69a 30.19±2.03a 58.93±2.69a 1.94±0.14a 56.1±0.48a 87.3±0.45a
1.6FFAP 56.60±7.91ab 90.87±3.58a 31.12±2.24a 61.87±4.25a 1.99±0.22a 45.3±0.22ab 75.0±0.30ab
3.2FFAP 60.08±6.86a 90.82±3.52a 31.14±2.16a 60.97±4.21a 1.95±0.17a 45.1±0.28ab 71.1±0.31b 8.0FFAP 63.37±6.26a 90.27±3.64a 32.07±2.44a 60.71±2.88a 1.91±0.25a 41.4±0.15b 69.6±0.18b The result showed that FFAP diet has no effect on plasma lipid levels. On the other hand, FFAP diet significantly decreased liver TC and TG levels, p<0.05. All values are Mean±SD, n = 9. All data was tested using Duncan’s multiple range tests, where significance between groups (p<0.05) is denoted by dissimilar lowercase letters. Normal: Normal diet; Control: Normal diet + 0.2% cholesterol; 1.6FFAP: control diet + 1.6%FFAP; 3.2FFAP: control diet + 3.2% FFAP; 8.0FFAP: control diet + 8.0%FFAP.
6.21% and 2.35%, respectively), after feeding with 1.6 FFAP, 3.2 FFAP and 8.0 FFAP diets, although these changes were not significant.
Liver functions
Liver function was studied by monitoring the levels of plasma and liver alanine transaminase (ALT) and asparate aminotransferase (AST). High cholesterol diets significantly increased plasma ALT (21.83±4.28U/L) and AST (13.73±5.29U/L) as well as liver AST (data not shown) when compared to the normal control. Interestingly, when FFAP was supplemented into the liver, a significant reduction in the levels of plasma ALT and AST (reduced by 50%-80%) was observed,Table 5. Despite the significant decrease in the levels of liver function indexes (plasma ALT and AST; liver AST) in the FFAP diet groups compared to the normal diet group, Fig 2. The fatty acid composition in the liver of test groups.The unsaturated fatty acids EPA (C20:5n3) and DHA (C22:6n3) are shown in blue and red. FFAP diets increased the EPA and DHA ratios in the liver fatty acid composition.
doi:10.1371/journal.pone.0134733.g002
Table 5. Liver functions in all test groups.
Group ALT (U/L) AST (U/L)
Normal 11.66±7.09b 7.63±7.30b
Control 21.83±4.28a 13.73±5.29a
1.6FFAP 6.53±2.46c 5.66±3.49bc
3.2FFAP 4.61±2.39c 2.11±0.60c
8.0FFAP 3.73±2.49c 1.93±1.23c
Plasma ALT and AST from all test groups were examined to study the effect of FFAP on liver function. The result showed FFAP diets significantly decreased plasma ALT and AST, p<0.05. All values are Mean±SD, n = 9. All data was tested using Duncan’s multiple range tests, where significance between groups (p<0.05) is denoted by dissimilar lowercase letters. Normal: Normal diet; Control: Normal diet + 0.2% cholesterol; 1.6FFAP: control diet + 1.6%FFAP; 3.2FFAP: control diet + 3.2% FFAP; 8.0FFAP: control diet + 8.0%FFAP.
the livers gross appearance and the H&E staining in the FFAP diet groups were similar to those in normal control,S3 Fig. Similar to a study by Shen, M.et al., using a CCl4mice model, daily administration of 40mg/kg and 80mg/kg ASTA significantly reduced plasma ALT and AST, which in turn decreased the level of liver inflammation [33]. Bhuvaneswar, S.et al., also dem-onstrated the protective effect of ASTA by supplementing 6mg/kg of ASTA in high cholesterol diets[34]. Our study coincides with the studies mentioned above, and therefore, suggesting the FFAP can be used as a material for developing healthy foods.
Plasma and liver antioxidant activities
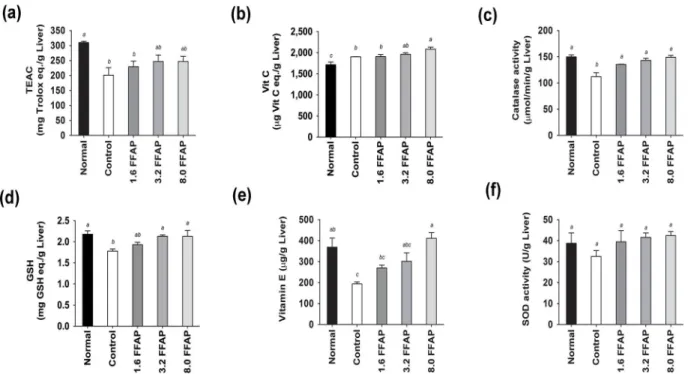
To investigate the effects of FFAP on antioxidant activities, we measured plasma and liver TEAC, Vitamin C and MDA; as well as liver 8-ISOP, Vitamin E, catalase, GSH and SOD from each animal. We found that the high cholesterol diet significantly decreased the levels of liver TEAC (201.32±74.56μg Trolox eq./g Liver,Fig 3a), catalase activity (112.16±22.6μmol/min/g Liver,Fig 3c), GSH (1.78±0.15 mg GSH eq./g Liver,Fig 3d), Vitamin E (193.46±28.48μg/g Liver,Fig 3e) levels, and to some extent, lowered the levels of liver SOD activity (32.51±8.35U/ g Liver,Fig 3f), plasma TEAC (8.24±0.22μg Trolox eq./mL, (data not shown) and plasma Vita-min C (data not shown). On the other hand, it increased liver and plasma MDA (2.24±0.49μg TEP eq./g Liver and 10.69±2.52μg TEP eq./dL plasma,Fig 4a and 4b; and liver 8-ISOP levels 70.41±28.67 eq./g Liver,Fig 4c). Supplementing FFAP in the high cholesterol diet was able to efficiently recover liver TEAC (between 13.89 and 22.53%,Fig 3a) and Vitamin C (1904.94 ±152.29 to 2082.97±142.23μg Vit C eq./g Liver,Fig 3b) levels. It also significantly increased liver catalase activities (135.27±1.80 to 149.10±10.76μmol/min/g Liver,Fig 3c), GSH (1.93 ±0.17 to 2.13±0.42 mg GSH eq./g Liver,Fig 3d) and Vitamin E levels (269.40±42.47 to 411.32 ±81.67μg/g liver,Fig 3e). Moreover, it significantly reduced plasma MDA by between 16.28% and 53.60% and liver MDA by between 17.86% and 30.36% in a dose dependant manner (Fig 4a and 4b). Liver 8-ISOP was also significantly reduced by approximately 40% (Fig 4c). Fur-thermore, reducing power analysis showed that the liver reducing power is lower in high cho-lesterol diet (16.98±0.54 mg Vit C eq./g Liver), comparing to normal diet (18.18±1.24 mg Vit C eq./g liver); and the addition of 1.6, 3.2 and 8.0FFAP in the high cholesterol diet improved the reducing power to 17.66±0.33, 17.95±0.40 and 19.91±0.88 mg Vit C eq./g liver, respectively. Notably, the reducing power in 8.0FFAP diet group increased significantly by 17.26%, com-pared to high cholesterol control,Fig 4d.
Correlations between plasma and liver MDA and anti-oxidant activities
MDA is a highly reactive three carbon dialdehyde produced as a by-product of polyunsaturated fatty acid peroxidation and arachidonic acid metabolism. It is usually used as an index for oxi-dative stress. To study the correlation of MDA with the other antioxidants after FFAP diets a Pearson correlation coefficient test was used. The correlation between MDA and anti-oxidant activities is shown inTable 6. Plasma and liver MDA was positively correlated with liver and plasma 8-ISOP (p<0.001). On the contrary, liver MDA is negatively correlated with plasma Vitamin C (p<0.05) and catalase activity (p<0.001).
ASTA absorption percentage and distribution
Finally, we examined the ASTA absorption efficiency in the FFAP test groups. ASTA total absorption was calculated by the formula shown below:
ASTA total absorption% ¼ ðASTA intakeðgÞ ASTA outputðgÞÞ=total intakeðgÞ 100%
FFAP (%) x 1% (ASTA concentration in FFAP)and recorded inS1 Table. The result showed that the ASTA absorption in the 1.6, 3.2 and 8.0 FFAP groups were high at 78.91%, 86.56% and 86.03%, respectively; suggesting this form of ASTA powder is an effective way in promot-ing ASTA absorption,Table 7. Furthermore, in order to understand the distribution of ASTA in the body after it is absorbed, we also analyzed the ASTA contents in the liver, eyes and fae-ces from each animal. The result showed after ASTA was absorbed, it was redistributed and stored in the liver (between 0.97±0.01μg/g and 1.26±0.24μg/g) and eyes (between 10.59 ±3.82μg/g and 17.21±3.53μg/g) in a dose dependent manner. Similarly, the more ASTA that was consumed, the more the ASTA was excreted into faeces (between 303.67±8.37μg/g and 564.82±78.59μg/g).
Conclusion and Discussions
In this study, ASTA was mixed with mung bean powder and made into FFAP diets and anin vivohamster model was used to investigate its effects on liver metabolism and anti-oxidative activities. We found that the addition of FFAP to a high cholesterol diet significantly increased the levels of liver catalase activity, Vitamin C, Vitamin E, GSH and reducing power. Also, it sig-nificantly decreased plasma ALT and AST levels, MDA and 8-ISOP levels. Moreover, the MDA levels were positively correlated with 8-ISOP and negatively correlated to catalase, Vita-min C, VitaVita-min E and GSH contents.Fig 5summarizes the overall effects on antioxidant activ-ities and liver metabolisms of FFAP diets, from which we found the 8.0FFAP has the highest anti-oxidative activities and it effectively improves liver function and therefore could be used as a potential material in healthy food development. Our result support the findings by Shih Fig 3. Liver anti-oxidant activities of all test groups.(a) Liver TEAC, (b) liver Vitamin C, (c) catalase activity, (d) GSH, (e) Vitamin E and (f) SOD activity. FFAP diets significantly increased liver TEAC, catalase activity, GSH and Vitamin E; and to some extent, SOD activity and plasma TEAC, compared to control,p<0.05. Moreover, although not significantly different, FFAP diets increased liver TEAC compared to high cholesterol control. All values are
Mean±SD, n = 9. All data were tested using Duncan’s range test where in the same column values not sharing a common letters are significantly different
from one another. Normal: Normal diet; Control: Normal diet + 0.2% cholesterol; 1.6FFAP control diet + 1.6%FFAP; 3.2FFAP: control diet + 3.2% FFAP; 8.0FFAP: control diet + 8.0%FFAP.
CKet al., that used rats fed a high-cholesterol diet to investigate the roles ofβ-carotene and canthaxanthin in cholesterol metabolism and demonstrated thatβ-carotene and canthaxanthin are able to modulate the balance between pro-oxidation and antioxidation and inhibit choles-terol-induced oxidative stress[35]. In terms of liver lipid and fatty acid composition, we found FFAP diets efficiently deceased liver total cholesterol and triglycerides, and also increased the proportion of DHA and EPA, which are crucial constituents of Omega-3. Since Omega-3 is an Fig 4. Liver and plasma MDA and 8-ISOP activities and reducing power.FFAP diets significantly decreased (a) liver MDA, (b) plasma MDA, (c) liver 8-ISOP, and significantly increased the liver reducing power (d).p<0.05. All values are Mean±SD, n = 9. All data were tested using Duncan’s range test where in
the same column values not sharing a common letters are significantly different from one another. Normal: Normal diet; Control: Normal diet + 0.2% cholesterol; 1.6FFAP control diet + 1.6%FFAP; 3.2FFAP: control diet + 3.2% FFAP; 8.0FFAP: control diet + 8.0%FFAP.
doi:10.1371/journal.pone.0134733.g004
Table 6. The correlations between plasma and liver malondialadhyde (MDA) and antioxidant activities of all test groups.
Antioxidant activity MDA in blood MDA in liver
8-ISOP 0.55883*** 0.74836***
Vit C -0.37772* -0.1289
SOD 0.03713 -0.19761
Catalase -0.68007*** -0.33729
TEAC -0.1715 -0.39246
GSH -0.27192 -0.58179*
Plasma and liver MDA is positively correlated with liver and plasma 8-ISOP (p<0.001). On the contrary, liver MDA is negatively correlated with Vitamin C (p<0.05) and catalase (p<0.001).
*p<0.05 **p<0.01 ***p<0.001.
important component in physiological metabolism, the increase in the ratio of DHA and EPA in the FFAP diets suggests it may have a beneficial role in these physiological processes. Indeed, research by Arnold Cet al., demonstrated that EPA and DHA can be efficiently converted by CYP enzymes to novel epoxy and hydroxyl metabolites that are able to mediate some beneficial cardiovascular effects[36]. A study from Bell J. G.et al., found dietary deficiency of ASTA sig-nificantly increased the recovery of EPA and DHA in Atlantic salmon[37]. In this study, hepa-tocytes isolated from Atlantic salmon fed with different diets (with or without ASTA) were analyzed for anti-oxidative capacity. From the results, the authors found a significant increase in EPA and DHA when fish were fed ASTA deficient diets and suggested this may be due to a compensatory effect in order to overcome the oxidative stress caused by, for example, restricted dietary intake of antioxidant components such as Vitamin E and selenium; or inclusion of die-tary pro-oxidants such as high cholesterol diets. In contrast with these findings, our study showed ASTA containing-FFAP diets increased the percentage of EPA and DHA in liver fatty acid compositions. The mechanism for this is unclear, but may be due to the differing lipid Table 7. Astaxanthin absorption percentage and distribution.
Group Asta absorption (%) Liver (μg/g) Eye (μg/g) Fecal (μg/g)
Normal ND ND 9.09±3.57bc ND
Control ND ND 6.30±3.35c ND
1.6FFAP 78.91 0.97±0.01b 10.59±3.82bc 303.67±8.37b
3.2FFAP 86.56 1.06±0.04ab 13.00±3.70ab 412.50±155.61ab
8.0FFAP 86.03 1.26±0.24a 17.21±3.53a 564.82±78.59a
All data was tested using Duncan’s multiple range tests, where significance between groups (p<0.05) is denoted by dissimilar lowercase letters. Normal: Normal diet; Control: Normal diet + 0.2% cholesterol; 1.6FFAP: control diet + 1.6%FFAP; 3.2FFAP: control diet + 3.2% FFAP; 8.0FFAP: control diet + 8.0%FFAP.
doi:10.1371/journal.pone.0134733.t007
Fig 5. Comparison of the anti-oxidative activities and lipid metabolism between different FFAP diet groups.
metabolic systems between salmon and hamsters. Moreover, in our study, hamsters were fed with high cholesterol diets in combination with different concentrations of FFAP. The combi-nation of high cholesterol diet with FFAP may trigger homeostatic cellular regulatory responses to, for example, altering the activities of modulation enzymes, such asΔ6-desaturase[38,39],
Δ5-desaturase and C20 elongase, which may in turn contribute to the observed changes in fatty acid compositions.
Antioxidants are important for healthy functioning of the body. Both Vitamin C & E pre-vent excessive oxidative stress by reducing free radicals to stable molecules. Vitamin E has also been shown to decrease lipid peroxidation and protect unsaturated fatty acid in the phospho-lipids on the cell membrane. Moreover, MDA and 8-ISOP are shown to be an index for lipid peroxides[40], which are crucial factors in cell injury[41]. From our study, FFAP diets effi-ciently decreased oxidative stress, increased liver reducing power, catalase activities, GSH, Vitamin C and Vitamin E levels and therefore may have a beneficial health effect. Our study supports the findings by Bhuvaneswaris, S.et al., and Curek, G.D.et al., who also demonstrated that supplementing ASTA (6.0mg/kg) into high cholesterol diet significantly increased the activity of liver catalase activity[34] while 5mg/kg ASTA significantly increased liver GSH lev-els[42]. The ASTA absorption rates in the FFAP diet groups were high, at around 80%, suggest-ing the FFAP is an efficient format in improvsuggest-ing ASTA absorption. However, we also found the amount of ASTA excreted in the faeces is proportional to its dose in the FFAP diets, which suggests that the ASTA was not entirely absorbed. The high fiber content of the FFAP formula (Fig 1) may contribute to this phenomenon as the high fiber content can promote intestinal tract peristalsis and therefore may in turn shorten the ASTA retention time. Finally, our result showed a significant amount of ASTA distributed in the liver and eyes. The redistribution of ASTA into livers and eyes is encouraging because this suggests that FFAP diet can be beneficial to certain diseases such as liver fibrosis and diabetic retinopathy. According to Yang Yet al., ASTA inhibits TGF-β1 induced pro-fibrogenic gene expressions, which then abolishes Smad3 phosphorylation in hepatic stellate cells and therefore attenuates liver fibrosis[43]. Moreover, a research by Dong LY et al., suggested that ASTA is able to inhibit oxidative stress and reduce apoptosis of retinal ganglion cells in db/db mice[44]. Therefore, further investigation of the beneficial roles of FFAP diets in diseases relating to liver fibrosis, such as non-alcoholic fatty liver disease (NAFLD); and diabetic retinopathy as well as its mechanisms of actions will give us further understanding of its potential applications. Taken together, our results demonstrated the FFAP diets increased liver anti-oxidative activity and reduced the concentration of lipid peroxidase and therefore it may be beneficial as a material in developing healthy food.
Supporting Information
S1 Fig. Astaxanthin powder and different diets used in this study.(A)Free form Astaxathin powder (FFAP) used in this study and its chemical formula. The free form astaxathin powder contains 1% pure ASTA. (B)Images of 5 different formula diets used in this study. From left to right: normal diet; high cholesterol control (normal diet+0.2% cholesterol); 1.6% FFAP (high cholesterol control+1.6%FFAP); 3.2% FFAP (high cholesterol control+3.2% FFAP); 8.0% FFAP (high cholesterol control+8.0%FFAP).
(PDF)
control diet + 1.6%FFAP; 3.2FFAP: control diet + 3.2% FFAP; 8.0FFAP: control diet + 8.0% FFAP.
(PDF)
S3 Fig. The liver gross appearance and H&E staining of different diet groups.(A)Livers gross appearanceand (B)H&E stainingin the FFAP diet groups were similar to those in normal control. Normal: Normal diet; High Cholesterol Control: Normal diet + 0.2% cholesterol; 1.6FFAP: control diet + 1.6%FFAP; 3.2FFAP: control diet + 3.2% FFAP; 8.0FFAP: control diet + 8.0%FFAP.
(PDF)
S1 Table. Astaxanthin total intake and output of all diet groups. (PDF)
Acknowledgments
This research was supported by Jin Chang Yang, Bioptik Technnology Inc., grant number: VSC-102-03-02010.
Author Contributions
Conceived and designed the experiments: LYL. Performed the experiments: PCL. Analyzed the data: YYC PCL LYL. Contributed reagents/materials/analysis tools: YLW. Wrote the paper: YYC LYL.
References
1. Finkel T. Oxidant signals and oxidative stress. Curr Opin Cell Biol, 2003. 15(2): p. 247–54. PMID: 12648682
2. Maxwell SR, Lip GY. Free radicals and antioxidants in cardiovascular disease. Br J Clin Pharmacol, 1997. 44(4): p. 307–17. PMID:9354304
3. Mimic-Oka J, Simic DV, Simic TP. Free Radicals Cardiovascular diseases. Medicine and Biology, 1999. 6: p. 11.
4. Fang YZ, Yang S, Wu G. Free radicals, antioxidants, and nutrition. Nutrition, 2002. 18(10): p. 872–9. PMID:12361782
5. Ambati RR, Phang SM, Ravi S, Aswathanarayana RG. Astaxanthin: sources, extraction, stability, bio-logical activities and its commercial applications—a review. Mar Drugs, 2014. 12(1): p. 128–52. doi: 10.3390/md12010128PMID:24402174
6. Terao J. Antioxidant activity of beta-carotene-related carotenoids in solution. Lipids, 1989. 24(7): p. 659–61. PMID:2779372
7. Leite MF, De Lima A, Massuyama MM, Otton R. In vivo astaxanthin treatment partially prevents antioxi-dant alterations in dental pulp from alloxan-induced diabetic rats. Int Endod J, 2010. 43(11): p. 959–67. doi:10.1111/j.1365-2591.2010.01707.xPMID:20546046
8. Ciccone MM, Cortese F, Gesualdo M, Carbonara S, Zito A, Ricci G, et al. Dietary intake of carotenoids and their antioxidant and anti-inflammatory effects in cardiovascular care. Mediators Inflamm, 2013. 2013: p. 782137.
9. Palozza P, Krinsky NI. Astaxanthin and canthaxanthin are potent antioxidants in a membrane model. Arch Biochem Biophys, 1992. 297(2): p. 291–5. PMID:1497349
10. Nishida Y, Yamashita E, Miki W. Quenching Activities of Common Hydrophilic and Lipophilic Antioxi-dants against Singlet Oxygen Using Chemiluminescence detection System. Carotenoid Science, 2007. 11: p. 4.
11. Dreon MS, Heras H, Pollero RJ. Characterization of the major egg glycolipoproteins from the perivitellin fluid of the apple snail Pomacea canaliculata. Mol Reprod Dev, 2004. 68(3): p. 359–64. PMID: 15112330
13. Kurihara H, Koda H, Asami S, Kiso Y, Tanaka T. Contribution of the antioxidative property of astax-anthin to its protective effect on the promotion of cancer metastasis in mice treated with restraint stress. Life Sci, 2002. 70(21): p. 2509–20. PMID:12173414
14. Ikeuchi M, Koyama T, Takahashi J, Yazawa K. Effects of astaxanthin in obese mice fed a high-fat diet. Biosci Biotechnol Biochem, 2007. 71(4): p. 893–9. PMID:17420580
15. Hussein G, Sankawa U, Goto H, Matsumoto K, Watanabe H. Astaxanthin, a carotenoid with potential in human health and nutrition. J Nat Prod, 2006. 69(3): p. 443–9. PMID:16562856
16. Hussein G, Nakamura M, Zhao Q, Iguchi T, Goto H, Sankawa U, et al. Antihypertensive and neuropro-tective effects of astaxanthin in experimental animals. Biol Pharm Bull, 2005. 28(1): p. 47–52. PMID: 15635162
17. Miki W, Hosoda K, Kondo K, Itakura H. Astaxanthin-containing drink. Japanese Patent. 1998. 10155459.
18. Iwamoto T, Hosoda K, Hirano R, Kurata H, Matsumoto A, Miki W, et al. Inhibition of low-density lipopro-tein oxidation by astaxanthin. J Atheroscler Thromb, 2000. 7(4): p. 216–22. PMID:11521685
19. Karppi J, Rissanen TH, Nyyssonen K, Kaikkonen J, Olsson AG, Voutilainen S, et al. Effects of astax-anthin supplementation on lipid peroxidation. Int J Vitam Nutr Res, 2007. 77(1): p. 3–11. PMID: 17685090
20. Kim JH, Chang MJ, Choi HD, Youn YK, Kim JT, Oh JM, et al. Protective effects of Haematococcus astaxanthin on oxidative stress in healthy smokers. J Med Food, 2011. 14(11): p. 1469–75. doi:10. 1089/jmf.2011.1626PMID:21883001
21. Park JS, Chyun JH, Kim YK, Line LL, Chew BP. Astaxanthin decreased oxidative stress and inflamma-tion and enhanced immune respose in humans. Nutr Metab (Lond), 2010. 7: p. 18.
22. Yoshida H, Yanai H, Ito K, Tomono Y, Koikeda T, Tsukahara H, et al. Administration of natural astax-anthin increases serum HDL-cholesterol and adiponectin in subjects with mild hyperlipidemia. Athero-sclerosis, 2010. 209(2): p. 520–3. doi:10.1016/j.atherosclerosis.2009.10.012PMID:19892350
23. Choi HD, Youn YK, Shin WG. Positive effects of astaxanthin on lipid profiles and oxidative stress in overweight subjects. Plant Foods Hum Nutr, 2011. 66(4): p. 363–9. doi:10.1007/s11130-011-0258-9 PMID:21964877
24. Katalinic V, Modun D, Music I, Boban M. Gender differences in antioxidant capacity of rat tissues deter-mined by 2,2'-azinobis (3-ethylbenzothiazoline 6-sulfonate; ABTS) and ferric reducing antioxidant power (FRAP) assays. Comp Biochem Physiol C Toxicol Pharmacol, 2005. 140(1): p. 47–52. PMID: 15792622
25. Jagota SK, Dani HM. A new colorimetric technique for the estimation of vitamin C using Folin phenol reagent. Anal Biochem, 1982. 127(1): p. 178–82. PMID:7165085
26. Miller KW, Lorr NA, Yang CS. Simultaneous determination of plasma retinol, alpha-tocopherol, lyco-pene, alpha-carotene, and beta-carotene by high-performance liquid chromatography. Anal Biochem, 1984. 138(2): p. 340–5. PMID:6742412
27. Ohkawa H, Ohishi N, Yagi K. Assay for lipid peroxides in animal tissues by thiobarbituric acid reaction. Anal Biochem, 1979. 95(2): p. 351–8. PMID:36810
28. Cohn VH, Lyle J. A fluorometric assay for glutathione. Anal Biochem, 1966. 14(3): p. 434–40. PMID: 5944947
29. Del Rio JC, Hatcher PG. Analysis of aliphatic biopolymers using therochemolusis with TMAH and gas chromatography-MS. Org. Geochem, 1998. 29(5–7): p. 10.
30. Kang CD, Sim SJ. Selective extraction of free astaxanthin from Haematococcus culture using a tandem organic solvent system. Biotechnol Prog, 2007. 23(4): p. 866–71. PMID:17567038
31. Iwamoto T, Hosoda K, Hirano R, Kurata H, Matsumoto A, Miki W, et al. Inhibition of low-density lipopro-tein oxidation by astaxanthin. J Atheroscler Thromb, 2000. 7(4): p. 216–22. PMID:11521685
32. Augusti PR, Quatrin A, Somacal S, Conterato GM, Sobieski R, Ruviaro AR, et al. Astaxanthin prevents changes in the activities of thioredoxin reductase and paraoxonase in hypercholesterolemic rabbits. J Clin Biochem Nutr, 2012. 51(1): p. 42–9. doi:10.3164/jcbn.11-74PMID:22798712
33. Shen M, Chen K, Lu J, Cheng P, Xu L, Dai W, et al. Protective effect of astaxanthin on liver fibrosis through modulation of TGF-beta1 expression and autophagy. Mediators Inflamm, 2014. 2014: p. 954502.
34. Bhuvaneswari SAE, Viswanathan P, Anuradha CV. Astaxanthin restricts weight gain, promotes insulin sensitivity and curtails fatty liver disease in mice fed a obesity-promoting diet. Process Biochem, 2010. 45(8): p. 8.
36. Arnold C, Markovic M, Blossey K, Wallukat G, Fisher R, Dechend R, et al. Arachidonic acid-metaboliz-ing cytochrome P450 enzymes are targets of {omega}-3 fatty acids. J Biol Chem, 2010. 285(43): p. 32720–33. doi:10.1074/jbc.M110.118406PMID:20732876
37. Bell JG, McEvoy J, Tocher DR, Sargent JR. Depletion of alpha-tocopherol and astaxanthin in Atlantic salmon (Salmo salar) affects autoxidative defense and fatty acid metabolism. J Nutr, 2000. 130(7): p. 1800–8. PMID:10867054
38. Hochgraf E, Mokady S, Cogan U. Dietary oxidized linoleic acid modifies lipid composition of rat liver microsomes and increases their fluidity. J Nutr, 1997. 127(5): p. 681–6. PMID:9164986
39. Osada K, Kodama T, Yamada K, Nakamura S, Sugano M. Dietary oxidized cholesterol modulates cho-lesterol metabolism and linoleic acid desaturation in rats fed high-chocho-lesterol diets. Lipids, 1998. 33(8): p. 757–64. PMID:9727605
40. Pratico D, Lawson JA, Rokach J, FitzGerald GA. The isoprostanes in biology and medicine. Trends Endocrinol Metab, 2001. 12(6): p. 243–7. PMID:11445440
41. Morrow JD, Hill KE, Burk RF, Nammour TM, Badr KF, Roberts LJ 2nd. A series of prostaglandin F2-like compounds are produced in vivo in humans by a non-cyclooxygenase, free radical-catalyzed mecha-nism. Proc Natl Acad Sci U S A, 1990. 87(23): p. 9383–7. PMID:2123555
42. Curek GD, Cort A, Yucel G, Demir N, Ozturk S, et al. Effect of astaxanthin on hepatocellular injury fol-lowing ischemia/reperfusion. Toxicology 2010. 267(1–3): p. 147–53. doi:10.1016/j.tox.2009.11.003 PMID:19900500
43. Yang Y, Kim B, Park YK, Koo SI, Lee JY. Astaxanthin prevents TGFβ1-induced pro-fibrogenic gene expression by inhibiting Smad3 activation in hepatic stellate cells. Biochim Biophys Acta, 2015. 1850 (1): p. 178–85. doi:10.1016/j.bbagen.2014.10.014PMID:25450180