FERNANDO AUGUSTO SCHMIDT
RESPOSTA DE COMUNIDADES DE FORMIGAS A UM GRADIENTE DE SUCESSÃO
Dissertação apresentada à Universidade Federal de Viçosa, como parte das exigências do Programa de Pós-Graduação em Entomologia, para obtenção do título de Magister Scientiae.
VIÇOSA
Ficha catalográfica preparada pela Seção de Catalogação e Classificação da Biblioteca Central da UFV
T
Schmidt, Fernando Augusto, 1981-
S351r Resposta de comunidades de formigas a um gradiente 2008 de sucessão / Fernando Augusto Schmidt. – Viçosa, MG,
2008.
viii, 34f. : il. (algumas col.) ; 29cm.
Texto em português e inglês.
Orientador: José Henrique Schoereder.
Dissertação (mestrado) - Universidade Federal de Viçosa.
Referências bibliográficas: f. 16-23.
1. Formiga - Ecologia. 2. Sucessão ecológica.
3. Diversidade biológica. 4. Biodiversidade - Conservação - Mata Atlântica. 5. Ecossistema - Mata Atlântica. I. Universidade Federal de Viçosa. II.Título.
FERNANDO AUGUSTO SCHMIDT
RESPOSTA DE COMUNIDADES DE FORMIGAS A UM GRADIENTE DE SUCESSÃO
Dissertação apresentada à Universidade Federal de Viçosa, como parte das exigências do Programa de Pós-Graduação em Entomologia, para obtenção do título de Magister Scientiae.
APROVADA: 22 de fevereiro de 2008.
Prof. Carlos Frankl Sperber (Co-Orientador)
Prof. Og Francisco Fonseca de Souza (Co-Orientador)
Prof. (a) Flávia Maria da Silva Carmo Dr. Rogério Rosa da Silva
AGRADECIMENTOS
À Universidade Federal de Viçosa, por meio do Departamento de Biologia Animal (DBA) e Programa de Pós-Graduação em Entomologia, por todo o apoio, treinamento e estrutura proporcionada.
À CAPES/PROF pelo suporte financeiro para a execução do projeto e pela concessão da bolsa de mestrado.
Ao Professor José Henrique Schoereder pela orientação, confiança e pelo incentivo em estudar ecologia de comunidades de formigas de forma causal e não especulativa.
Aos Professores Carlos Frankl Sperber e Og Francisco Fonseca de Souza pela co-orientação através das sugestões e críticas ao projeto de tese.
À Prof. (a) Flávia Maria da Silva Carmo e ao Dr. Rogério Rosa da Silva por terem aceitado o convite para participar da banca de defesa e pelas valiosas sugestões para a versão final da dissertação
Aos colegas do Projeto Sucessão Ecológica pelas valiosas sugestões ao projeto. Aos Professores Alexandre Francisco da Silva (In memoriam) e João de Meira Neto do Departamento de Biologia Vegetal/UFV, Professor Sebastião Venâncio Martins do Departamento de Engenharia Florestal/UFV, Rogério Ribas, Virgínia e Marcelo pelas valiosas informações a respeito dos fragmentos florestais utilizados para as coletas das formigas.
Ao NEPUT/UFV pelo fornecimento de fotografias aéreas dos fragmentos utilizados na tese.
Ao Cláudio técnico do Laboratório de Física de Solos do Departamento de Solos/UFV pelo o empenho em ensinar os procedimentos para coleta de amostras de solo e disposição para o empréstimo de material utilizado na coleta de amostras de solo. Ao Geraldo Chaves, Vitor Chaves, Gilmar da Botânica e Dona Terezinha por permitirem o acesso aos fragmentos florestais pertencentes a suas propriedades.
Aos colegas do Laboratório de Ecologia de Comunidades, em especial ao Ricardo Ribeiro de Castro Solar pela valiosa contribuição na elaboração e confecção das armadilhas do tipo “pitfall” utilizadas nas coletas de formigas e pela ajuda e companhia no trabalho de campo.
Ao Lucas, Washington, André, Zhé e os dois Marquinhos que participaram esporadicamente nos campos, porém ajudaram em muito para a realização dos campos dentro do período previsto.
Ao Rodrigo Feitosa pela amizade, coleguismo e pela dedicação em confirmar as identificações das espécies de formigas.
À Carla que desempenhou diversas funções no projeto da dissertação, desde motorista, auxiliar de campo até co-orientadora e orientadora não oficial. Porém, gostaria de agradecer especialmente o coleguismo e a amizade dispensada. Além de ter participado e sobrevivido heroicamente a todos os campos do projeto.
Ao Zhé pela amizade, compreensão e paciência. Além disso, por ser gaúcho, gremista e ter veraneado em Atlântida/Xangri-lá.
À Professora Elena Diehl pela orientação na iniciação científica e por me apresentar às formigas.
Aos colegas e amigos de república (atuais e do passado) pela amizade e companheirismo e pelos excelentes churrascos de meio kilo realizados na laje do prédio. Aos amigos de Viçosa e do Rio Grande do Sul que sempre estarão presentes em minhas boas lembranças.
A minha namorada Sabina por ser a estrela maior da minha vida, e pela valiosa ajuda na configuração da tese, além do companheirismo, paciência e carinho.
SUMÁRIO
RESUMO ...v
ABSTRACT...vii
1. INTRODUCTION...1
2. MATERIAL AND METHODS ...3
2.1. Study area...3
2.2. Sampling ants ...4
2.3. Identification of ant species ...5
2.4. Sampling explanatory variables ...5
2.4.1. Arboreal variables ...5
2.4.2. Epigaeic variables ...6
2.4.3. Hypogaeic variables ...6
2.5. Statistical analyses ...6
2.5.1. Analyses of the assumptions ...7
2.5.2. Analyses of hypotheses ...7
3. RESULTS ...8
4. DISCUSSION ...10
4.1. Ant fauna...10
4.2. Response of ant species richness to restoration time ...11
4.3. Response of ant species composition to restoration time...14
5. CONCLUSION ...15
RESUMO
SCHMIDT, Fernando Augusto, M.Sc., Universidade Federal de Viçosa, fevereiro de 2008. Resposta de comunidades de formigas a um gradiente de sucessão. Orientador: José Henrique Schoereder. Co-Orientadores: Carlos Frankl Sperber e Og Francisco Fonseca de Souza.
ABSTRACT
SCHMIDT, Fernando Augusto, M.Sc., Universidade Federal de Viçosa, February, 2008. Response of ant communities to a successional gradient. Adviser: José Henrique Schoereder. Co-Advisers: Carlos Frankl Sperber and Og Francisco Fonseca de Souza.
1. INTRODUCTION
Human activities, such as wood extraction, agriculture, pasture, forestry, mining practices and urbanization process have been responsible for disturbance in several pristine areas, most of them tropical forests (Denevan 1992; Guariguata & Ostertag 2001; Primack & Rodrigues 2001; Tilman et al. 2001; Rambaldi et al. 2003; Ruiz-Jaen & Aide 2005; Benhin 2006). Many of these explored areas are abandoned after a use and a natural forest restoration begins, resulting in secondary forest formations (Food and Agriculture Organization 1999; Guariguata & Ostertag 2001; Primack & Rodrigues 2001).
Nowadays, the area and amount of secondary forest increased very much representing a pronounced part of forest environments (Food and Agriculture Organization 1999). Secondary forests are composed by forest formations at different restoration times and could host distinct plant species number and composition according to the type, frequency and intensity of perturbation it suffered (Brown 1994, Pillar 1994).
Together with the process of vegetation restoration, the return of animal species may also occur (Davies et al. 1999; Siemann et al. 1999; Dunn 2004). Thus, secondary forests at different restoration time may represent a successional gradient of animal species number and composition (Dunn 2004). Nonetheless, the response of the fauna to forest restoration is not clear yet and depends on the animal group studied, and on the parameters of the animal community studied (e.g. species richness, species composition, abundance) (Azevedo-Ramos et al. 2005).
Among animals, the ants are highly abundant, diverse and have a wide geographic distribution (Hölldobler & Wilson 1990, Wilson 2003). Moreover, ants, together with termites, bees and wasps, make up 75% of insect biomass (Hölldobler & Wilson 1990). Thus, many studies have used ants as models in ecological studies (Agosti et al. 2000).
However, among these studies, ant species richness presented different responses to restoration time, such as positive (see Bustos & Ulloa-Chacón 1996-1997; Vasconcelos 1999; Silva et al. 2007) or a non-significant relationship between species richness and forest regeneration (see Belshaw & Bolton 1993, Estrada & Fernández 1999; Nichols & Nichols 2003; Ottonetti et al. 2006). Nonetheless, ant species composition has demonstrated a changing along habitats at different restoration time (see Bustos & Ulloa-Chacón 1996-1997, Vasconcelos 1999, Estrada & Fernández 1999; Nichols & Nichols 2003; Ottonetti et al. 2006). Nevertheles, among these studies, few try to explain the response of ant species richness or composition to forest restoration (e.g. Bustos & Ulloa-Chacón 1996; Estrada & Fernández 1999), linking the patterns of ant communities with the variations of environmental factors inherent to the forest restoration process.
In studies of ant communities structure, the regulation of species richness and composition have been associated with some environmental factors, such as structural heterogeneity, resource quantity and diversity (e. g. Ribas et al. 2003a, Armbrecht et al. 2004, Corrêa et al. 2006, Ribas et al. 2007, Vargas et al. 2007). In these studies, the environmental factors are estimated by measures of plant density and species richness, litter quantity and diversity. These estimates could act as surrogates for the factors that regulate ant species number and composition.
In the process of forest restoration, structural heterogeneity, resource quantity and diversity may increase as time passes (Brown 1994, Aide et al. 1996, Guariguata & Ostertag 2001). Therefore, changes in these factors could support and explain the response of ant communities to forest restoration.
Such as the present, studies that construct explanatory hypothesis to explain the observed patterns on ant communities along a successional gradient might be very helpful to understand the ecological mechanisms involved in the response of insect communities to vegetation restoration. Furthermore, collect ants from different microhabitats could be useful to the application of ant species as bio-indicators in restoration programs of impacted areas, because if ants from different microhabitats have distinct ecological characteristics that could result in different responses to forest restoration process this need to be considered when this insects are used as a framework to assess the level of environmental conservation or restoration (Azevedo-Ramos et al. 2005).
In this study we verified the response of ant communities to time of sucession, testing two assumptions: (i) the response of ant species richness sampled at three microhabitats (arboreal, epigaeic and hypogaeic) is different from each other in a successional gradient; (ii) in each microhabitat the species composition (ant species frequency occurrence) changes along the successional gradient. We tested the following hypotheses to explain the possible changes on species richness and composition: (a) in a successional gradient there is an increase in resources and modifications of conditions that support the changes in ant species richness and ant species frequency occurrence (the number of times that an ant species was collected) along the gradient; (b) in a successional gradient there is an increase of the structural and resource heterogeneity that represent a complementary way to support the changes in ant species richness and frequency occurrence.
2. MATERIAL AND METHODS
2.1. Study area
We carried out the study in Viçosa, Minas Gerais state, south-eastern Brazil. The forests of the region are described as semidecidous seasonal rainforest (Veloso et al. 2001), a forest formation of the Atlantic Rain Forest biome (IBGE 2004).
From the 1960s onwards agriculture declined in the region and several forest areas recovered to secondary forests (Meira-Neto & Martins 2000; Sevilha et al. 2001). Today, native forest is a mosaic of forest remnants with different sizes, shapes and stages of succession, forming an excellent system to study the effects of fragmentation and forest restoration process.
2.2. Sampling ants
Between January and February 2007 we sampled ants at eight areas with different restoration times in the region above described. These areas, ranged form one pasture and seven forest remnants with 7 to 120 years (Table I). In each area, we sampled ants in three microhabitats (arboreal, epigaeic and hypogaeic) using pitfall traps.
The pitfall traps consisted of plastic recipients (diameter = 8 cm; height = 12 cm) with an inner smaller recipient. In the inner smaller recipient we set two small plastic pots (empty boxes of photographic film, 3.3 cm diameter; 5.0 cm height), where we put baits (sardine and honey) in each one. In the space between the inner recipient and pitfall wall we put a liquid solution (water, detergent and salt) that kept and killed the ants in the trap and avoided their contact with the baits.
The epigaeic pitfall traps were buried so that was at the soil level. The arboreal pitfall traps were tied at ca 1.3 m high to the trunks of trees. The hypogaeic pitfall traps were buried under soil surface, 20 cm into the soil, and had some adaptations: (i) the plastic recipient was closed with a lid, to avoid being filled with soil; (ii) to allow the ants to access the trap four holes (1 cm diameter) were made in the plastic recipient at height of 6 cm; (iii) a string with a colored ribbon was tied to find the place where the hypogaeic pitfall was buried.
2.3. Identification of ant species
We sorted and identified the collected ants to genera with the help of the identification keys of Bolton (1994) and Palacio & Fernández (2003). We adopted the subfamily classification suggested by Bolton (2003).
Species identification was carried out according to the Formicidae reference collection of the Laboratório de Ecologia de Comunidades – UFV, where all voucher specimens were deposited, and to taxonomic keys and genera revision papers available at www.antbase.org (Agosti & Johnson 2007).
2.4. Sampling explanatory variables
In each sampling unit we collected data that were used as surrogates of resources and conditions of the three ant microhabitats. The collected data were specific for each microhabitat and are explained in the following topics.
2.4.1. Arboreal variables
Around each sampling unit we determined an area (length = 5 m; width = 2 m), in which we counted the number of trees with trunk circumference equal or higher than 15 cm at 1.3 m height. These data (tree density) were used as a surrogate of resource availability to arboreal ants. These estimates are supported by the studies by Ribas et al. (2003a) and Ribas & Schoereder (2007), who reported that tree density positively influences arboreal ant species richness and composition.
2.4.2. Epigaeic variables
We used litter depth as a surrogate for resources of this microhabitat. In each sampling unit, the litter depth was measured just beside the pitfall, using a digital caliper. Litter depth and other data of herb stratum have been described as determining factors of ant diversity (Corrêa et al. 2006, Vargas et al. 2007). Litter depth was used as a surrogate of resource availability to epigaeic ants because litter abundance may represent, direct or indirectly, food source to ant species.
The percentage of vegetation cover was used as a surrogate for conditions with methodology similar to that described above for arboreal microhabitat. However, the digital photos were taken with the camera at soil surface level and beside the site where the epigaeic pitfall was set.
2.4.3. Hypogaeic variables
In each sampling unit beside the site where the hypogaeic pitfall was set, we collected a soil sample of superficial soil layer with a small shovel, to analyze the percentage of organic matter. This was used as a surrogate of resource availability for ants living in this microhabitat. Moreover, another soil sample was collected by the methodology of undisturbed samples with metal core of known volume (116.60 cm3) to analyze soil density (g/cm3), which was used as a surrogate of conditions in this microhabitat.
The environmental factors that influence hypogaeic ant communities have not been much understood (Silva & Silvestre 2004, Wilkie at al. 2007). We used these estimates, because we expect that organic matter and soil density may be good surrogates of resources availability and conditions to explain the variations on species richness and composition of hypogaeic ant communities.
2.5. Statistical analyses
2.5.1. Analyses of the assumptions
To test the assumption (i), that the response of species richness of ant communities sampled at three microhabitats (arboreal, epigaeic and hypogaeic) to a successional gradient is different, we carried out a statistical model in which ant species richness was the response variable, and restoration time, microhabitat type and the interaction between them were the explanatory variables. We also included in the model the size of the area as a co-explanatory variable, because this factor has a strong and positive influence on ant species richness (Ribas et al. 2005). The model was analyzed by analysis of co-variance with Poisson errors distribution.
The test of assumption (ii), that in each microhabitat, ant species composition changes along the successional gradient. We analysed the changes in ant composition by the changes in ant species frequency occurrence (the number of times that an ant species was collected along ten sample units of each microhabitat in the sampled areas). Then, we expected that among the areas (that represent different restoration time) ant species will change.
We did the test of assumption (ii) only with species that were more frequently collected (species that were collected in three or more areas). We selected these species because we expected a logistic response of the frequency to restoration time, and therefore species with low frequencies would bias the response of the test. We created a model in which species frequency was the response variable and restoration time, species identity and the interaction between them were the explanatory variables. The random term was composed by species identity given fragment. We expected that, if ant species frequency was determined by restoration time, different ant species would respond differently to restoration time and the interaction between species identity and restoration time would be significant. To avoid the effects of pseudo-replication, the model was analyzed using linear mixed model, with the response variable transformed with logit link and Binomial errors distribution.
2.5.2. Analyses of hypotheses
sampled area (hypothesis “a”), as well their coefficient of variations (CV) (hypothesis “b”), which indicate the heterogeneity of resources and conditions.
The relationships between the sampled variables, both averages and CVs, with restoration time were analyzed using simple linear regression, using normal errors to averages of surrogates of resources and conditions and binomial errors to CV of these same surrogates. The relationship between ant species richness and the variables estimated was analyzed through a multiple linear regression, using Poisson errors.
In the model that analyzed the relationship between ant species richness and the variables estimated, the species richness was considered as the accumulated number of species sampled in each microhabitat and was used as response variable. The sampled variables (surrogates of resources and conditions) were used as explanatory variables and the interaction between the variables was included in the models. This model was carried out separately in each ant microhabitat (arboreal, epigaeic and hypogaeic).
The relationship between ant species frequency and sampled variables (surrogates of resources and conditions) along the successional gradient was analyzed through simple linear regression, using Binomial errors. We carried out the analyses only with the ant microhabitats which had a significant model of assumption (ii).
3. RESULTS
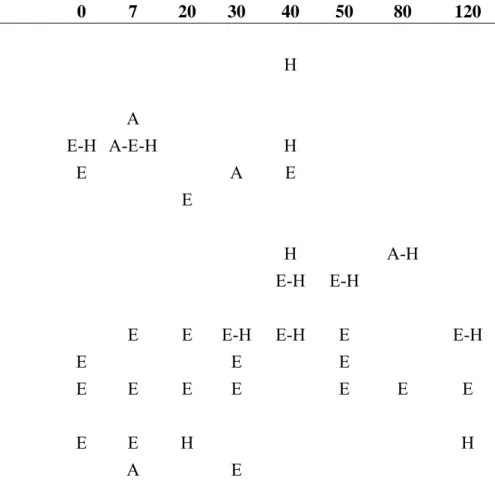
In all areas (forests and pasture) and microhabitats sampled, we collected 77 ant species from 36 genera and nine subfamilies. The more speciose subfamily was Myrmicinae (45 species), followed by Formicinae (11 species), Ponerinae (nine species), Dolichoderinae (four species), Ectatomminae (three species) and Ecitoninae (two species). Cerapachyinae, Heteroponerinae, and Pseudomyrmecinae each contained only one species (Table 2).
We did not find a significant relationship between ant species richness and restoration time in any of the microhabitats (p = 0.67; Figure 1). Moreover, we also did not find a significant relationship between ant species richness and fragment area (p = 0.33).
Among the surrogates of resources and conditions, in arboreal microhabitat average tree density (F1,6 = 12.74; p = 0.01; r2 = 0.67; Figure 3a) had a significant increase and CV of vegetation cover (χ2 = 3.40; gl = 5; p < 0.01; Figure 3b) had a significant decrease along the successional gradient. Furthermore, in epigaeic microhabitat average litter depth (F1,6 = 5.29; p = 0.06; r2 = 0.47; Figure 3c) and average vegetation cover (F1,6 = 5.21; p = 0.06; r2 = 0.46; Figure 3d) had a trend to increase along the successional gradient and CV of vegetation cover (χ2 = 20.35; gl = 5; p = 0.06; Figure 3e) had a trend to decrease along the restoration time. Nonetheless, the relationship between these epigaeic variables with restoration time was just marginal significant.
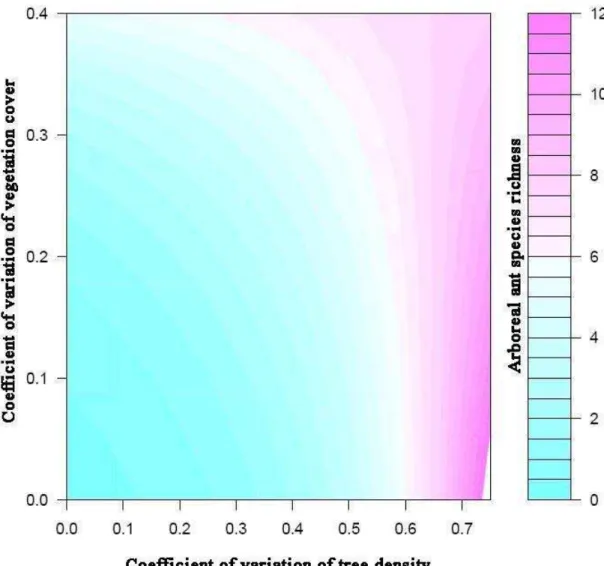
The epigaeic and hypogaeic ant species richness did not have any significant relation with the surrogates of resources and conditions of these microhabitats. However, arboreal ant species richness had a significant relationship with the interaction between heterogeneity of resources and conditions (CV of tree density and CV of vegetation cover respectively) (χ2 = 4.24; gl = 4; p = 0.03; Figure 4).
The model of assumption (ii), that the species composition changes along the successional gradient, was significant for epigaeic ants (p = 0.01) and non-significant for arboreal ants (p = 0.36) and hypogaeic ants (p= 0.07). However, we did not find a significant relationship between epigaeic ant species composition and restoration time (p = 0.11) and the significance of the model was attributed to differences of frequency between the ant species analyzed.
Although we did not find a significant relationship between epigaeic ant species composition and restoration time, when we used all species in the model, the frequency of eight species had a positive interaction with restoration time. These species, therefore, increased their frequencies of occurrence along the successional time. The ant species were Camponotus (Myrmothrix) cingulatus Mayr, 1862 (p = 0.002), Gnamptogenys striatula Mayer, 1883 (p = 0.03), Odonthomachus chelifer (Latreille, 1802) (p = 0.03), Pheidole sp. E (p = 0.01), Pheidole sp. M (p = 0.02), Solenopsis sp. F (p = 0.05), Solenopsis sp. M (p = 0.04), Solenopsis sp. O (p = 0.05). The response of the frequency of these eight species was the same (Figure 5).
The frequency of Pheidole sp. E and Pheidole sp. M had a positive relationship with average litter depth (χ2 = 9.62; p = 0.005; Figure 6a; χ2 = 9.12; p = 0.0004; Figure 6b; respectively). The frequency of Pheidole sp. M had a positive relationship with average vegetation cover (χ2 = 11.72; p = 0.001; Figure 6c). The frequency of Solenopsis sp. M had a positive relationship with average of litter depth (χ2 = 7.07; p = 0.05; Figure 6d). The frequency of Solenopsis sp. F had a positive relationship with coefficient of variation of litter depth (χ2 = 3.64; p = 0.04; Figure 6e). Although, marginal significant, the frequency of Odontomachus chelifer had a positive relationship with average litter depth (χ2 = 6.30; p = 0.07; Figure 6f).
4. DISCUSSION
4.1. Ant fauna
The distribution of the number of ant species along the nine ant subfamilies sampled, which the four more speciose subfamilies were Myrmicinae, Formicinae, Ponerinae and Dolichoderinae agrees with the general pattern of diversity of ant species in Neotropical region (Fernández & Ospina 2003).
The number of ant species (77) collected in our study was smaller than the number of ant species sampled in recent studies carried out in Viçosa region (Sobrinho et al. 2003; Ribas et al. 2005; Sobrinho & Schoereder 2007) in which the number of ant species ranged from 117 – 119. However, Sobrinho et al. (2003), Ribas et al. (2005) and Sobrinho & Schoereder (2007) collected ants in more forest habitats and Sobrinho & Schoereder (2007) used ‘Winkler’ extractor to sample ant species, and these differences could improve the ant sampling effort. Nevertheless, we sampled ant fauna of three different microhabitats, using arboreal, epigaeic and hypogaeic traps. The latter trap was responsible for the sampling of ant species such as Acanthostichus laticornis Forel, 1908 and Simopelta minima (Brandão 1989) (Table 2), which were not sampled by Sobrinho et al. (2003), Ribas et al. (2005) and Sobrinho & Schoereder (2007), who used colleting methodology that essentially sample epigaeic and litter ants.
Overall, the great and surprising data about the ant fauna sampled in our study was the sampling of 11 workers of S. minima (10 workers sampled by hypogaeic pitfalls and one by epigaeic pitfall) in the initial secondary forest with seven years of restoration after a fire disturbance. This ant species was collected the first time in 1986–1987 in a sampling of only four workers extracted from 0–15 cm deep soil samples in Berlese funnels from a small, old shaded cocoa plantation in Ilhéus, state of Bahia, eastern Brazil. These four ant workers were used to describe S. minima ant species by Brandão (1989). After the description, S. minima has not been collected anymore and Brazilian environmental institutions decided to consider the ant species as extinct (MMA 2007), consisting of the first register of an extinction of an ant species in the world by human activities (Brandão, personal communication). Nonetheless, with our sampling, S. minima was “rediscovered”, but in fact its rarity and status of conservation is due to the passive ant sampling methods that focus essentially on epigaeic ants and have systematic missed ants that live in other microhabitats such as hypogaeic (Underwood & Fisher 2006). The criteria employed to determine rarity and conservation status in ant species could be inaccurate because do not consider the biological properties that support rarity and conservation status (Brandão personal communication).
4.2. Response of ant species richness to restoration time
The ant species richness response to restoration time is so variable that a pattern is very difficult to be spotted (Underwood & Fischer 2006). However, Dunn (2004) reported that the response of ant species richness to forest regeneration can be predicted and after 40 years of forest restoration the ant species richness of secondary forests is similar to mature forests. There are other studies that show a positive increase of ant species richness along the forest restoration process (see Bustos & Ulloa-Chacón 1996-1997; Vasconcelos 1999; Silva et al. 2007). However, some ant groups could show different patterns with forest restoration, such as a positive increase (litter ants) or a unimodal pattern (canopy ants) (see Lawton et al. 1998). Finally, some studies did not find a significant relationship between ant species richness and forest regeneration (see Belshaw & Bolton 1993, Estrada & Fernández 1999; Nichols & Nichols 2003; Ottonetti et al. 2006).
any of the microhabitats. Moreover, the surrogates of resources and conditions, with the exception of tree average density and CV of vegetation cover (both from arboreal microhabitat), also did not have a significant change along the habitats at different restoration time. Then, if the described relationship between ant species richness and environmental factors holds true (Ribas et al. 2003a, Armbrecht et al. 2004, Corrêa et al. 2006, Ribas et al. 2007, Vargas et al. 2007) we could expect that if the most of surrogates of resources and conditions did not change with restoration time, the ant species richness consequently would not change along the successional gradient.
Belshaw & Bolton (1993) explained the fact that ant fauna from Ghana continue to survive in agricultural areas and secondary forests due to the high quantity and extension of primary forest that may serve as sources for re-colonization of the ant fauna in these areas. Ribas et al. (2005) sampled epigaeic ants in many forests remnants in Viçosa region and concluded that groups of small remnants have similar local species richness than a single large forest remnant. Then, a plausible hypothesis for the non-significant relationship between species richness and restoration time in our study is that in Viçosa region there is a great quantity of forest remnants (Sevilha et al. 2001) that host high ant species richness (Ribas et al. 2005) and may represent a source of re-colonization to areas in initial stages of succession. Due to the short distances among the forest remnants, the ant species re-colonization process may be rapid in disturbed areas and differences on ant species richness among forests remnants at different restoration times could be realized immediately after the disturbance event and could be more noticeable in small spatial and temporal scales (Campos et al. 2007).
Although the studies cited above described a pronounced vertical stratification among ant fauna at arboreal, epigaeic and hypogaeic, the high ant species number of epigaeic microhabitat in our study may be due to two factors. The first may be the actual large number of specialist ant species in epigaeic microhabitat. The second factor may be the location of the epigaeic microhabitat, which is between arboreal and hypogaeic microhabitats. This location would allow generalist ants to move among the different microhabitats and to be collected by epigaeic pitfall traps. However, these possible explanations of our results must be confirmed to evaluate which ant species are specific from each microhabitat and which could live in more than one microhabitat and the consequent implications on ant species richness of each microhabitat.
Nevertheless, we collected ants from different microhabitats by the same sample methodology (pitfall traps) that had the same baits (sardine and honey) and remained in the field by the same time (48 hours). The recipients used as pitfall traps put in all microhabitats had the same physical structure though the hypogaeic pitfall had some adaptations (see Sampling ants in Material and Methods) that did not mean difference in the ant sample efficiency of hypogaeic pitfall traps in relation to epigaeic and arboreal pitfall traps. This sampling design could offer safer and less dubious results about ants stratification than those found in the previous studies reported above, which used different ant collect techniques in each microhabitat sampled.
Arboreal vegetation data have been reported by Ribas et al. (2003 a) and Ribas and Schoereder (2007) as determining factors of arboreal ant species richness. These factors are tree density (estimates of resource availability) in Brazilian savanna (“cerrado”) (Ribas et al., 2003 a) although in the Brazilian Pantanal this influence was not found (Ribas and Schoereder, 2007). Nonetheless, estimates of structural heterogeneity such as species tree density (Ribas et al., 2003 a) and CV of distance among trees (Ribas and Schoereder, 2007) influenced positively and significantly the arboreal ant species richness from Brazilian savanna (“cerrado”) and Brazilian Pantanal. Our data showed that estimates of arboreal conditions could have a stronger influence on ant species richness than estimates of arboreal resource, which could be dubious, because its effect should be related with specific characteristics of the study area (Ribas et al., 2003 a; Ribas and Schoereder, 2007).
4.3. Response of ant species composition to restoration time
Studies that verified the response of ant communities to successional gradients have found changes on ant species composition (Bustos & Ulloa-Chacón 1996-1997, Vasconcelos 1999, Estrada & Fernández 1999; Nichols & Nichols 2003; Ottonetti et al. 2006). However, these studies have analyzed differences on species composition among the sites in distinct restoration times by Sørensen similarity coefficient followed by cluster analyses or by ordination analyses. Although these analyses can separate groups of ant species that reflect the ant fauna of sites in different restoration times, the analyses carried out in previous studies usually do not show the statistical significance of the results. Therefore, because there were no hypotheses testing, it was impossible to decide whether there was a real change in community composition along time or compare these results.
Although, the frequency of Odontomachus chelifer, Pheidole sp. E, Pheidole sp. M, Solenopsis sp. F Solenopsis sp. M had marginally significant and significant relation with surrogates of resources and conditions of epigaeic microhabitat, these surrogates did not have significant relationship with restoration time, then they should not be used to support and explain the change in the frequency of the ant species cited above.
Regardless, the relationship between frequency of ant species and litter depth was found also by Vargas et al. (2007) who found a positive relation between ant abundance (number of occurrence of ant species) and litter depth for ant fauna of Restinga community in Rio de Janeiro south-eastern Brazil. Moreover, Corrêa et al. (2006) found a positive relationship between ant species richness and herb vegetation density. Then, the significant relationship between the frequency of Pheidole sp. E, Pheidole sp. M, Solenopsis sp. F and Solenopsis sp. M with litter depth and vegetation cover indicates that vegetation data could be determining factors of ant communities in our study.
5. CONCLUSION
Our study showed that the response of ant communities to successional gradient may be weak. The relationship between ant species richness and restoration time in the spatial and temporal scale that were analyzed could be affected by non-considered factors such as the short distances among the forest remnants. These short distances may allow rapid ant species re-colonization in disturbed areas, causing small, differences on ant species richness among forests remnants at different restoration times. The restoration of ant fauna could be realized immediately after the disturbance event and therefore the disturbance would be more noticeable in smaller spatial and temporal scales (Campos et al. 2007).
The response of species composition, analyzed by species frequency may be dubious because composition did not respond to the successional gradient, but the frequency of some ant species have a positive relationship with restoration time. However, the differences observed in relation to other studies may be due to the different types of statistical analyses used, which do not allow conclusive comparisons.
different patterns, a single method to assess the changes of composition is wanted, to allow comparative studies.
More research is needed on the mechanisms that link the response of ant communities to the ecological conditions of the environment and human disturbance among spatial and temporal scales, facilitating the use of ants as indicators of the restoration process. Nevertheless, we think that a careful way to applied data of ant communities as bio-indicators of ecological conditions have be by the development of hypotheses that explain the response of ant communities to the restoration process in study.
6. REFERENCES
AIDE, T. M.; ZIMMERMAN, J. K.; ROSARIO, M.; MARCANO, H. 1996. Forest recovery in abandoned cattle pastures along an elevational gradient in northeastern Puerto Rico. Biotropica. 28 (4a): 537 – 548.
AGOSTI, D.; MAJER, J. D.; ALONSO, L. E. A.; SCHULTZ, T. R. 2000. Ants: Standard methods for measuring and monitoring biodiversity. Smithsonian Institution Press, Washington and London, 280 p.
AGOSTI, D.; JOHNSON, N. F. 2007. Antbase - World Wide electronic publication. antbase.org. <http://www.antbase.org>. Acesso em 20 out. 2007.
ANDERSEN, A. 1995. A classification of Australian ant communities, based on functional groups which parallel plant life-forms in relation to stress an disturbance. Journal of Biogeography. 22: 15 – 29.
ANDERSEN, A. 2000. A global ecology of rainforest ants: Functional groups in relation to environmental stress and disturbance. p. 25 – 34. In: AGOSTI, D.; MAJER, J. D.; ALONSO, L. E. A.; SCHULTZ, T. R. (eds). Smithsonian Institution Press, Washington and London, 280 p.
exploração madeireira em Florestas Tropicais. Belém do Pará, PA: Instituto de Pesquisa Ambiental da Amazônia. 62 p.
BELSHAW, R. & BOLTON, B. 1993. The effect of forest disturbance on the leaf litter ant fauna in Ghana. Biodiversity and Conservation. 2: 656 – 666.
BELSHAW, R. & BOLTON, B. 1994. A survey of the leaf litter ant fauna in Ghana, West Africa (Hymenoptera: Formicidae). Journal of Hymenoptera Research. 3: 5 – 16.
BENHIN, J. K. A. 2006. Agriculture and deforestation in the tropics: A critical theoretical and empirical review. Ambio. 35 (1): 9 – 16.
BERGHOFF, S. M.; MASCHWITZ, U.; LINSEMAIR, K. E. 2003. Hypogaeic and epigaeic ant diversity on Borneo: evaluation of baited sieve buckets as study method. Tropical Zoology 16: 153-163.
BOLTON, B. 1994. Identification guide to the ant genera of the world. Harvard University Press, Cambridge, 201p.
BOLTON, B. 2003. Synopsis and classification of Formicidae. The American Entomological Institute, Gainesville, 370p.
BRANDÃO, C. R. F. 1989. Belonopelta minima new species (Hymenoptera, Formicidae, Ponerinae) from eastern Brazil. Revista Brasileira de Entomologia 33: 135–138.
BROWN, V. K. 1994. The effects of changes in habitat structure during succession in terrestrial communities. p. 141 – 168. In: BELL, S. S.; McCOY, E. D.; MUSHINSKY, H. R. (eds). Habitat structure: The physical arrangement of objects in space. Chapman and Hall, London, 438 p.
BRÜHL, C. A., GUNSALAM, G. LINSENMAIR, K. E. 1998. Stratification of ants (Hymenoptera, Formicidae) in a primary rain forest in Sabah, Borneo. Journal of Tropical Ecology. 14: 285 – 297.
CAMPOS, R. B. F.; SCHOEREDER, J. H.; SPERBER, C. F. 2007. Small-scale patch dynamics after disturbance in litter ant communities. Basic and Applied Ecology. 8: 36 – 43.
CASTRO, A.G.; QUEIROZ, M.V.B.; ARAÚJO, L.M. 1990. O papel do distúrbio na estrutura de comunidades de formigas (Hymenoptera, Formicidae). Revista Brasileira de Entomologia. 34 (1): 201 – 213.
CERDÁ, X. RETANA, J.; CROS, S. 1997. Thermal disruption of transitive hierarchies in Mediterranean ant communities. Journal of Animal Ecology. 66: 363 – 374. CORRÊA, M. M.; FERNANDEZ, W. D.; LEAL, I. R. 2006. Diversidade de formigas
epigéicas (Hymenoptera: Formicidae) em Capões do Pantanal Sul Matogrossense: Relações entre riqueza de espécies e complexidade estrutural da área. Neotropical Entomology. 35 (6): 724 – 730.
CRAWLEY, M. J. 2002. Statistical computing – An introduction to data analysis using S-plus. John Wiley and Sons, England. 772 p.
DAVIES, R. G.; EGGLETON, P.; DIBOC, L. LAWTON, J. H.; BIGNELL, D. E.; BRAUMAN, A.; HARTMANN, C. NUNES, L.; HOLT, J. & ROULAND, C. 1999. Successional responses of tropical forest termite assemblage to experimental habitat perturbation. Journal Applied Ecology. 36. 946 – 962.
DELABIE, J. H. C. & FOWLER, H. G. 1995. Soil and litter cryptic ant assemblages of Bahian cocoa plantations. Pedobiologia. 39: 423 – 433.
DENEVAN, W. M. 1992. The pristine myth: The landscape of the Americas in 1492. Annals of the Association of American Geographers. 82(3): 369 – 385.
DUNN, R. R. 2004. Recovery of faunal communities during tropical forest regeneration. Conservation Biology, 18 (2): 302 – 309.
ESTRADA, M. C. & FERNÁNDEZ. C. F. 1999. Diversidad de hormigas (Hymenoptera: Formicidae) en un gradiente sucesional del bosque nublado (Nariño, Colombia). Revista de Biologia Tropical 47 (1-2): 189 – 201.
region Neotropical. Instituto de Investigación de Recursos Biológicos Alexander von Humbolt, Bogotá, Colômbia. 424 p.
FOWLER, H. C. & DELABIE, J. H. C. 1995. Resource partitioning among epigaeic and hypogaeic ants (Hymenoptera: Formicidae) of a Brazilian cocoa plantation. Ecología Austral. 5: 117 – 124.
FOWLER, H. C., DELABIE, J. H. C. & MOUTINHO P. R. S. 2000. Hypogaeic and epigaeic ant (Hymenoptera: Formicidae) assemblages of atlantic costal rainforest and dry mature and secondary Amazon forest in Brazil: Continuums or communities. Tropical Ecology. 41(1): 73 – 80.
FOOD AND AGRICULTURE ORGANIZATION (FAO). 2005. State of the world’s forests 2005. FAO. Rome. 166 p.
FRAZER, G. W., CANHAM, C. D. & LERTZMAN, K. P. 1999. Gap Light Analyzer (GLA): Imaging software to extract canopy structure and gap light transmission indices from true-colour fisheye photographs, user manual and program documentation. Simon Fraser University, Burnaby, British Colombia, and the Institute of Ecosystem Studies, Millbrook, New York.
FUNDAÇÃO CENTRO TECNOLÓGICO DE MINAS GERAIS – CETEC. 1983. Diagnóstico ambiental do estado de Minas Gerais. Belo Horizonte. 158 p. (Série de Publicações Técnicas, 10).
GUARIGUATA, M. R.; OSTERTAG, R. 2001. Neotropical secondary forest succession: changes in structural and functional characteristics. Forest Ecology 148: 185 – 206.
HÖLLDOBLER, B. & Wilson, E. O. 1990. The ants. Belknap Press of Harvard University Press, Cambridge. 732p.
IBGE. 2004. Mapas de Biomas do Brasil. Disponível em <ftp://ftp.ibge.gov.br/Cartas_e_Mapas/Mapas_Murais/> Acesso em 26 out. 2006.
LAWTON, J. H.; BIGNELL, D. E.; BOLTON, B. BLOEMERS, G. F.; EGGLETON, P.; HAMMOND, P. M.; HODDA, M.; HOLT, R. D.; LARSEN, T. B.; MAWDSLEY, N. A.; STORK, N. E.; SRIVASTAVA, D. S.; WATT, A. D. 1998. Biodiversity inventories, indicator taxa and effects of habitat modification in tropical forest. Nature. 391 (1): 72 – 75.
LEAL, I.R.; FERREIRA, S.O.; FREITAS, A.V.L. 1993. Diversidade de formigas de solo em um gradiente sucessional de Mata Atlântica, ES, Brasil. Biotemas. 6 (2): 42 - 53.
MARQUES, G. D. V. & DEL-CLARO, K. 2006. The ant fauna in a Cerrado area: the influence of vegetation structure and seasonality (Hymenoptera: Formicidae). Sociobiology 47: 235-252.
MEIRA-NETO, J. A. A.; MARTINS, F. R. 2000. Estrutura da mata da silvicultura, uma Floresta Estacional Semidecidual Montana no município de Viçosa – MG. Revista Árvore. 24 (2): 151 – 160.
MMA. 2007. Lista Nacional das Espécies da Fauna Brasileira Ameaçadas de Extinção. Ministério do Meio Ambiente. http://www.mma.gov.br/port/ sbf/fauna / index.cfm. Acessado em 17 de ago. de 2007.
NICHOLS, O. G.; NICHOLS, F. M. 2003. Long-term trends in faunal recolonization after bauxite mining in the Jarrah Forest of Southwestern Australia. Restoration Ecology. 11 (3): 261 – 272.
OTTONETTI, L.; TUCCI, L.; SANTINI, G. 2006. Recolonization patterns of ants in a rehabilitated lignite mine in Central Italy: Potential for the use of Mediterranean ants as indicators of restoration processes. Restoration Ecology. 14 (1): 60 – 66.
PALACIO, E. E. & FERNÁNDEZ, F. 2003. Claves para las subfamilias y géneros. 233 – 260 p. In: FERNÁNDEZ, F. (ed). Introducción a las hormigas de la region Neotropical. Instituto de Investigación de Recursos Biológicos Alexander von Humbolt, Bogotá, Colômbia. 424 p.
PRIMACK, R. B. & RODRIGUES, E. 2001. Biologia da conservação. Londrina. 328 p. R Development Core Team (2005) R: A language and environment for statistical
computing. R Foundation for Statistical Computing, Viena, Austria. ISBN 3-900051-00-(3) URL<http://www. R-project.org>.
RAMBALDI, D. M.; OLIVEIRA de, D. A. S. (orgs) 2003. Fragmentação de Ecossistemas: Causas, efeitos sobre a biodiversidade e recomendações de políticas públicas. Brasília: MMA/SBF. 510 p.
RIBAS, C. R.; SCHOEREDER, J. H.; PIC, M.; SOARES, S. M. 2003a. Tree heterogeneity, resource availability, and larger scale process regulating arboreal ant species richness. Austral Ecology. 28: 305 – 314.
RIBAS, R. F.; MEIRA-NETO, J. A. A.; SILVA, A. F. & SOUZA, A. L. 2003b. Composição florística de dois trechos em diferentes etapas serais de uma Floresta Estacional Semidecidual em Viçosa, Minas Gerais. Revista Árvore. 27(6): 821 – 830.
RIBAS, C. R.; SOBRINHO, T. G.; SCHOEREDER, J. H.; SPERBER, C. F.; LOPES-ANDRADE, C. 2005. How large is large enough for insects? Forest fragmentation effects at three spatial scales. Acta Oecologica. 27: 31 – 41.
RIBAS, C. R.; SCHOEREDER, J. H. 2007. Ant communities, environmental characteristics and their implications for conservation in the Brazil Pantanal. Biodiversity and Conservation. 16: 1511 – 1520.
RUIZ-JAEN, M. C. & AIDE, T. M. 2005. Restoration success: How is it being measured? Restoration Ecology 13 (3): 569 – 577.
SCHNELL, M. R.; PIK, A. J.; DANGERFIELD, J. M. 2003. Ant community succession within eucalypt plantations on used pasture and implications for taxonomic sufficiency in biomonitoring. Austral Ecology. 28: 553 – 565.
SCHMIDT, F. A. & DIEHL, E. (in press). What is the effect of soil use on ant communities? Neotropical Entomology 37 (4).
Universidade Federal de Viçosa (Face Sudoeste), Viçosa, Minas Gerais. Revista Árvore. 25 (4): 431 – 443.
SIEMANN, E.; HAASTAD, J.; TILMAN, D. 1999. Dynamics of plant and arthropod diversity during old field succession. Ecography 22: 406 – 414.
SILVA, R. R.; SILVESTRE, R. 2004. Riqueza da fauna de formigas (Hymenoptera: Formicidae) que habita as camadas superficiais do solo em Seara, Santa Catarina. Papéis Avulsos de Zoologia. 44(1): 1 -11.
SILVA, R. R.; FEITOSA, R. S. M.; EBERHARDT, F. 2007. Reduced ant diversity along a habitat regeneration gradient in the southern Brazilian Atlantic Forest. Forest Ecology and Management. 240: 61 – 69.
SOBRINHO, T. G.; SCHOEREDER, J. H.; SPERBER, C.F.; MADUREIRA, M. S. 2003. Does fragmentation alter species composition in ant communities (Hymenoptera: Formicidae)? Sociobiology. 42 (2): 329 – 342.
SOBRINHO, T. G. & SCHOEREDER, J. H. 2007. Edge and shape effects on ant (Hymenopter: Formicidae) species richness and composition in forest fragments. Biodiversity and Conservation. 16: 1459 – 1470.
TILMAN, D.; FARGIONE, J.; WOLFF, B.; D’ANTONIO, C.; DOBSON, A.; HOWARTH, R.; SCHINDLER, D.; SCHLEDINGER, W. H.; SIMBERLOFF, D. & SWACKHAMER, D. 2001. Forecasting agriculturally driven global environmental change. Science. 292: 281-284.
VALVERDE, O. 1958. Estudo regional da Zona da Mata de Minas Gerais. Revista Brasileira de Geografia. 20(1): 3 – 82.
VARGAS, A. B.; MAYHÉ-NUNES, A. J.; QUEIROZ, J. M.; SOUZA, G. O.; RAMOS, E. F. 2007. Efeitos de fatores ambientais sobre a mirmecofauna em comunidade de Restinga no Rio de Janeiro, RJ. Neotropical Entomology. 36 (1): 28 – 37.
VASCONCELOS, H. L. & VILHENA, J. M. S. 2006. Species turnover and vertical partitioning of ant assemblages in the Brazilian Amazon: A comparasion of forests and savanas. Biotropica. 38(1): 100 – 106.
VELOSO, H. P.; RANGEL FILHO, A. L. R. & LIMA, J. C. A. 1991. Classificação da vegetação brasileira, adaptada a um sistema universal. Rio de Janeiro: IBGE. 123 p. WILKIE, K. T. R.; MERTL, A. L.; TRANIELO, J. F. A. 2007. Biodiversity below
ground: probing the subterranean ant fauna of Amazonia. Naturwissenschaften. 94: 392–395.
WILSON, E. O. 2003. La hiperdiversidad como fenômeno real: el caso de Pheidole. p. 363 – 368. In: FERNÁNDEZ, F. (ed.). Introdución a las hormigas de la región Neotropical. 424 p.
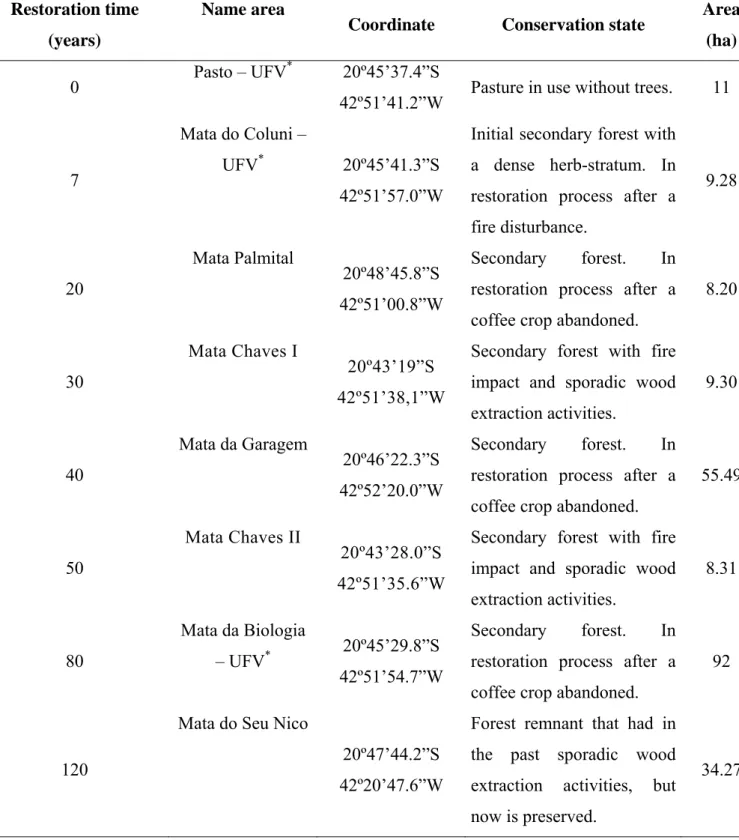
Table I. Description of habitats where ants were sampled in Viçosa, State of Minas Gerais, south-eastern Brazil.
Restoration time (years)
Name area
Coordinate Conservation state Area (ha)
0 Pasto – UFV
*
20º45’37.4”S
42º51’41.2”W Pasture in use without trees. 11
7
Mata do Coluni –
UFV* 20º45’41.3”S 42º51’57.0”W
Initial secondary forest with a dense herb-stratum. In restoration process after a fire disturbance. 9.28 20 Mata Palmital 20º48’45.8”S 42º51’00.8”W
Secondary forest. In restoration process after a coffee crop abandoned.
8.20
30
Mata Chaves I
20º43’19”S 42º51’38,1”W
Secondary forest with fire impact and sporadic wood extraction activities.
9.30
40
Mata da Garagem
20º46’22.3”S 42º52’20.0”W
Secondary forest. In restoration process after a coffee crop abandoned.
55.49
50
Mata Chaves II
20º43’28.0”S 42º51’35.6”W
Secondary forest with fire impact and sporadic wood extraction activities.
8.31
80
Mata da Biologia
– UFV* 20º45’29.8”S 42º51’54.7”W
Secondary forest. In restoration process after a coffee crop abandoned.
92
120
Mata do Seu Nico
20º47’44.2”S 42º20’47.6”W
Forest remnant that had in the past sporadic wood extraction activities, but now is preserved.
34.27
Table 2. Ants collected at one pasture (0 years) and seven forest remnants at distinct time regeneration (years) ranged from 7 to 120 years, in Viçosa, State of Minas Gerais, south-eastern Brazil. A = Arboreal microhabitat; E = Epigaeic
microhabitat; H = Hypogaeic microhabitat.
Taxa 0 7 20 30 40 50 80 120
Cerapachyinae
Acanthosticus laticornis Forel, 1908 H
Dolichoderinae
Dolichoderus lutosus Smith, 1858 A
Linepithema aztecoides Wild, 2007 E-H A-E-H H
Linepithema iniquum (Mayr 1870) E A E
Linepithema leucomelas (Emery, 1894) E
Ecitoninae
Labidus mars Forel, 1912 H A-H
Labidus praedator (Smith, 1858) E-H E-H
Ectatominae
Ectatomma edentatum Roger, 1863 E E E-H E-H E E-H
Ectatoma permagnum Forel, 1908 E E E
Gnamptogenys striatula Mayr, 1883 E E E E E E E
Formicinae
Brachymyrmex pr. longicornis Forel, 1907 E E H H
Table 2. (continued)
Taxa 0 7 20 30 40 50 80 120
Camponotus (Camponotus) agra (Smith, 1858) A-E E A-E A-E A A Camponotus (Myrmothrix) atriceps (Smith, 1858) A-E A A E A Camponotus (Myrmothrix) cingulatus Mayr, 1862 A-E A-E-H A-E
Camponotus (Myrmobrachys) crassus Mayr, 1862 E A-E
Camponotus (Tanaemyrmex) lespesii Forel, 1886 E
Camponotus (Tanaemyrmex) melanoticus Emery, 1894 E A-E A
Camponotus (Myrmaphaenus) novogranadensis Mayr, 1870 E H Camponotus (Myrmothrix) rufipes (Fabricius, 1775) E A-E E A-E A-E
Camponotus (Myrmepomis) sericeiventris (Guérin, 1838) A Heteroponerinae
Heteroponera mayri Kempf, 1962 E
Myrmicinae
Acromyrmex subterraneus (Forel, 1893) E
Acromyrmex niger (Smith, 1858) E
Apterostigma serratum Lattke, 1997 E E
Atta sexdens rubropilosa Forel, 1908 E E E-H E-H E
Carebara urichi (Wheeler, 1922) H H
Carebara gr. Lignata sp. H
Cephalotes atratus (Linnaeus, 1758) A
Cephalotes pusillus (Klug, 1824) A-E A
Table 2. (continued)
Taxa 0 7 20 30 40 50 80 120
Crematogaster longispina Mayr, 1870 A
Crematogaster torosa Mayr 1870 A
Cyphomyrmex transversus Emery, 1884 E
Hylomyrma balzani (Emery, 1894) E
Megalomyrmex goeldii Forel, 1912 E E E
Myrmicocrypta sp. A E
Mycetarotes parallelus (Emery, 1905) E
Mycocepurus smithii Forel, 1893 E
Octostruma simoni (Emery, 1890) E-H
Pheidole gertrudae Forel, 1886 A-E
Pheidole sp. A H E
Pheidole sp. B E E-H A-E
Pheidole sp. C E
Pheidole sp. D E-H A-E H A A-E E
Pheidole gr. Flavens sp. E E E E A-E E E
Pheidole sp. F A-E
Pheidole sp. G E
Pheidole sp. H E E E
Pheidole sp. J E E E A-E E E A-E-H
Table 2. (continued)
Taxa 0 7 20 30 40 50 80 120
Pheidole sp. N E E-H
Pyramica denticulata (Mayr, 1887) E
Rogeria micromma Kempf, 1961 E-H
Sericomyrmex sp. A E E E
Solenopsis saevissima H E-H
Solenopsis gr. Geminata sp. A E-H E
Solenopsis sp. B E A-H A-H E
Solenopsis sp. C E-H H H H E-H
Solenopsis sp. E H E E-H H
Solenopsis sp. F E A E E-H
Solenopsis sp. G E
Solenopsis sp. H E E-H H A A-E E-H
Solenopsis sp. M E A-E A-H E H E-H
Strumigenys elongata Roger, 1863 E
Trachymyrmex atlanticus Mayhé-Nunes & Brandão, 2007 E E E E Wasmannia auropunctata (Roger, 1863) A-E-H A-E E-H E-H E Ponerinae
Anochetus neglectus (Emery, 1894) E
Leptogenys sp. 1 E
Odontomachus chelifer (Latreille, 1802) E E E E
Table 2. (continued)
Taxa 0 7 20 30 40 50 80 120
Pachycondyla lenis (Kempf, 1962) A
Pachycondyla obscuricornis (Emery 1890) E
Pachycondyla striata Smith, 1858 E E E E E
Pachycondyla venusta Forel, 1912 E
Simopelta minima Brandão, 1989 E-H
Pseudomyrmecinae
0 2 4 6 8 10 12 14 16 18 20 22 24 26 28 30
0 20 40 60 80 100 120
Re storation time (ye ars)
A
n
t s
p
eci
es
ri
ch
n
e
ss
Arboreal microhabitat Epigaeic microhabitat Hypogaeic microhabitat
Figure 1. Ant species richness response at three distinct microhabitats to a successional gradient in Viçosa, State of Minas Gerais, south-eastern Brazil. p = 0.67.
Figure 3. Relationships between surrogates of resources and conditions and restoration time in Viçosa, State of Minas Gerais, south-eastern Brazil. (A) Average tree density (F1,6 = 12.74; p= 0.01; r2 = 0,67); (B) CV of vegetation cover (χ2 = 3.40; gl = 5; p < 0.01); (C) Average litter depth (F1,6 = 5.29; p = 0.06; r2 = 0.47); (D) Average vegetation cover (F1,6 = 5.21; p = 0.06; r2 = 0.46); (E) CV of vegetation cover (χ2 = 20.35; gl = 5; p = 0.06).
(A)
(D) (B)