Adaptive Statistical Iterative Reconstruction for
Low-Dose Chest CT Screening
Jiang-Hong Chen, Er-Hu Jin*, Wen He, Li-Qin Zhao
Department of Radiology, Beijing Friendship Hospital, Capital Medical University, XiCheng District, Beijing, China
Abstract
Objective:To reduce radiation dose while maintaining image quality in low-dose chest computed tomography (CT) by combining adaptive statistical iterative reconstruction (ASIR) and automatic tube current modulation (ATCM).
Methods:Patients undergoing cancer screening (n = 200) were subjected to 64-slice multidetector chest CT scanning with ASIR and ATCM. Patients were divided into groups 1, 2, 3, and 4 (n = 50 each), with a noise index (NI) of 15, 20, 30, and 40, respectively. Each image set was reconstructed with 4 ASIR levels (0% ASIR, 30% ASIR, 50% ASIR, and 80% ASIR) in each group. Two radiologists assessed subjective image noise, image artifacts, and visibility of the anatomical structures. Objective image noise and signal-to-noise ratio (SNR) were measured, and effective dose (ED) was recorded.
Results: Increased NI was associated with increased subjective and objective image noise results (P,0.001), and SNR decreased with increasing NI (P,0.001). These values improved with increased ASIR levels (P,0.001). Images from all 4 groups were clinically diagnosable. Images with NI = 30 and 50% ASIR had average subjective image noise scores and nearly average anatomical structure visibility scores, with a mean objective image noise of 23.42 HU. The EDs for groups 1, 2, 3 and 4 were 2.7961.17, 1.6960.59, 0.7460.29, and 0.3760.22 mSv, respectively. Compared to group 1 (NI = 15), the ED reductions were 39.43%, 73.48%, and 86.74% for groups 2, 3, and 4, respectively.
Conclusions:Using NI = 30 with 50% ASIR in the chest CT protocol, we obtained average or above-average image quality but a reduced ED.
Citation:Chen J-H, Jin E-H, He W, Zhao L-Q (2014) Combining Automatic Tube Current Modulation with Adaptive Statistical Iterative Reconstruction for Low-Dose Chest CT Screening. PLoS ONE 9(4): e92414. doi:10.1371/journal.pone.0092414
Editor:Rozemarijn Vliegenthart, University of Groningen, Netherlands
ReceivedSeptember 26, 2013;AcceptedFebruary 21, 2014;PublishedApril 1, 2014
Copyright:ß2014 Chen et al. This is an open-access article distributed under the terms of the Creative Commons Attribution License, which permits unrestricted use, distribution, and reproduction in any medium, provided the original author and source are credited.
Funding:The authors have no support or funding to report.
Competing Interests:The authors have declared that no competing interests exist.
* E-mail: [email protected]
Introduction
Lung cancer is the leading global cause of death due to malignancy, [1,2] and is usually diagnosed at an advanced stage with a subsequent poor prognosis. However, the 5-year recur-rence-free survival rate in patients with stage IA non-small cell lung cancer is as high as 80%, [3] emphasizing the importance of early detection. Low-dose computed tomography (CT) screening was associated with a 20% reduction in lung cancer mortality in the National Lung Cancer Screening Trial (NLST), [4,5] a large randomized control trial conducted in the United States. However, the radiation burden from CT screenings that need multiple CT exams may be of concern.[6–8] For example, in the NLST, three rounds of screening were performed at 1-year intervals, producing an average effective dose (ED) of around 1.5 m Sv every time, [9] with a cumulative radiation dose of 4.5 mSv. Radiologists, therefore, continuously optimize CT scan protocols to reduce dosage while maintaining diagnostic image quality, with manufacturers also improving hardware and software.
Methods to reduce radiation dose including reducing the tube current and peak voltage, as well as increasing gantry rotation and table speed, [10–13] but these methods produce higher image noise, leading to poor image quality. Automatic tube current modulation (ATCM) in CT can help achieve good image quality while reducing the overall radiation dose to patients. In one implementation of ATCM, the noise index (NI) is used to control the average image noise level for the study population. Higher NI reduces the radiation dose required but also increases objective image noise. Optimal NI selection makes it possible to achieve clinically acceptable images at the lowest radiation dose to patients. In addition, image noise can be reduced with advanced reconstruction algorithms, such as adaptive statistical iterative reconstruction (ASIR), which is widely used, or the newer model-based iterative reconstruction (MBIR) under the commercial name of Veo, a much more complex and advanced algorithm than ASIR. [14,15] Unfortunately, Veo is not commercially available in China.
[16,17] Many previous studies [18–23] focused on dose reduction by using iterative reconstruction, in contrast to FBP performed with a single combination of NI and ASIR percentage. Only one anthropomorphic phantom study testing optimal parameters for NI and ASIR percentage for low-dose chest CT screening. [24] In this study, we evaluated the image quality and radiation dose of low-dose chest CT images acquired at various NI settings and reconstructed with different ASIR levels.
Subjects and Methods
The institutional ethics committee of Beijing friendship hospital-affiliated capital medical university approved this study and a written informed consent was obtained from all subjects.
Patient Population
From April 15 to November 7, 2012, 200 participants were referred to our department for low-dose chest CT screening. They were separated into 4 groups of different NIs, with 50 patients in each group matched for sex, weight, and height. The study population consisted of 130 male and 70 female subjects (mean age, 52.66 years; range, 29–88 years). No participants had severe respiratory symptoms that interfered with their breath-hold CT scan process. They had ability to lie on their back with arms raised over the head. Patient height and weight were used to calculate body mass index (BMI).
Scanning Technique
All patients were scanned with a 64-slice, high-definition CT scanner (Discovery HD 750, General Electric Healthcare). The scan range covered the whole lung, from the level of the pulmonary apex to the liver dome. All patients were required to hold their breath during the examination. Image acquisition parameters included collimation, 6460.625 mm; slice thickness,
5 mm; pitch, 0.984; rotation time, 0.5 s; table speed, 78.75 mm/s; tube voltage, 100 kVp. Tube current modulation in the x, y, and z axes (Auto mA, GE Healthcare) was used, with a tube current range of 10–400 mA. The NI was set at 15 for group 1 as the standard protocol for a chest scan in our department. The NIs were set at 20, 30, and 40 for groups 2, 3, and 4, respectively. After each examination for the patients using NI = 40, images recon-structed with 30% ASIR were immediately reviewed by a radiologist on the operator console for image quality. If non-diagnostic images were obtained, a new study using NI = 30 was
subsequently performed. This fact was mentioned in the informed consent.
A set of mixed reconstruction images with different levels of ASIR and FBP were generated, namely, 0% ASIR, 30% ASIR, 50% ASIR and 80% ASIR, in which 0% ASIR means 0% ASIR blended with 100% FBP, 30% ASIR means 30% ASIR blended with 70% FBP, etc. Therefore, each acquisition set had 4 series of images with different ASIR levels.
Assessment of Image Quality
The four series of reconstructed images from each patient were transferred to a picture archiving and communication system (PACS) workstation (Unisight Version 4.2, DJ HealthUnion Systems Corp) for review. All patient and scanner demographic data were removed. Two radiologists, with 13 and 14 years of experience in assessing thoracic image quality, assessed all image data sets for image quality using mediastinal window (width, 400 HU; level, 40 HU) and lung window (width, 1,500 HU; level, –700 HU). To minimize bias in subjective image quality assessment, single reconstructed series were assessed randomly from different patients.
The lesions (emphysema, solid nodule, ground glass opacity nodule, patchy consolidation, patchy ground glass opacity, scarring and calcification, lesion of pleura, etc.) in the lung of each patient were assessed by two radiologists. Subjective visual lesion conspicuity was assessed on a five-point scale [22] (1, well-seen lesion with well-visualized margins; 2, well-well-seen lesion with poorly visualized margins; 3, subtle lesion; 4, probably an artifact mimicking a lesion; 5, definite artifact mimicking a lesion). Subjective image quality was assessed in terms of subjective image noise, artifacts, and visibility of anatomical structures. [22] Subjective image noise was evaluated in the mediastinal window and was graded on a 5-point scale (1, minimal image noise; 2, less than average image noise; 3, average image noise; 4, more than average image noise; 5, unacceptable image noise). Image artifacts were assessed in the lung window and were graded on a 4-point scale (1, no artifacts; 2, minor artifacts not interfering with diagnostic decision making; 3, major artifacts affecting visualiza-tion of major structures, diagnosis still possible; 4, obvious artifacts affecting diagnostic decision making). The visibility of anatomical structures, including the mediastinum, chest wall, and small structures (peripheral bronchovascular bundles located in the peripheral 2 cm of the lungs) was ranked on a 5-point scale (1, good visibility; 2, above average visibility; 3, average visibility; 4, suboptimal visibility; 5, unacceptable visibility). The mediastinum
Table 1.Patient characteristics and radiation dose.
Characteristics Group 1 Group 2 Group 3 Group 4 P-value
NI = 15 NI = 20 NI = 30 NI = 40
Age (y) 56.14614.64 53.53611.79 50.86611.76 50.12610.60 0.07
M/F 37/13 34/16 31/19 28/22 0.27
Height (cm) 1.6860.09 1.6860.06 1.6760.08 1.6760.07 0.86
Weight (kg) 69.06613.86 71.15610.17 70.26611.48 69.20612.02 0.89
BMI (kg/cm2) 24.28
63.55 24.9862.87 24.9462.47 24.8163.44 0.43
CTDIvol(mGy) 5.5162.21 3.3161.18 1.4960.53 0.7860.49 ,0.001
DLP (mGy˙cm) 193.59681.10 117.28640.64 51.29619.93 25.78615.12 ,0.001
ED (mSv) 2.7961.17 1.6960.59 0.7460.29 0.3760.22 ,0.001
and chest wall were reviewed in the mediastinal window, whereas the bronchovascular bundles were observed in the lung window.
A 190- to 210-mm2circular region of interest (ROI) was placed in the center of the descending thoracic aorta, without touching the lumen walls, at the level of the sixth thoracic vertebra in the mediastinal window. The mean value (Hounsfield unit [HU]) from the ROI was interpreted as the signal and the standard deviation (SD) as the objective image noise. The signal-to-noise ratio (SNR) was calculated with the mean value divided by SD. Objective image noise and SNR were used to assess objective image quality.
Estimation of Radiation Dose
The scanner calculates the volumetric CT dose index (CTDIvol)
and dose-length product (DLP) automatically. We converted the DLP to the ED in millisieverts (mSv) by multiplying it by the thoracic conversion factor of 0.0144 mSv mGy21cm21. [25].
Statistical Analysis
Data were analyzed using SPSS for Windows (version 17; Chicago, IL, USA). For quantitative data, the results are expressed as the mean 6 standard deviation (SD). One-way analysis of variance (ANOVA) was used to compare the age, sex, height, weight, BMI, CTDIvol, DLP, and ED among the 4 groups with
different NI values. Objective image noise and SNR were compared between the groups of NI = 30 and NI = 40 using
ANOVA with Bonferroni post-hoc comparisons. The chi-squared test was used to compare the subjective image noise in all groups, the visibility of anatomical structures in the 4 groups with different NI values, but independent of ASIR, and the other 4 groups with different ASIR values, but independent of NI. Chi-squared tests were performed on both the CT findings with different NI values and the detected numbers of lesions with different ASIR levels. A
P-value of less than 0.05 indicates a statistically significant difference. Interobserver agreements were calculated using Cohen’s weighted Kappa statistics.
Results
Study Population and Radiation Dose
Imaging was performed on 200 patients. Each patient was scanned once, including the patients using NI = 40. Patient characteristics and radiation dose are shown in Table 1. No significant difference was found with respect to age, sex, height, weight, or BMI among the 4 groups. CTDIvol, DLP, and ED were
significantly different in the four groups with different NI values. Compared to group 1, the mean values of CTDIvolreduction were
39.93%, 72.96%, and 85.84%, and the percentages of ED reduction were 39.43%, 73.48%, and 86.74% in groups 2, 3, and 4, respectively.
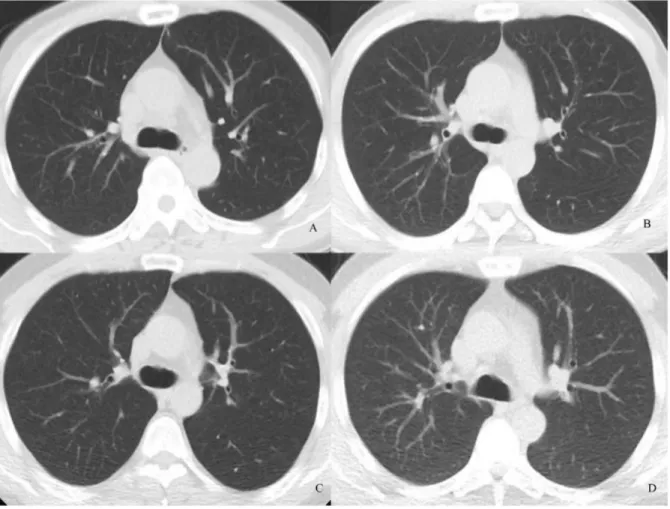
Figure 1. Transverse chest CT images of 4 patients who were almost the same height and weight.Images were reconstructed with 30% ASIR. Images are (A) NI = 15, objective image noise 10.95; (B) NI = 20, objective image noise 18.28, (C) NI = 30, objective image noise 28.5, and (D) NI = 40, objective image noise 41.52. The visibility of the small structure (arrow) in D was around average.
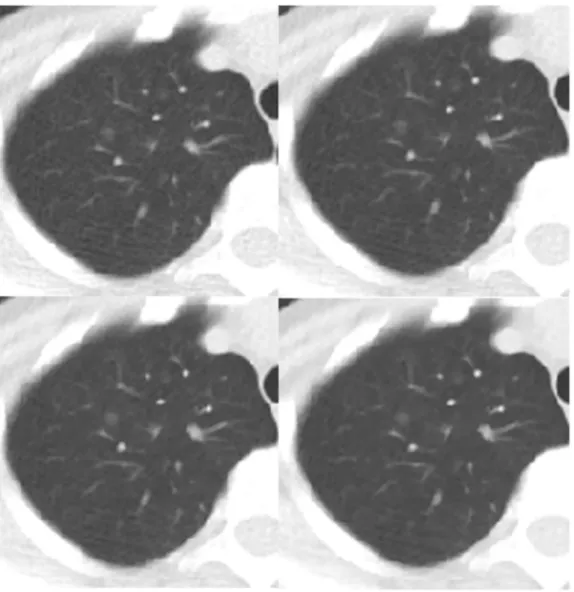
Figure 2. Transverse chest CT images of a patient who had a ground glass opacity nodule in the right upper lobe (arrow).Images are all NI = 30 and (A) 0% ASIR, objective image noise 32.37 HU; (B) 30% ASIR, objective image noise 25.90 HU, (C) 50% ASIR, objective image noise 22.15 HU, and (D) 80% ASIR, objective image noise 16.66 HU. The visibility of the small structure in D was higher than in A, and the margin of the lesion in D was clearer than in A.
doi:10.1371/journal.pone.0092414.g002
Table 2.CT findings in groups with different NI values (n = 50 each).
CT finding Group 1 Group 2 Group 3 Group 4 P-value
NI = 15 NI = 20 NI = 30 NI = 40
Normal 11 11 10 12 0.99
Emphysema 8 10 8 7 0.91
Solid nodule 19 19 21 18 0.96
Ground glass opacity nodule 5 3 5 5 0.88
Patchy consolidation 3 6 1 2 0.24
Patchy ground glass opacity 5 6 8 6 0.88
Scarring and calcification 24 21 23 23 0.96
Lesion of pleura 7 6 2 5 0.45
Other 2 2 2 3 1.00
Assessment of Image Quality
Table 2 summarizes the number of pulmonary lesions identified at different NI settings, which were not significantly different from each other. Subjective visual lesion conspicuity was graded as 2 for 6 ground-glass opacity lesions at NI = 40 with 0% ASIR or 30% ASIR and 1 ground-glass opacity lesion at NI = 30 with 0% ASIR. Other lesions were graded as 1 out of 4 ASIR levels in each patient. Despite the grading differences mentioned above, the detected number of all lesions was not affected by different ASIR levels, as shown in Table 3. The subjective assessment scores of image quality of the pulmonary, mediastinal, and chest wall structures for the 4 groups are shown in Table 4. Increasing NI increased the subjective and objective image noise scores (P,
0.001) (Fig. 1), as did decreased levels of ASIR (P,0.001) (Fig. 2). In contrast, SNR decreased with increasing NI (P,0.001), but increased with increasing ASIR (P,0.001) (Table 4).
The subjective image noise scores were average in three subgroups (NI = 30 with 30% ASIR and 50% ASIR, NI = 40 with 80% ASIR), with objective image noise values ranging from 23.42 to 27.51 HU. Objective image noise scores in the NI = 30 and NI = 40 groups with different ASIR levels were similar, including: NI = 30 with 0% ASIR and NI = 40 with 50% ASIR (P= 0.42), NI = 30 with 50% ASIR and NI = 40 with 80% ASIR (P= 1.00), with no significant differences in SNR between these subgroups (Table 4). Subjective noise scores of the subgroups of NI = 30 with 0% ASIR and NI = 40 with 50% ASIR were higher than average. Mild pixilation artifacts were seen in subgroups with
Table 3.Number of detected lesions at different ASIR levels.
Lesion 0% ASIR 30% ASIR 50% ASIR 80% ASIR P-value
Emphysema 33 33 33 33 1.00
Solid nodule 77 77 77 77 1.00
Ground glass opacity nodule 18 18 18 18 1.00
Patchy consolidation 12 12 12 12 1.00
Patchy ground glass opacity 25 25 25 25 1.00
Scarring and calcification 91 91 91 91 1.00
Lesion of pleura 20 20 20 20 1.00
Other 9 9 9 9 1.00
Note: Data are shown as numbers of lesions in 200 participants at different ASIR levels. doi:10.1371/journal.pone.0092414.t003
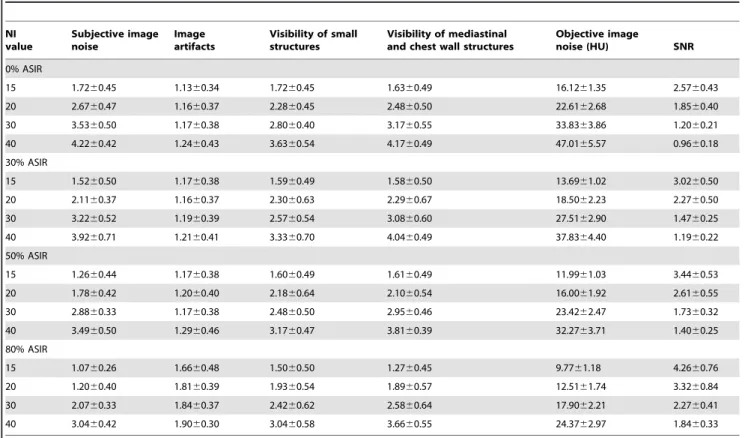
Table 4.Image quality assessment for chest CT images at 4 NIs with different ASIR levels.
NI value
Subjective image noise
Image artifacts
Visibility of small structures
Visibility of mediastinal and chest wall structures
Objective image
noise (HU) SNR
0% ASIR
15 1.7260.45 1.1360.34 1.7260.45 1.6360.49 16.1261.35 2.5760.43
20 2.6760.47 1.1660.37 2.2860.45 2.4860.50 22.6162.68 1.8560.40
30 3.5360.50 1.1760.38 2.8060.40 3.1760.55 33.8363.86 1.2060.21
40 4.2260.42 1.2460.43 3.6360.54 4.1760.49 47.0165.57 0.9660.18
30% ASIR
15 1.5260.50 1.1760.38 1.5960.49 1.5860.50 13.6961.02 3.0260.50
20 2.1160.37 1.1660.37 2.3060.63 2.2960.67 18.5062.23 2.2760.50
30 3.2260.52 1.1960.39 2.5760.54 3.0860.60 27.5162.90 1.4760.25
40 3.9260.71 1.2160.41 3.3360.70 4.0460.49 37.8364.40 1.1960.22
50% ASIR
15 1.2660.44 1.1760.38 1.6060.49 1.6160.49 11.9961.03 3.4460.53
20 1.7860.42 1.2060.40 2.1860.64 2.1060.54 16.0061.92 2.6160.55
30 2.8860.33 1.1760.38 2.4860.50 2.9560.46 23.4262.47 1.7360.32
40 3.4960.50 1.2960.46 3.1760.47 3.8160.39 32.2763.71 1.4060.25
80% ASIR
15 1.0760.26 1.6660.48 1.5060.50 1.2760.45 9.7761.18 4.2660.76
20 1.2060.40 1.8160.39 1.9360.54 1.8960.57 12.5161.74 3.3260.84
30 2.0760.33 1.8460.37 2.4260.62 2.5860.64 17.9062.21 2.2760.41
40 3.0460.42 1.9060.30 3.0460.58 3.6660.55 24.3762.97 1.8460.33
80% ASIR regardless of the NI, but the artifacts did not interfere with diagnostic information. The 0% ASIR, 30% ASIR, and 50% ASIR groups had better image artifact scores than subgroups with 80% ASIR.
Both readers assessed anatomical structure visibility to be better than average or around average, except for the group of NI = 40, which had suboptimal scores for mediastinal and chest wall structures. The visibility for these anatomical structures improved with decreased NI (P,0.001). Visibility scores for these anatomical structures also improved with increased ASIR level, but did not vary significantly between 0% ASIR and 30% ASIR or 30% ASIR and 50% ASIR for both small and mediastinal and chest wall structures, or between 50% ASIR and 80% ASIR for only small structures. The interobserver agreements (kappa value) for image subjective noise, artifacts, visibility of small structures, visibility of mediastinal and chest wall structures of each subgroup were 0.616–0.802, 0.558–0.778, 0.406–0.606, and 0.472–0.700, respec-tively.
Discussion
In this study, we analyzed the impact of NI and ASIR on image quality for low-dose chest CT screening. We could obtain quality images using an NI with ASIR algorithm and were able to reduce radiation doses to the sub-millisievert level.
Radiologists seek to reduce the radiation dose in CT screening, either by affecting the radiation dose directly via changing tube current, tube voltage, section thickness, scan length, NI, etc., or indirectly by using reconstruction algorithms. [26] Unfortunately, reducing the radiation dose will inevitably increase image noise and affect image quality. The conventional CT image reconstruc-tion algorithm, FBP, reflects a trade-off between sharpness and image noise that limits the reduction of the radiation dose to maintain the diagnostic image quality. [27] ASIR is a newer image reconstruction algorithm that reduces image noise by applying iterations between the raw data and image space, generating images of higher quality and greater structural detail at lower radiation doses than FBP, [28] helping to improve image quality and reduce radiation dose.[17,22,23,29–32] Iterative reconstruc-tion algorithms could effectively reduce radiareconstruc-tion doses for chest CT: one study showed a 27% radiation dose reduction using 30% ASIR [23], and another reported that higher ASIR levels (100%) could reduce radiation doses even further (76%). [33] ATCM is another method that we used to minimize radiation dose. Several studies indicated that CT dose indices could be reduced by 40– 60% using ATCM without compromising image quality, [27,34] and we could further reduce CT doses to sub-millisievert levels by using ATCM with ASIR.
To our knowledge, this is the first clinical study to evaluate the effects of different levels of ASIR on dose reduction in sub-millisievert low-dose chest CT screening by using ATCM for different NI settings. We were able to decrease the mean ED to 0.74 mSv at an NI of 30, and to produce minimal image artifacts, average subjective image noise, and nearly average anatomical structure visibility at NI = 30 with 50% ASIR. At these settings, the mean objective image noise was 23.42 HU, which is comparable to the result acquired at 40 mAs using 30% ASIR.
[22] Similar subjective and objective image noise results were obtained by using NI = 40 with 80% ASIR or NI = 30 with 50% ASIR. The NI = 40 setting reduced the mean ED to 0.37 mSv, but produced suboptimal visibility of the mediastinal and chest wall structures, even though small structure visibility was sufficient, probably due to the high contrast of the small structures with air. The 80% ASIR produced more artifacts, regardless of NI, so we chose NI = 30 with 50% ASIR as the optimal settings for low-dose chest CT screening. The mean ED obtained using this setting was comparable with that from other studies. For example, one study reported a mean ED of 0.7 mSv for low-dose chest CT using iDose4 (an iterative reconstruction technique from Philips), [35] and another study reported a mean ED of 0.5 mSv for low-dose chest CT using SAFIRE (an iterative reconstruction technique from Siemens). [36] These are lower than the dose used in the NLST (1.5 mSv) and much lower than the dose used in standard chest CT (4–11 mSv). [14,15,29,30].
The subjective and objective image noise and SNR significantly improved with increased ASIR; however, the visibility for the anatomical structures did not significantly improve between some adjacent ASIR levels, especially for the small structures, perhaps because image noise might not significantly impact the visibility of small structures that have high contrast with air. Similarly, the high contrast between air and lung lesions allowed for perfect lesion detection at all ASIR levels, as reported previously. [22] However, because of relatively the low contrast between ground glass opacity lesions and air, some lesions were observed with poorly visualized margins at lower doses with lower ASIR levels. The effects of lower radiation dose with different ASIR levels on such relatively low contrast lesions needs further evaluation with larger number of patients.
There are several limitations in our study. First, patient scans in the 4 groups were not acquired consecutively. However, there were no differences in patient characteristics (height, weight, BMI, age, and sex distribution) in the 4 groups. Second, the results only apply to this CT equipment because ASIR is vendor-specific. Third, ASIR is only the first generation of iterative reconstruction (IR); MBIR/Veo is an advanced algorithm that can reduce radiation dose more efficiently. [14,15] However, MBIR/Veo is not currently available in our department. Fourth, we did not specify NI according to body size, which may further reduce radiation dose. [37].
Conclusions
Combining ATCM with ASIR can effectively reduce radiation dose. A low-dose chest CT screening protocol of NI = 30 with 50% ASIR reduced the ED to 0.74 mSv while maintaining reasonable image quality.
Acknowledgments
The authors thank Dr. Jianying Li for providing language help.
Author Contributions
Wrote the paper: JC. Designed the research: EJ. Performed the data collection and processing: JC LZ. Revised the manuscript: JC WH EJ.
References
1. Ferlay J, Shin H, Bray F, Forman D, Mathers C, et al (2010) Estimates of worldwide burden of cancer in 2008: GLOBOCAN 2008. Int J Cancer 127: 2893–917.
2. Jemal A, Bray F, Center MM, Ferlay J, Ward E, et al (2011) Global cancer statistics. CA Cancer J Clin 61: 69–90.
4. National Lung Screening Trial Research Team, Church TR, Black WC, Aberle DR, Berg CD, et al (2013) Results of initial low-dose computed tomographic screening for lung cancer. N Engl J Med 368: 1980–91.
5. National Lung Screening Trial Research Team, Aberle DR, Adams AM, Berg CD, Black WC, et al (2011) National Lung Screening Trial Research Team. Reduced lung-cancer mortality with low-dose computed tomo graphic screening. N Engl J Med 365: 395–409.
6. Lee CI, Haims AH, Monico EP, Brink JA, Forman HP (2004) Diagnostic CT scans: assessment of patient, physician, and radiologist awareness of radiation dose and possible risks. Radiology 231: 393–8.
7. Hall EJ, Brenner DJ (2008) Cancer risks from diagnostic radiology. Br J Radiol 81: 362–78.
8. Brenner DJ, Hall EJ (2007) Computed tomography–an increasing source of radiation exposure. N Engl J Med 357: 2277–84.
9. National Lung Screening Trial Research Team, Aberle DR, Berg CD, Black WC, Church TR, et al (2011) The National Lung Screening Trial: overview and study design. Radiology 258: 243–53.
10. Kalra MK, Maher MM, Toth TL, Hamberg LM, Blake MA, et al (2004) Strategies for CT radiation dose optimization. Radiology 230: 619–28. 11. Heyer CM, Mohr PS, Lemburg SP, Peters SA, Nicolas V. (2007) Image quality
and radiation exposure at pulmonary CT angiography with 100- or 120-kVp protocol: prospective randomized study. Radiology 245: 577–83.
12. Marin D, Nelson RC, Schindera ST, Richard S, Youngblood RS, et al (2010) Low-tube-voltage, high-tube-current multidetector abdominal CT: improved image quality and decreased radiation dose with adaptive statistical iterative reconstruction algorithm – initial clinical experience. Radiology 254: 145–53. 13. Uppot RN, Sahani DV, Hahn PF, Kalra MK, Saini SS, et al (2006) Effect of
obesity on image quality: fifteen-year longitudinal study for evaluation of dictated radiology reports. Radiology 240: 435–9.
14. Katsura M, Matsuda I, Akahane M, Yasaka K, Hanaoka S, et al (2013) Model-based iterative reconstruction technique for ultralow-dose chest CT: comparison of pulmonary nodule detectability with the adaptive statistical iterative reconstruction technique. Invest Radiol 48: 206–12.
15. Neroladaki A, Botsikas D, Boudabbous S, Becker CD, Montet X (2013) Computed tomography of the chest with model-based iterative reconstruction using a radiation exposure similar to chest X-ray examination: preliminary observations. Eur Radiol 23: 360–6.
16. Ghetti C, Ortenzia O, Serreli G (2012) CT iterative reconstruction in image space: a phantom study. Phys Med 28: 161–5.
17. Hara AK, Paden RG, Silva AC, Kujak JL, Lawder HJ, et al (2009) Iterative reconstruction technique for reducing body radiation dose at CT: feasibility study. AJR Am J Roentgenol 193: 764–71.
18. Sagara Y, Hara AK, Pavlicek W, Silva AC, Paden RG, et al (2010) Abdominal CT comparison of low-dose CT with adaptive statistical iterative reconstruction and routine-dose CT with filtered back projection in 53 patients. AMJ Am J Rotentgenol 195: 713–9.
19. May MS, Wu¨st W, Brand M, Stahl C, Allmendinger T, et al (2011) Dose reduction in abdominal computed tomography: intraindividual comparison of image quality of full-dose standard and half-dose iterative reconstructions with dual-source computed tomography. Invest Radiol 46: 465–70.
20. Hu XH, Ding XF, Wu RZ, Zhang MM (2011) Radiation dose of non-enhanced chest CT can be reduced 40% by using iterative reconstruction in image space. Clin Radiol 66: 1023–9.
21. Mitsumori LM, Shuman WP, Busey JM, Kolokythas O, Koprowicz KM. (2012) Adaptive statistical iterative reconstruction versus filtered back projection in the
same patient: 64 channel liver CT image quality and patient radiation dose. Eur Radiol 22: 138–43.
22. Singh S, Kalra MK, Gilman MD, Hsieh J, Pien HH, et al (2011) Adaptive statistical iterative reconstruction technique for radiation dose reduction in chest CT: A pilot study. Radiology 259: 565–73.
23. Leipsic J, Nguyen G, Brown J, Sin D, Mayo JR (2010) A prospective evaluation of dose reduction and image quality in chest CT using adaptive statistical iterative reconstruction. AJR Am J Roentgenol 195: 1095–9.
24. Rampado O, Bossi L, Garabello D, Davini O, Ropolo R (2012) Characteriza-tion of a computed tomography iterative reconstrucCharacteriza-tion algorithm by image quality evaluations with an anthropomorphic phantom. Eur J Radiol 81: 3172– 7.
25. Deak PD, Smal Y, Kalender WA (2010) Multisection CT protocols: sex- and age-specific conversion factors used to determine effective dose from dose-length product. Radiology 257: 158–66.
26. Kubo T, Lin PJ, Stiller W, Takahashi M, Kauczor HU, et al (2008) Radiation dose reduction in chest CT: a review. AJR Am J Roentgenol 190: 335–43. 27. McCollough CH, Bruesewitz MR, Kofler JM Jr (2006) CT dose reduction and
dose management tools: overview of available options. Radiographics 26: 503– 12.
28. Desai GS, Uppot RN, Yu EW, Kambadakone AR, Sahani DV (2012) Impact of iterative reconstruction on image quality and radiation dose in multidetector CT of large body size adults. Eur Radiol 22: 1631–40.
29. Prakash P, Kalra MK, Ackman JB, Digumarthy SR, Hsieh J, et al (2010) Diffuse lung disease: CT of the chest with adaptive statistical iterative reconstruction technique. Radiology 256: 261–9.
30. Prakash P, Kalra MK, Digumarthy SR, Hsieh J, Pien H (2010) Radiation dose reduction with chest computed tomography using adaptive statistical iterative reconstruction technique: initial experience. J Comput Assist Tomogr 34: 40–5. 31. Pontana F, Pagniez J, Flohr T, Faivre JB, Duhamel A, et al (2012) Chest computed tomography using iterative reconstruction vs filtered back projection (part 1): evaluation of image noise reduction in 32 patients. Eur Radiol 21: 627– 35.
32. Pontana F, Duhamel A, Pagniez J, Flohr T, Faivre JB, et al (2011) Chest computed tomography using iterative reconstruction vs filtered back projection (part 2): image quality of low-dose CT examinations in 80 patients. Eur Radiol 21: 636–43.
33. Yanagawa M, Honda O, Kikuyama A, Gyobu T, Sumikawa H, Koyama M, et al (2012) Pulmonary nodules: effect of adaptive statistical iterative reconstruction (ASIR) technique on performance of a computer-aided detection (CAD) system-comparison of performance between different-dose CT scans. Eur J Radiol 81: 2877–86.
34. Kalra MK, Maher MM, Toth TL, Kamath RS, Halpern EF, et al (2004) Radiation from ‘‘extra’’ images acquired with abdominal and/or pelvic CT: effect of automatic tube current modulation. Radiology 232: 409–14. 35. Lee Y, Jin KN, Lee NK. (2012) Low-dose computed tomography of the chest
using iterative reconstruction versus filtered back projection: comparison of image quality. J Comput Assist Tomogr 36: 512–7.
36. Baumueller S, Winklehner A, Karlo C, Goetti R, Flohr T, et al (2012) Low-dose CT of the lung: potential value of iterative reconstructions. Eur Radiol 22: 2597– 606.