Human Gut Microbiota
Emily R. Davenport1¤a, Darren A. Cusanovich1¤b, Katelyn Michelini1, Luis B. Barreiro2,
Carole Ober1*, Yoav Gilad1*
1Department of Human Genetics, University of Chicago, Chicago, IL, United States of America,
2Department of Pediatrics, Saint Justine Hospital Research Centre, Montreal, Canada
¤a Current address: Department of Molecular Biology and Genetics, Cornell University, Ithaca, NY, United States of America
¤b Current address: Department of Genome Sciences, University of Washington, Seattle, WA, United States of America
*[email protected](CO);[email protected](YG)
Abstract
The bacterial composition of the human fecal microbiome is influenced by many lifestyle factors, notably diet. It is less clear, however, what role host genetics plays in dictating the composition of bacteria living in the gut. In this study, we examined the association of ~200K host genotypes with the relative abundance of fecal bacterial taxa in a founder popu-lation, the Hutterites, during two seasons (n = 91 summer, n = 93 winter, n = 57 individuals collected in both). These individuals live and eat communally, minimizing variation due to environmental exposures, including diet, which could potentially mask small genetic effects. Using a GWAS approach that takes into account the relatedness between subjects, we identified at least 8 bacterial taxa whose abundances were associated with single nucleo-tide polymorphisms in the host genome in each season (at genome-wide FDR of 20%). For example, we identified an association between a taxon known to affect obesity (genus Akkermansia) and a variant nearPLD1, a gene previously associated with body mass index. Moreover, we replicate a previously reported association from a quantitative trait locus (QTL) mapping study of fecal microbiome abundance in mice (genusLactococcus, rs3747113,P= 3.13 x 10⁻⁷). Finally, based on the significance distribution of the associated
microbiome QTLs in our study with respect to chromatin accessibility profiles, we identified tissues in which host genetic variation may be acting to influence bacterial abundance in the gut.
Introduction
Humans have complex interactions with the bacteria that live in and on their bodies, referred to as the microbiota[1]. Alterations in the microbiota, particularly in the gut, have been linked to variation in risk for obesity[2–4], celiac disease[5], Crohn’s disease[6,7], ulcerative colitis[8–
11], gastroenteritis[12], asthma[13], and inflammatory bowel disease[14,15]. Therefore, understanding the factors that determine and maintain gut microbiome composition has the
OPEN ACCESS
Citation:Davenport ER, Cusanovich DA, Michelini K, Barreiro LB, Ober C, Gilad Y (2015) Genome-Wide Association Studies of the Human Gut Microbiota. PLoS ONE 10(11): e0140301. doi:10.1371/journal. pone.0140301
Editor:Bryan A White, University of Illinois, UNITED STATES
Received:July 8, 2015
Accepted:September 5, 2015
Published:November 3, 2015
Copyright:© 2015 Davenport et al. This is an open access article distributed under the terms of the Creative Commons Attribution License, which permits unrestricted use, distribution, and reproduction in any medium, provided the original author and source are credited.
Data Availability Statement:The data for the 16S rRNA amplicon sequencing, genotypes, GWAS results, and metadata have been deposited in dbGaP under accession numbers phs000680 and phs000185.
potential to unlock therapies to improve human health. Several environmental factors have been shown to play a role in determining gut microbiome composition such as the method of delivery at birth[16], formula vs. breast feeding as an infant[17], and diet[18–21]. One major factor that has yet to be examined in detail is the role of host genetics.
Several groups have investigated the heritability of the gut microbiome in humans and model organisms; however, estimates of genetic contribution to bacterial abundance vary between studies. One early study used temperature gradient gel electrophoresis (TGGE) to examine the similarity of the bacterial 16S rRNA genes from gut bacteria between individuals with varying degrees of relatedness. Their findings showed TGGE profiles were increasingly similar as the relatedness between pairs of individuals also increased[22]. Although this is con-sistent with a heritable component to the microbiome, genetic effects are confounded by simi-larity in environment, as related individuals likely shared environments throughout their lives to a greater extent than unrelated individuals. Another study estimated microbiome heritability using 16S rRNA gene sequencing in twin pairs and parent-offspring trios by examining related-ness using a pairwise distance measurement of microbial composition[3]. Although micro-biome composition was more similar between twins than between parent-offspring pairs or unrelated individuals, the microbiome of monozygotic twins was not more similar than that of dizygotic twins, arguing against a strong genetic component to microbiome composition. This study was, however, small (~20–30 twin pairs in each category) and only examined broad mea-sures of the microbiome composition rather than individual bacterial abundances. More recently, a study on the heritability of common gut bacteria in>400 twin pairs suggested host
genetics plays a role in determining gut microbiome composition in humans, with some bacte-rial taxa having heritability estimates as high as 0.39[23].
While evidence for host genetics influencing the gut microbiota is gaining traction, we still lack an understanding of what genes or genetic variants in the human genome might poten-tially influence bacterial profiles. Many studies have focused on candidate genes, where either natural variation segregating in humans[24–26] or gene knockout models in mice[27–29] were associated with differences in the microbiome. However, only one study to date has performed a genome-wide scan for variants associated with bacterial abundance in the gut: Bensonet al. [30]identified 18 quantitative trait loci (QTL) associated with various bacterial taxa in the gut using advanced intercrossed mouse lines. This study demonstrates the utility of genome-wide approaches, however, no such study has been reported in humans.
To address this gap, we examined the fecal microbiome from the Hutterites, a religious iso-late living in North America. Importantly, members of this population live and eat on large communal farms, called colonies, limiting inter-individual variation in environmental expo-sures that might mask genetic effects on microbiome composition. In particular, meals are pre-pared and eaten in a communal kitchen and dining room, respectively. Previous work in this population examined temporal differences between winter and summer gut microbiomes[18]. Here, we examined the same individuals for sex, age, and genetic effects on microbiome com-position using both the winter data (n = 93) and summer data (n = 91), separately. In addition, we considered a composite microbiome (“seasons combined”), where the relative abundances of bacterial taxa sampled in winter and summer are averaged for any individual where stool was available from both seasons (n = 127; seeMaterials and Methods). While the abundance of only one bacterial taxa correlated with age (genusBifidobacterium), at least four bacterial taxa in each season were differentially abundant by sex. In addition, we identified at least eight bac-terial taxa in each season that are associated with at least one single nucleotide polymorphism (SNP) at a genome-wide significance level. Finally, we identified pathways and candidate tis-sues where host genetic variation may be acting to influence bacterial abundance in the gut. data collection and analysis, decision to publish, or
preparation of the manuscript.
Materials and Methods
Ethics statement
The protocol was approved by the University of Chicago IRB (protocol 10-416-B). Written informed consent was obtained from all adult participants and the parents of minors. In addi-tion, written assent was obtained from minor participants.
Accession Numbers
The data for the 16S rRNA amplicon sequencing, genotypes, GWAS results, and metadata have been deposited in dbGaP under accession numbers phs000680 and phs000185.
Microbial data collection
Stool collection, DNA extraction, 16S rRNA gene sequencing, and classification were per-formed as described previously[18]. Briefly, stool samples were collected during two seasons (winter and the following summer). Sequences were classified using a Naïve-Bayesian classifier as implemented in mothur[31]. In our previous study of seasonal differences in microbiome composition, individuals were excluded if they took antibiotics within 6 months of either the summer or winter sampling date. For this study, in which seasons were considered individu-ally, samples were excluded if the individual had taken antibiotics within the previous 6 months the sampling date for each within season analysis. Additional samples were excluded for indi-viduals without genotyping data. After exclusions, samples for 93 indiindi-viduals in winter (60 females and 33 males), 91 individuals in summer (57 females and 34 males), and 127 individu-als in the combined sample (79 females and 48 males) remained. For all analyses, sequencing reads were randomly subsampled to a maximum depth of 2 million reads per technical repli-cate and technical replirepli-cates were combined, resulting in approximately 4 million reads per individual per season. Taxon abundances were standardized to the total number of reads sub-sampled to generate relative abundance measures.
Genotype data
Genotyping in 1415 Hutterite individuals (including the 127 individuals considered in this study) was performed using either the Affymetrix 500k Array Set, the Genome-Wide Human SNP Array 5.0, or the Genome-Wide Human SNP Array 6.0 as part of a long-term research program studying the genetic basis of complex phenotypes in the Hutterites[32–35]. Genotypes for the Affymetrix 500k array set were called using BRLMM (http://media.affymetrix.com/ support/technical/whitepapers/brlmm_whitepaper.pdf) and genotypes for the Genome-Wide Human SNP Array 5.0 and 6.0 were called using Birdseed[36]. SNPs were initially quality fil-tered using the following criteria across 1415 individuals: minor allele frequency5%, call rates95%, Hardy-Weinberg equilibriumP-values0.001, and fewer than 5 Mendelian errors across all individuals. 271,365 SNPs that were on all three platforms remained after qual-ity control filtering and re-annotation to the human genome version 19 (hg19, dbSNP135).
Bacterial data pre-processing
standard normal distribution across individuals by quantile normalization using the R function qqnorm[37]. Finally, to limit the burden of multiple testing, we removed any taxon that was highly correlated (Pearson correlation0.9) with either a taxon at a lower taxonomic level (the taxon at the higher level was removed) or at the same level (the taxon listed first alphabeti-cally was removed). The pairs of highly correlated bacterial taxa are shown inS1 Table. The final dataset for winter consisted of 116 bacterial taxa: 3 phyla, 3 classes, 8 orders, 22 families, and 80 genera. The final dataset for summer consisted of 104 bacterial taxa: 3 phyla, 3 classes, 8 orders, 19 families, and 71 genera.
Combining seasons, with normalization. Our previous work revealed broad, temporal differences in gut bacterial abundance between winter and summer in this population[18]. However, having the largest possible sample increases power in genetic association studies, which is critical given the number of tests performed. To this end, we normalized bacterial taxon abundance in each season separately before combining data from the two seasons and included only common taxa that had at least one read in 75% of individuals in both seasons (7 phyla, 15 classes, 21 orders, 38 families, and 70 genera). Specifically, within each season, taxon data was fit to a standard normal distribution across individuals by quantile normalization using the R function qqnorm[37]. Normalized bacterial taxon abundances were then averaged for any individuals who were sampled in both seasons. To further limit the burden of multiple testing, we removed bacterial taxa that were highly correlated, as described above. The final dataset consisted of 102 bacterial taxa: 3 phyla, 3 classes, 7 orders, 19 families, and 70 genera. To ensure that seasonal effects were accounted for, principal component analysis was per-formed on all genera level classifications in the final, normalized data set using prcomp in R; season was not correlated with any of the top 10 principal components in this final dataset (S1 Fig). We refer to this dataset as the“seasons combined”from hereon in.
Bacterial correlations with age and sex
Correlations of individual bacterial taxa to age and sex were performed using linear mixed models that corrected for the relatedness between individuals, as implemented in GEMMA (v0.94)[38]. First, relevant covariates were regressed out of normalized bacterial abundances (sex and colony/date of collection for examining taxa correlations with age; and age and col-ony/date of collection for examining taxa correlations with sex). Samples were collected from five colonies on separate days; therefore, colony and date of collection are confounded. With this understanding, we refer to‘date of collection’rather than‘colony/date of collection’
throughout the manuscript. Linear models were run using GEMMA specifying the–notsnp option. Relatedness matrices were calculated using identity by descent from genotype data[39]. Significance was assessed using a likelihood ratio test and multiple testing corrections were done using q-values (S5andS6Tables)[40].
Diversity metrics
All bacterial taxa present at the genus level in each sample were used to calculate alpha diversity metrics (richness, Shannon diversity, and evenness), without quantile normalization applied to relative abundances and no taxa eliminated due to rarity. Diversity metrics were calculated using the vegan package in R[41].
Chip heritability of gut bacteria
Table) was calculated for the residuals of each taxon using GEMMA v0.94[38]. PVE is consid-ered non-zero if the standard error measurements do not intersect zero.
Bacterial associations to host genetic variation
Prior to association testing, age, sex and date of collection were regressed from normalized bac-terial taxon relative abundance data. GEMMA (v0.94) was used to perform GWAS on the residuals, including the relatedness matrices as described above to account for inter-individual relatedness. SNPs were eliminated if their minor allele frequency was lower than 10% in the individuals tested. A total of 211,319 SNPs in the winter analysis, 210,924 SNPs in the summer analysis, and 212,153 SNPs in the“seasons combined”analysis were examined. Both a conser-vative Bonferroni correctedP-value threshold and less conservative q-value thresholds (0.2 and 0.1) were considered to correct for multiple testing within each genome-wide association study [40].
The number of bacterial taxa within each season that had both non-zero“chip heritability”
and at least one genome-wide significant association were examined. To determine the signifi-cance of this overlap within each season,“chip heritability”estimates were permuted across bacterial taxa and the overlap of taxa that had both non-zero permuted“chip heritability”and at least one genome-wide significant SNP association was calculated, generating a null distribu-tion of the number of overlaps expected by chance. An empiricalP-value was calculated by dividing the number of overlaps equal to or greater than the observed number of overlaps for that season by the number of permutations (10,000) in the null distribution.
Functional annotation enrichment
It is unclear in what tissues genetic variation might be acting in the human body to influence bacterial abundance in the gut. To investigate this, for each bacterial taxon that either had a genome-wide significant association through GWAS or non-zero“chip heritability”, we exam-ined the enrichment of GWAS SNPs in DNase hypersensitivity (DHS) peaks for 16 tissues. In the human genome, DHS peaks mark areas of accessible chromatin, which is assumed to typi-cally participate in gene regulatory functions. Many of these accessible regulatory regions of the human genome are cell-type or temporally specific[42]. Therefore, candidate cell-types where genetic variation may be acting to influence an ultimate phenotype can be determined by examining the enrichment of strongly associated GWAS SNPs in open chromatin across tis-sues. Mauranoet al.[43] demonstrated the utility of this approach, identifying immune cells as the candidate cell types for Crohn’s Disease and multiple sclerosis and heart cells for QRS dura-tion. In this study, we took this approach to identify candidate tissue types where host genetic variation may be acting to determine bacterial abundance in the gut.
DNase-I hypersensitivity data from Mauranoet al.[43] was downloaded in bed format from
http://www.uwencode.org/proj/Science_Maurano_Humbert_et_al/on February 12th, 2014. The 349 available cell lines were clustered into 16 tissue classifications by calculating Euclidean distances for DNase peaks between all pairs of lines (S3 Table). DHS peaks for these tissues were determined by taking the intersection of all DHS peaks over all cell lines classified as that tissue in the previous step using intersectBed[44]. Overlaps between the genotyped Hutterite SNPs included in this study and each DHS peak for each tissue were determined using intersectBed.
We performed the following analysis for each of our bacterial abundance GWAS where either i) at least one SNP met suggestive genome-wide significance, or ii) there was non-zero
enrichment of SNPs identified in our GWAS (P-values at or below the given threshold) in DHS peaks from each of 16 tissues, compared to the genome-wide distribution of all tested SNPs located within DHS peaks of the same tissue. The enrichment of SNPs in DHS peaks per tissue (called“enrichments”in the remainder of this section) were calculated as described in Maur-anoet al., with the exception that the followingP-value thresholds were examined for each bac-terial abundance GWAS only if at least 50 SNPs hadP-values at or below the cutoff: 1.0, 0.5, 0.1, 0.05, 0.01, 0.005, 0.001, 0.0005, 0.0001, 0.00005, 0.00001, 0.000005 (S1 File). Significance of enrichment was assessed for each tissue for the smallestP-value bin size per bacterial taxa abundance GWAS by comparing the actual tissue enrichment observed to the distribution of tissue enrichments observed in permuted GWAS data. Specifically, normalized bacterial abun-dances were randomly assigned to individuals 10,000 times for each seasonal analysis. GWAS was performed for each of these permutations and the enrichment of top GWAS associations in DHS peaks was calculated for each tissue in each permutation, generating a null distribution of enrichments per tissue. The number of SNPs falling into the most significantP-value bin with at least 50 SNPs varied by GWAS. For each comparison, the number of SNPs in the small-est bin was matched in the permutations to the number of top SNPs in the smallsmall-estP-value bin from the actual GWAS. For example, if the actual GWAS for taxa“A”contained 63 SNPs in the smallestP-value bin, then the top 63 SNPs were chosen to calculate enrichment in each per-mutation. An empiricalP-value was calculated by dividing the number of enrichments in the null distribution that were equal to or larger than the actual enrichment value by the total num-ber of permutations (10,000) for each tissue (S4 Table). Note that reportedP-values are not corrected for multiple testing.
Gene set enrichment analysis (GSEA)
GSEA was performed for any bacterial abundance GWAS with at least one significantly associ-ated SNP using the R package postgwas[45]. Each tested SNP was assigned to the closest gene using Ensembl release 75 and any SNP further than 10kb from a gene was eliminated from analysis. An aggregate gene-wiseP-value was calculated using the function gene2p
(method = SpD) in postgwas by taking into account the dependency structure between SNPs. Gene ontology enrichment analyses were performed using the gwasGOenrich function with the following parameters: ontologies for cellular components, molecular function, and biologi-cal process were examined (ontology =“CC”,“MF”, or“BP”), pruneTermsBySize = 8,
pkgname.GO =“org.Hs.eg.db”, and topGOalgorithm =“classic”. Correction for multiple test-ing was accomplished ustest-ing q-values.
Yatsunenko
et al.
data comparison
Results
Correlations of relative taxa abundance with age and sex
In a previous study of these individuals, we examined the relationship of microbiome alpha diversity to age and sex. While a significant association between diversity and sex was not observed in either winter or summer, diversity was significantly inversely correlated with age during the winter months (P<0.01)[18]. Here, we sought to identify individual bacterial taxa
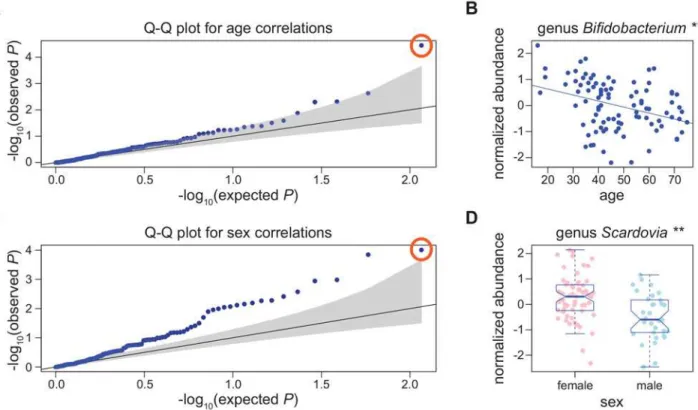
whose relative abundances were correlated with sex or age in the three seasonal analyses (win-ter, summer, or“seasons combined”). At a q-value cutoff0.05, the abundance of only one bacterial taxon was significantly inversely correlated with age in the winter samples (genus Bifi-dobacterium,Fig 1,Table 1,S5 Table). Members ofBifidobacteriumhave previously been shown to decrease in abundance with age in the gut[47,48].
In contrast, many bacterial taxa showed sex specific abundance patterns (4/116–winter, 5/ 104–summer, 18/102–“seasons combined”,Fig 1,Table 1,S6 Table). Moreover, bacterial taxa with sex-specific abundance patterns in multiple seasons tend to show the same direction of sex-specific effects, demonstrating that these are likely consistent sex differences over time (S2 Fig).
Estimates of chip heritability
To examine the role that common host genetic variation might play in determining microbial abundance in the gut, we examined“chip heritability”. This measurement, often referred to as Fig 1. Bacterial abundance correlations with age and sex.A) Q-Q plot for correlations of 116 common bacterial taxa with age in samples collected in winter. Gray shading represents the 95% confidence interval of the null. The point circled in orange is genusBifidobacterium. B) Abundance of genus Bifidobacteriumis inversely correlated with age in samples collected during the winter (**q0.01). C) Q-Q plot for correlations of 116 common bacterial taxa with sex in samples collected in winter. The point circled in orange represents genusScardovia. D) GenusScardoviawas significantly more abundant in females (n = 60) than in males (n = 33) in winter (**q0.01).
the proportion of variance explained (PVE), is the maximum amount of the variance in a phe-notype that can be explained by the genetic variation interrogated in a GWAS framework[49]. This method has proven successful in studies addressing questions of missing heritability for traits such as height[49], working memory performance[50], and liver enzyme levels[51].
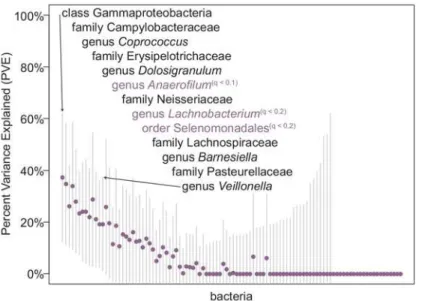
We calculated PVE for each bacterial taxon using ~200k SNPs, as implemented in GEMMA (seeMaterials and Methods). Approximately 10–13% of bacterial taxa in each season have non-zero“chip heritability”estimates, suggesting that a portion of the microbiome is heritable (winter: 14/116 taxa, summer: 10/104 taxa,“seasons combined”: 13/102 taxa;Fig 2,S2 Table,
S3 Fig). The standard errors of“chip heritability”estimates are very large, so we have not drawn conclusions about the actual heritability estimate or compared estimates between taxa due to the uncertainty in the measurement, but conservatively consider estimates whose error bars do not intersect zero as showing evidence of heritability.
In addition to bacterial relative abundance, we examined the“chip heritability”for three alpha diversity metrics. Diversity measures were calculated at the genus level (richness—S, Shannon diversity—H, and evenness—J) and included all classified bacterial genera (see Mate-rials and Methods). There was no evidence of“chip heritability”for any diversity metric in summer; however, evenness in the“seasons combined”analysis (“chip heritability”: J = 0.58 ± 0.32) and both evenness and Shannon diversity in winter (“chip heritability”: J = 0.56 ± 0.22, H = 0.52 ± 0.22) have non-zero estimates (S2 Table).
Genome-wide association studies (GWAS)
To determine if specific variants in the human genome are associated with microbial abun-dance in the gut, we employed a classic GWAS approach for quantitative trait mapping. A large number of SNP-taxon associations were tested (~100 bacterial taxa + 3 diversity metrics per season x 3 seasons x ~200k SNPs per GWAS), which sets a study-wise Bonferroni corrected
P-value threshold at 7.0 x 10⁻¹⁰. Given our sample size (~100 individuals per season), only associations with very large effect sizes would be expected to pass this significance threshold. Unsurprisingly, no variants passed this threshold in any of our analyses; therefore, we consider the individual SNP/taxon associations identified in these studies to be suggestive and requiring further replication.
Given this caveat, we identified genome-wide significant associations after correcting for multiple testingwithineach bacterial abundance GWAS individually, either by Bonferroni cor-rection or by q-value (considering significance thresholds at both q0.1 and q0.2 cutoffs). Table 1. Number of bacterial taxa that vary by sex or age in each season.The total number of taxa whose relative abundances were significantly corre-lated with age or sex at various q-value cutoffs are listed. Total number of taxa tested per season is indicated in the bottom row (total). In the text, we discuss the number of significantly correlated taxa in each season with a q-value threshold of0.05. The abundances of few bacterial taxa appear to vary consis-tently with age; however, the abundances of many bacterial taxa are correlated with sex in this population.
age sex
q-value cutoff winter summer combined winter summer combined
0.001 0 0 0 0 0 3
0.01 1 0 0 2 1 8
0.05a 1 0 0 4 5 18
0.1 1 1 2 16 19 24
0.2 4 5 2 19 30 49
Total examined 116 104 102 116 104 102
a
Confidence threshold chosen for significance
Limiting the correction for multiple testing to the number of tests done within an individual GWAS is similar to the typical correction applied to GWAS with human disease (where the correction factor is determined by the parameters of a GWAS for a specific disease, not across GWAS in studies that consider multiple phenotypes[52–55]).
At least one bacterial taxon per season was significantly associated with at least one SNP (at a Bonferroni significance threshold), and the abundances of at least eight bacterial taxa are associated with at least one SNP at q-values less than or equal to 0.2 (Table 2,S7 Table,Fig 3). There were no significant associations with alpha diversity metrics in any of the analyses.
We compared the results of our genome-wide association analyses to the“chip heritability”
estimates for each bacterial taxon and identified bacterial taxa that have both significant“chip heritability”and at least one suggestive genome-wide significant association (winter: 6 taxa, summer: 2 taxa,“seasons combined”: 3 taxa,Fig 2, seeMaterials and Methods). Overall, taxa with non-zero“chip heritability”for a given season were significantly enriched for having at Fig 2.“Chip heritability”for 102 bacterial taxa tested in the“seasons combined”analysis.Each point represents the estimated percent variance explained (PVE, or“chip heritability”) for the joint effect of all genotypes analyzed in the GWAS for bacterial abundance during the“seasons combined”analyses. Bars indicate standard error measurements around the estimate. A number of bacterial taxa showed non-zero PVE estimates (listed in order from highest to lowest PVE) with error bars that do not intersect zero, indicating that cumulative common genetic variation can explain some portion of the variation in bacterial abundance observed between individuals. Bacterial taxa that also had at least one nominally significant genetic association at a genome-wide association level are labeled in purple, with the level of significance indicated (q0.2 or q0.1).
doi:10.1371/journal.pone.0140301.g002
Table 2. Number of bacterial taxa with at least one SNP association reaching suggestive significance per season.For each season, the total number of bacterial taxa examined and number of single-nucleotide polymorphisms (SNPs) tested are listed. The number of taxa for which at least one SNP was associated with abundance at either a Bonferroni correctedP-value cutoff or a q-value cutoff of 0.1 or 0.2 are listed. The total number of taxa for which at least one associated SNP fell below q-value0.2 or a Bonferroni threshold are listed under“total significant”.
Total Thresholds of significance
Season Bacterial taxa SNPs Bonferroni q0.1 q0.2 Total significant
Winter 116 211,319 2 8 15 15
Summer 104 210,924 1 6 14 14
Combined 102 212,153 1 2 8 8
least one genome-wide significant SNP association using the winter microbiome data (permu-tationP<0.01), were slightly enriched for significant associations in the analysis of data from
both seasons (P= 0.07), but were not enriched for genome-wide associations in the summer microbiome data (P= 0.4,S4 Fig).
Gene set enrichment analysis (GSEA)
In order to gain insight into the type of host pathways and functions that might influence bac-terial abundance in the gut, we performed gene set enrichment analysis (GSEA) on all GWAS Fig 3. GWAS of genusAkkermansiarelative abundance.A) Manhattan plot of GWAS results for the normalized relative abundance of genus
Akkermansiafrom the“seasons combined”analysis. Each point represents a tested SNP, displayed by chromosomal position (x-axis). The y-axis shows–
log10(P-value) for each SNP. SNPs significantly associated with normalizedAkkermansiarelative abundance (q0.2) are shown in purple on chromosome 3. B) Q-Q plot forP-values from the GWAS of the relative abundance of genusAkkermansia. The majority of SNPs lie along the null line, demonstrating the test statistics did not appear to be inflated (due to population stratification, for example). Five SNPs (all in linkage disequilibrium (LD) on chromosome 3) were significantly associated withAkkermansiaabundance. The point circled in orange was the most highly associated SNP (rs4894707). C) Normalized Akkermansiaabundance, segregated by genotype class at rs4894707 on chromosome 3. Only two genotype classes are represented at this SNP (MAF = 0.185 and Hardy-WeinbergP-value = 0.007 in a larger sample of 1,415 Hutterites that includes the individuals in this study). This SNP lies in a UTR region of the genePLD1, which as been implicated in obesity studies in African American populations[56].
with at least one genome-wide significant association in our study (S2 File, seeMaterials and Methods). For most bacterial GWAS, we do not observe enrichment of any gene ontology (GO) categories given the distribution ofP-values of SNPs located in or near annotated genes in the genome (within 10kb). However, for several bacterial GWAS (winter: 4 taxa, summer: 10 taxa,“seasons combined”: 6 taxa), GSEA resulted in significant enrichments for biological pro-cesses one might expect to be interacting with the microbiome (q0.2). For example, GSEA revealed enrichments of genes categorized under immune processes (summer: genus Sporaceti-genium) and metabolic processes (winter: order Burkholderiales; summer: genus Sporacetigen-ium;“seasons combined”: genusMegasphaera), as well as in pathways that generate ribosomal components (summer: genusAnaerostipes;“seasons combined”: genusAnaerofilum) and act in multi-organism process and communication (“seasons combined”: genusAnaerostipes). Finally, enrichment in olfactory receptor pathways was observed for a number of taxa (winter: family Succinivibrionaceae; summer: genusBifidobacterium, order Rhizobiales;“seasons com-bined”: genusAnaerofilum, genusFaecalibacterium). One caveat to note is that olfactory recep-tor genes tend to be clustered in the genome, which can lead to spurious enrichment in gene ontology tests.
Identification of candidate tissues
Our GWAS revealed a number of candidate variants that potentially influence gut microbiome composition; however, we lack an understanding of the relevant tissues in which these variants act. We sought to provide insight into this question by intersecting our GWAS results with DNase hypersensitivity (DHS) data, following the approach of Mauranoet al.[43]. Cell types identified through their analysis were deemed“pathogenic cell types”; here we will refer to them simply as candidate tissues because the unknown relationships of our GWAS results to disease.
We performed this candidate tissue identification analysis for each of our GWAS of bacte-rial abundance when either i) at least one SNP met suggestive genome-wide significance, or ii) there was non-zero“chip heritability”for that taxon (number of taxa examined in winter = 23, summer = 22,“seasons combined”= 18). When considering all bacterial taxa that met our inclusion criteria from either the winter or summer data sets, we do not observe more candi-date tissues identified at nominal significance than we would expect by chance (S5 Fig). In con-trast, for taxa meeting our inclusion criteria from the“seasons combined”analysis, we
observed more candidate tissues of nominal significance than would be expected by chance; therefore we only considered results from the“seasons combined”analysis further.
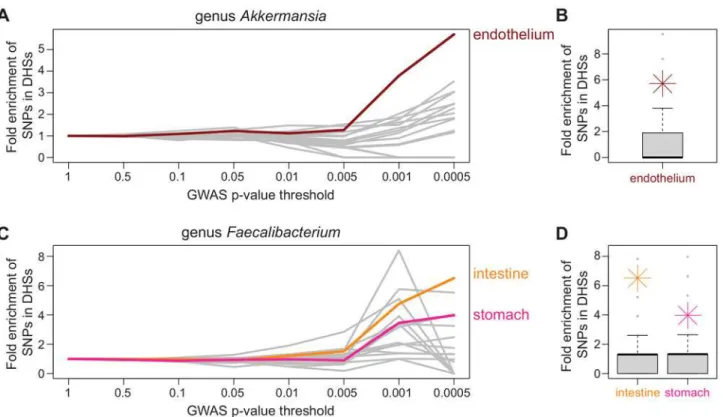
For five bacterial taxa we are able to identify at least one candidate tissue (out of 18 total taxa that met inclusion criteria from“seasons combined”analyses). Endothelial tissues were identified for genusAkkermansiaand muscle tissues for genusDolosigranulum. Both intestine and stomach tissues were identified as potential candidates for genusFaecalibacterium. Family Neisseriaceae and family Pasteurellaceae both have a large number of tissues identified as can-didates (Fig 4,S6 Fig).
Discussion
The role of host genetics in gut microbiome composition
bacterial taxa in each season whose abundances were significantly associated with genetic vari-ation in the human genome. Finally, we examined host tissue types in which genetic varivari-ation may be acting to influence gut microbial composition.
Although no human replication cohorts are published, we replicated a previously reported association from a quantitative trait locus (QTL) mapping study of microbial abundance in the gut of advanced intercross mouse strains[30]. In that study, genusLactococcusshowed strong evidence of association (LOD score = 8) with markers on mouse chromosome 10. In our study, genusLactococcusalso showed evidence of genetic association in the summer (rs3747113,
P= 3.13 x 10⁻⁷). Interestingly, the associated variant in the Hutterites is located in the syntenic linkage interval observed in the mouse QTL study, providing evidence of replication of this association across species. The size of the linkage interval in Bensonet al. spans tens of mega-bases of the mouse genome, however, and finer mapping is needed to confirm replication.
One of the more biologically interesting results of our study was the identification of SNPs that were associated with abundance levels of genusAkkermansia(Fig 3). These SNPs lie within intronic and untranslated regions (UTR) of the genePLD1, which is thought to play a Fig 4. Identification of candidate tissues.At increasingly significantP-value thresholds, variants identified through GWAS were enriched in DNase hypersensitivity peaks in a tissue-specific manner. A) For genusAkkermansia, lowP-value GWAS SNPs were significantly enriched in DHS peaks in endothelial cell types (red), but not in DHS peaks of the 15 other tissues examined (gray). The x-axis shows theP-value threshold bins examined and y-axis represents fold enrichment for SNPs overlapping DHS peaks in that bin compared to genome-wide for that tissue type. Both the abundance of genus Akkermansiaand endothelial barrier function have been associated with obesity, providing a mechanistic hypothesis that can be further investigated. B) For genusAkkermansia, the significance of enrichment of GWAS SNPs overlapping DHS peaks in endothelial tissue in the lowestP-value bin (P0.0005) was determined by GWAS permutation (P0.05, seeMaterials and Methods). The distribution of permuted GWAS SNP enrichments in DHS peaks of endothelial tissue is displayed as a boxplot with actual enrichment plotted as red star. C) For genusFaecalibacterium, lowP-value GWAS SNPs are significantly enriched in DHS peaks of both intestine (orange) and stomach (pink) tissues (P0.05). D) For genusFaecalibacterium, the significance of enrichment of GWAS SNPS overlapping DHS peaks of both intestine and stomach tissues in the lowestP-value bin (P0.0005) was determined by GWAS permutation (intestineP0.01, stomachP0.05, seeMaterials and Methods). Members ofFaecalibacteriumare some of the most common species in the gut and are known to be associated with dysbiosis in patients with irritable bowel syndrome. The distribution of permuted enrichments for each identified candidate tissue is displayed as a boxplot with actual enrichment plotted as an orange (intestine) and pink (stomach) star.
role in signal transduction and subcellular trafficking[57–59]. This gene was implicated in a previous GWAS of body mass index (BMI) in African Americans, because a SNP associated with BMI is located near the gene[56]. In addition, increased abundance ofAkkermansia muci-niphilawas recently shown to be protective against developing obesity in mice[60]. These cor-relations between a bacterial taxon, genetic variation, and BMI possibly suggest a mechanism for how genetic variation in or near this gene acts to influence obesity. Further support for this mechanism was provided by thede novocandidate tissue identification in which SNPs with lowP-values from the genusAkkermansiaGWAS were significantly enriched in DHS peaks of endothelial cell types (Fig 4). Endothelial barrier function is thought to be important in obesity. For example, in swine fed with a high-fat diet to promote obesity, endothelial barriers became more permeable early during weight gain[61]. In addition, endothelial permeability is regulated by the immune system[62–64], and there are strong links between alterations in the immune system with obesity[65–67]. We did not observe associations between BMI and the relative abundance of genusAkkermansiain the Hutterite sample (P= 0.51); but BMI was measured on these individuals 3–5 years prior to microbiome sampling. Further investigation is needed to validate this intriguing hypothesis by confirming the relationship ofAkkermansiatoPLD1
and obesity, ideally within a set of samples where microbiome and obesity measures are col-lected concurrently.
Host cell types and pathways implicated from GWAS results
In addition to examining human variation that met statistical thresholds at a genome-wide sig-nificance level, gene-set enrichment analysis revealed a number of human cellular pathways that might be an important interface between the host and the microbiome. In particular, olfac-tory receptor activity was significant in GSEA for five taxon GWAS (winter: family Succinivi-brionaceae; summer: genusBifidobacterium, order Rhizobiales; combined: genusAnaerofilum, genusFaecalibacterium). It has already been demonstrated that olfactory receptors form an interface between the host and the gut microbiota. In mice, an olfactory receptor expressed in the kidneys responds to metabolites produced by gut bacteria, and this process aids in regulat-ing blood pressure systemically via renin production[68]. It is possible that additional olfactory receptors in other tissues may also recognize compounds produced by the microbiota and act as a way for the host to regulate either host physiology or the microbiome in response to the gut environment. These results demonstrate that host genetic variation may exert control over microbial abundance through a variety of mechanisms, such as through immune system inter-action, metabolism, energy availability, and potentially olfactory receptor activity.
The role of sex in gut microbiome composition
In addition to examining the role of host genetics in determining gut microbiome composition, we also identified bacterial taxa that are differentially abundant by sex. In the Hutterites, at least four bacterial taxa differ in abundance between the sexes each season, including genus
Scardovia, genusGordonibacter, genusAnaerotruncus, and phylum Proteobacteria. These abundance differences are directionally consistent across season and there are a number of hypotheses for these observations. One potential explaination is that inherent biological differ-ences between the sexes (for instance hormone levels) could drive the observed bacterial abun-dance differences. Alternatively, the division of labor could drive sex specific differences between men and women in Hutterite society[79]. For example, Hutterite men typically work in the income-generating jobs, which vary by colony. Younger men might work in the fields, barns, or machine shops, while older men take on positions of leadership in the colonies. In contrast, Hutterite women perform family, domestic, and food preparation jobs, including cooking, cleaning, gardening, and sewing. It is possible that men and women are exposed to different environmental microbes due to differences in their daily activities. A similar notion was suggested previously in a study of Hadza hunter-gatherers, where sex differences in the rel-ative abundances of three taxa of the gut microbiome were observed[80]. The authors attrib-uted those differences to the division of labor between men and women in that society (men tend to forage further from camp and for different food sources than women, who remain near to camp to stay with the children).
To further investigate these two hypotheses, we examined whether sex is associated with bacterial abundances in additional populations, including individuals from the USA and Vene-zuela, using the data produced by Yatsunenkoet al.[46] (seeMaterials and Methods). If under-lying physiological differences between the sexes leads to varied bacterial compositions, we might expect to observe sexual dimorphism in the abundance of the same bacterial taxa across different geographies and cultures. While 14 bacterial taxa showed significant differential abundance by sex in the Yatsunenko USA population, none were significantly differentially abundant after multiple testing corrections in the Venezuelan populations (S8 Table,S7 Fig). Additionally, there was no overlap between the taxa identified as differentially abundant by sex in the Hutterites or in the Yatsunenko USA population (S9 Table). Given the differences in microbial exposures and in the uniformity of the environments within the Yatsunenko and Hutterite populations, it is unclear whether sex differences in the microbiome are due to bio-logical or cultural factors, or a combination of both.
In our previous study of seasonal effects on the gut microbiome in the Hutterites[18], we did not observe differences in alpha diversity metrics (Shannon diversity, species richness, or species evenness) between men and women in either winter or summer. Conversely, when we considered individual bacterial taxon abundances we observed many sex differences in this population. These results highlight an important phenomenon that should be considered in microbiome studies: trends observed in broad summary statistics, such as diversity, are not always observed at individual taxon levels and vice versa.
Limitations and conclusions
factors and increase our power to detect genetic associations. While this may be true, it is clear that much larger sample sizes will be needed to ensure sufficient power to detect association with the high multiple testing burden and for narrowing the confidence intervals on heritability estimates. A second limitation is that published replication cohorts are not currently available for these traits in humans and we are unable to confirm any associations we detect in indepen-dent human samples.
Despite these limitations, we do replicate a previously observed bacterial abundance QTL in mouse[30]. Additionally, the candidate tissue identification analysis provided additional vali-dation of our results, as we would not expect any kind of enrichment if our results were all spu-rious. Finally, several lines of evidence point towards a relationship of genusAkkermansia, in particular, to host genetics, including genome-wide significant GWAS hits (Fig 3), endothelial cell type enrichments for the top associations (Fig 4), and biological plausibility[56,60]. Given the medical importance of this genus[60,81], further work should be performed to confirm this relationship and further explore how host genetics might influence this taxon.
This study is one of the first to explore host genetic influences on gut microbiome composi-tion on a genome-wide scale in humans. We identified bacterial taxa that show sex specific pat-terns of abundance in the Hutterites, although it is unclear whether biological or cultural factors are driving these patterns. We identified at least 10 bacterial taxa in each season that appear to be heritable, by examining“chip heritability”. At least seven bacterial taxa in each season are associated with variation in the human genome at a genome-wide significance level when considering the number of SNP tested within each GWAS. Gene set enrichment analysis demonstrated that the SNPs identified in these GWAS likely function through a variety of dif-ferent mechanisms in the body including immune function, metabolism, and energy regula-tion. Finally, candidate tissues where host genetic variation might act to influence microbial abundance in the gut were identified. This work offers a first glimpse into the role human genetics plays in maintaining gut microbiome composition.
Supporting Information
S1 Fig. Principal components analysis (PCA) of“seasons combined”analysis.PCA was per-formed on all individuals (genus level data) after combining data that had been normalized within season first. Quantile normalization within each season separately before combining data eliminates seasonal differences along the top 10 principal components (PCs 1 and 2 plot-ted here, linear modelP>0.05).
(TIFF)
S2 Fig. Bacterial taxa that show correlations with sex in at least two seasons examined.Each of these bacterial taxa shows differential abundance by sex in at least two seasons examined. For most bacterial taxa, the direction of association stays constant between males and females regardless of season, pointing to consistent variation of bacterial abundance between the sexes. Significance: q0.05 =
, q0.01 =
, q0.001 =
, ns = not significant). Bacterial taxa include A) genusClostridium, B) genusCollinsella, C) genusGordonibacter, D) genus Mitsuo-kella, E) genusScardovia, F) order Burkholderiales, G) phylum TM7.
(TIFF)
S3 Fig.“Chip heritability”across season.“Chip heritability”(or Percent Variance Explained, PVE, circle) along with the standard error around the estimate (gray bars) is shown for the bac-terial taxa observed in all three seasonal analyses. Bacbac-terial taxa are ordered by the PVE in the
indicate taxa that did not have any SNPs associated with their abundance in that season after correcting for multiple tests genome-wide.
(TIFF)
S4 Fig. Overlap of bacterial taxa showing evidence of heritability and GWAS signals.The number of overlaps between bacterial taxa showing heritability (from“chip heritability” esti-mation) and bacterial taxa with at least one genome-wide significant association from GWAS is shown for each season with the colored, dashed line. A null distribution of overlaps expected by chance given the number of bacterial taxa showing heritability and showing a GWAS hit was calculated by permuting which bacterial taxa were labeled as heritable 1000 times. An empirical p-value was calculated by dividing the number of overlaps observed in the permuta-tions greater than the actual overlap by the total number of permutapermuta-tions (1000). This was done for each season: A) winter, B) summer, and C)“seasons combined”.
(TIFF)
S5 Fig. Distribution of p-values from candidate tissue identification analyses.P-values were calculated via permutation for each tissue for each bacterial taxon that had either non-zero
“chip heritability”or at least one genome-wide significant SNP. The number of expected asso-ciations with aP0.05 is indicated with the red line on each plot. As can be seen from the his-tograms, most tissues do not show enrichment for low GWAS p-value SNPs in DHS peaks (large excess aroundP= 1). For winter (A) and summer (B), there are not more associations at
P0.05 than we would expect by chance. However, in the“seasons combined”analysis (C), there is a slight excess ofP-values0.05, indicating significant associations exist in this analy-sis (although many false positives likely exist as well). Therefore, candidate tissue analyanaly-sis for winter and summer were not considered further.
(TIFF)
S6 Fig. Additional candidate tissues identified in“seasons combined”analysis.A, C, and E) GWAS variants with increasingly lowP-values (x-axis in (A), (C), and (E)) are enriched (y-axis) in DNase Hypersensitivity Sites (DHS) for various tissues, compared to the genome-wide distribution of GWAS SNPs falling in DHS peaks for that tissue. Identified tissues are listed in the top left corner for each bacterial taxon examined (color matches lines on plot and order is the same as order in the y-dimension in the lowestP-value bin). Any tissue not listed (drawn in the thin, gray line) did not have significant enrichment in the lowestP-value bin. B, D, and F) Boxplots (gray) indicate the null distribution of enrichments of SNPs in the lowest GWASP -value bin in DHS peaks for the given tissues calculated from GWAS permutations from (A), (C), and (E), respectively. The actual enrichment of SNPs in the lowest GWASP-value bin overlapping DHS peaks for each tissue is indicated by the colored star. All enrichments shown have aP0.05. A & B) family Neisseriaceae, C & D) family Pasteurellaceae, and E & F) genus
Dolosigranulum. (TIFF)
S7 Fig. Distribution of p-values for sex correlations in Yatsunenko populations.A and C) Histograms of theP-values for bacterial taxa correlated with sex in the USA (A) and Venezue-lan (C) populations. B and D) Quantile-quantile plots (Q-Q plots) of the -log10(P-values) for sex correlation testing in the USA (B) and Venezuelan (D) populations. In the USA, there is an excess of lowP-values, indicating many bacterial taxa show differential abundance by sex. (TIFF)
is one text file per bacteria tested. Each text file contains 17 rows and variable numbers of col-umns. Each row represents one tissue type as determined by clustering analysis of DHS peaks (along with a header). Each column represents a GWAS p-value threshold examined. The min-imum threshold chosen for each bacterium contains at least 50 SNPs. Entries are the enrich-ment of GWAS SNPs under that threshold compared to genome-wide for that tissue type. (ZIP)
S2 File. Gene set enrichment analysis (GSEA) results.This folder contains GSEA results for all that had at least one genome-wide significant hit (either after Bonferroni correction or q<0.2). It contains three folders (one per seasonal analysis–winter, summer,“seasons
com-bined”). Each folder contains three files per bacterial taxa tested (categories from GO: BP
—"biological process", CC—"cellular compartment", MF—"molecular function"). Only GO cat-egories with a q<0.2 were examined. If a file contains only header information, there were no
significant enrichments. (ZIP)
S1 Table. Taxa filtered out during QC.This table contains the list of bacteria that were trimmed due to high correlation with another bacterium for the "winter", "summer", and "sea-sons combined" analyses.
(XLSX)
S2 Table. "Chip heritability" for each bacterial taxon.This table contains proportion of vari-ance explained (PVE) estimates ("chip" heritability) for the "winter", "summer", and "seasons combined" analyses and reported by GEMMA.
(XLSX)
S3 Table. Tissue classification for enrichment analysis.This table lists the DNase Hypersen-sitivity Site (DHS) sample names from Mauranoet al. and the tissue it was classified as using the clustering procedure described in the methods.
(XLSX)
S4 Table. Candidate tissue p-values.This table containsP-values representing the significance of enrichment of GWAS SNPs overlapping DHS peaks in each of the 16 tissues examined in the lowest GWAS p-value bin tested for each bacterial taxon.
(XLSX)
S5 Table. Associations of bacterial taxa to age.This table contains tables ofP-values and q-values for age correlations done in GEMMA for the "winter", "summer", and "seasons com-bined" analyses.
(XLSX)
S6 Table. Correlations of bacterial taxa to sex.This table contains tables ofP-values and q-values for sex correlations done in GEMMA for the "winter", "summer", and "seasons com-bined" analyses.
(XLSX)
S7 Table. Top GWAS hits.This table contains all SNPs that met a genome-wide significance threshold either with aP-value after Bonferroni correction or with a q-value<= 0.2.
(XLSX)
considered significantly differentially abundant between the sexes. (XLSX)
S9 Table. Overlap of differentially abundant bacterial taxa by sex in the Hutterite and Yat-sunenko populations.This table lists the number of bacterial taxa that showed evidence of being differentially abundant by sex in all three Hutterite seasons examined (winter, summer, and“seasons combined”) and two of the Yatsunenko populations (USA and Venezuela). Only the taxa identified as common in both populations examined were considered. The significance of the overlap in bacterial taxa identified in each population is listed (seemethods).
(XLSX)
Acknowledgments
We thank the Hutterites for their willingness to participate in the study; Rebecca Anderson, Daniel Cook, and Marina Antillon for assistance with mailings and coordination of the study; Sally Cain for sample collection; Xiang Zhou, Matthew Stephens, and Dan Nicolae for statisti-cal advice; Orna Mizrahi-Man for comments on the manuscript; and members of the Clark, Luca, Pique-Regi, Knights, Pop, and especially Gilad and Ober groups for helpful discussion and suggestions.
Author Contributions
Conceived and designed the experiments: LBB CO YG. Performed the experiments: ED KM. Analyzed the data: ED. Contributed reagents/materials/analysis tools: DC. Wrote the paper: ED CO YG.
References
1. Savage DC. Microbial ecology of the gastrointestinal tract. Annual review of microbiology. 1977; 31:107–33. doi:10.1146/annurev.mi.31.100177.000543PMID:334036.
2. Backhed F, Ding H, Wang T, Hooper LV, Koh GY, Nagy A, et al. The gut microbiota as an environmen-tal factor that regulates fat storage. Proceedings of the National Academy of Sciences of the United States of America. 2004; 101(44):15718–23. PMID:15505215.
3. Turnbaugh PJ, Hamady M, Yatsunenko T, Cantarel BL, Duncan A, Ley RE, et al. A core gut micro-biome in obese and lean twins. Nature. 2009; 457(7228):480–4. doi:10.1038/nature07540PMID: 19043404; PubMed Central PMCID: PMC2677729.
4. Turnbaugh PJ, Ley RE, Mahowald MA, Magrini V, Mardis ER, Gordon JI. An obesity-associated gut microbiome with increased capacity for energy harvest. Nature. 2006; 444(7122):1027–31. doi:10. 1038/nature05414PMID:17183312.
5. Nadal I, Donat E, Donant E, Ribes-Koninckx C, Calabuig M, Sanz Y. Imbalance in the composition of the duodenal microbiota of children with coeliac disease. Journal of medical microbiology. 2007; 56(Pt 12):1669–74. PMID:18033837.
6. Dicksved J, Halfvarson J, Rosenquist M, Jarnerot G, Tysk C, Apajalahti J, et al. Molecular analysis of the gut microbiota of identical twins with Crohn's disease. The ISME journal. 2008; 2(7):716–27. PMID: 18401439. doi:10.1038/ismej.2008.37
7. Manichanh C, Rigottier-Gois L, Bonnaud E, Gloux K, Pelletier E, Frangeul L, et al. Reduced diversity of faecal microbiota in Crohn's disease revealed by a metagenomic approach. Gut. 2006; 55(2):205–11. PMID:16188921.
8. Sokol H, Lepage P, Seksik P, Dore J, Marteau P. Temperature gradient gel electrophoresis of fecal 16S rRNA reveals active Escherichia coli in the microbiota of patients with ulcerative colitis. J Clin Microbiol. 2006; 44(9):3172–7. PMID:16954244.
9. Bibiloni R, Mangold M, Madsen KL, Fedorak RN, Tannock GW. The bacteriology of biopsies differs between newly diagnosed, untreated, Crohn's disease and ulcerative colitis patients. Journal of medi-cal microbiology. 2006; 55(Pt 8):1141–9. PMID:16849736.
11. Sokol H, Seksik P, Rigottier-Gois L, Lay C, Lepage P, Podglajen I, et al. Specificities of the fecal micro-biota in inflammatory bowel disease. Inflammatory bowel diseases. 2006; 12(2):106–11. PMID: 16432374.
12. Barman M, Unold D, Shifley K, Amir E, Hung K, Bos N, et al. Enteric salmonellosis disrupts the micro-bial ecology of the murine gastrointestinal tract. Infection and immunity. 2008; 76(3):907–15. PMID: 18160481.
13. Russell SL, Gold MJ, Hartmann M, Willing BP, Thorson L, Wlodarska M, et al. Early life antibiotic-driven changes in microbiota enhance susceptibility to allergic asthma. EMBO reports. 2012; 13(5):440–7. doi:10.1038/embor.2012.32PMID:22422004; PubMed Central PMCID: PMC3343350.
14. Kassinen A, Krogius-Kurikka L, Makivuokko H, Rinttila T, Paulin L, Corander J, et al. The fecal micro-biota of irritable bowel syndrome patients differs significantly from that of healthy subjects. Gastroenter-ology. 2007; 133(1):24–33. PMID:17631127.
15. Collins SM, Denou E, Verdu EF, Bercik P. The putative role of the intestinal microbiota in the irritable bowel syndrome. Dig Liver Dis. 2009; 41(12):850–3. PMID:19740713. doi:10.1016/j.dld.2009.07.023
16. Dominguez-Bello MG, Costello EK, Contreras M, Magris M, Hidalgo G, Fierer N, et al. Delivery mode shapes the acquisition and structure of the initial microbiota across multiple body habitats in newborns. Proceedings of the National Academy of Sciences. 2010:1–5.
17. Harmsen HJ, Wildeboer-Veloo AC, Raangs GC, Wagendorp AA, Klijn N, Bindels JG, et al. Analysis of intestinal flora development in breast-fed and formula-fed infants by using molecular identification and detection methods. Journal of pediatric gastroenterology and nutrition. 2000; 30(1):61–7. PMID: 10630441.
18. Davenport ER, Mizrahi-Man O, Michelini K, Barreiro LB, Ober C, Gilad Y. Seasonal variation in human gut microbiome composition. PloS one. 2014; 9(3):e90731. doi:10.1371/journal.pone.0090731PMID: 24618913; PubMed Central PMCID: PMC3949691.
19. Duncan SH, Belenguer A, Holtrop G, Johnstone AM, Flint HJ, Lobley GE. Reduced dietary intake of carbohydrates by obese subjects results in decreased concentrations of butyrate and butyrate-produc-ing bacteria in feces. Applied and environmental microbiology. 2007; 73(4):1073–8. doi:10.1128/AEM. 02340-06PMID:17189447; PubMed Central PMCID: PMC1828662.
20. De Filippo C, Cavalieri D, Di Paola M, Ramazzotti M, Poullet JB, Massart S, et al. Impact of diet in shap-ing gut microbiota revealed by a comparative study in children from Europe and rural Africa. Proceed-ings of the National Academy of Sciences of the United States of America. 2010; 107(33):14691–6. doi: 10.1073/pnas.1005963107PMID:20679230; PubMed Central PMCID: PMC2930426.
21. Hehemann JH, Correc G, Barbeyron T, Helbert W, Czjzek M, Michel G. Transfer of carbohydrate-active enzymes from marine bacteria to Japanese gut microbiota. Nature. 2010; 464(7290):908–12. doi:10. 1038/nature08937PMID:20376150.
22. Zoetendal EG, Akkermans ADL, Akkermans-van Vliet WM, de Visser JAGM, de Vos WM. The Host Genotype Affects the Bacterial Community in the Human Gastrointestinal Tract. Microbial Ecology in Health and Disease. 2001; 13(3%@ 1651–2235|escape}).
23. Goodrich JK, Waters JL, Poole AC, Sutter JL, Koren O, Blekhman R, et al. Human genetics shape the gut microbiome. Cell. 2014; 159(4):789–99. doi:10.1016/j.cell.2014.09.053PMID:25417156; PubMed Central PMCID: PMC4255478.
24. Khachatryan ZA, Ktsoyan ZA, Manukyan GP, Kelly D, Ghazaryan KA, Aminov RI. Predominant role of host genetics in controlling the composition of gut microbiota. PloS one. 2008; 3(8):e3064. doi:10. 1371/journal.pone.0003064PMID:18725973; PubMed Central PMCID: PMC2516932.
25. De Palma G, Capilla A, Nadal I, Nova E, Pozo T, Varea V, et al. Interplay between human leukocyte antigen genes and the microbial colonization process of the newborn intestine. Current issues in molec-ular biology. 2010; 12(1):1–10. PMID:19478349.
26. Knights D, Silverberg MS, Weersma RK, Gevers D, Dijkstra G, Huang H, et al. Complex host genetics influence the microbiome in inflammatory bowel disease. Genome medicine. 2014; 6(12):107. doi:10. 1186/s13073-014-0107-1PMID:25587358; PubMed Central PMCID: PMC4292994.
27. Zhang C, Zhang M, Wang S, Han R, Cao Y, Hua W, et al. Interactions between gut microbiota, host genetics and diet relevant to development of metabolic syndromes in mice. The ISME journal. 2010; 4 (2):232–41. doi:10.1038/ismej.2009.112PMID:19865183.
28. Petnicki-Ocwieja T, Hrncir T, Liu YJ, Biswas A, Hudcovic T, Tlaskalova-Hogenova H, et al. Nod2 is required for the regulation of commensal microbiota in the intestine. Proceedings of the National Acad-emy of Sciences of the United States of America. 2009; 106(37):15813–8. doi:10.1073/pnas. 0907722106PMID:19805227; PubMed Central PMCID: PMC2747201.
States of America. 2004; 101(7):1981–6. doi:10.1073/pnas.0307317101PMID:14766966; PubMed Central PMCID: PMC357038.
30. Benson AK, Kelly SA, Legge R, Ma F, Low SJ, Kim J, et al. Individuality in gut microbiota composition is a complex polygenic trait shaped by multiple environmental and host genetic factors. Proceedings of the National Academy of Sciences of the United States of America. 2010; 107(44):18933–8. doi:10. 1073/pnas.1007028107PMID:20937875; PubMed Central PMCID: PMC2973891.
31. Schloss PD, Westcott SL, Ryabin T, Hall JR, Hartmann M, Hollister EB, et al. Introducing mothur: open-source, platform-independent, community-supported software for describing and comparing microbial communities. Applied and environmental microbiology. 2009; 75(23):7537–41. doi:10.1128/AEM. 01541-09PMID:19801464; PubMed Central PMCID: PMC2786419.
32. Ober C, Tan Z, Sun Y, Possick JD, Pan L, Nicolae R, et al. Effect of variation in CHI3L1 on serum YKL-40 level, risk of asthma, and lung function. The New England journal of medicine. 2008; 358(16):1682–
91. doi:10.1056/NEJMoa0708801PMID:18403759; PubMed Central PMCID: PMC2629486.
33. Ober C, Nord AS, Thompson EE, Pan L, Tan Z, Cusanovich D, et al. Genome-wide association study of plasma lipoprotein(a) levels identifies multiple genes on chromosome 6q. Journal of lipid research. 2009; 50(5):798–806. doi:10.1194/jlr.M800515-JLR200PMID:19124843; PubMed Central PMCID: PMC2666166.
34. Cusanovich DA, Billstrand C, Zhou X, Chavarria C, De Leon S, Michelini K, et al. The combination of a genome-wide association study of lymphocyte count and analysis of gene expression data reveals novel asthma candidate genes. Human molecular genetics. 2012; 21(9):2111–23. doi:10.1093/hmg/ dds021PMID:22286170; PubMed Central PMCID: PMC3315207.
35. Yao TC, Du G, Han L, Sun Y, Hu D, Yang JJ, et al. Genome-wide association study of lung function phenotypes in a founder population. The Journal of allergy and clinical immunology. 2014; 133(1):248–
55 e1-10. doi:10.1016/j.jaci.2013.06.018PMID:23932459.
36. Korn JM, Kuruvilla FG, McCarroll SA, Wysoker A, Nemesh J, Cawley S, et al. Integrated genotype call-ing and association analysis of SNPs, common copy number polymorphisms and rare CNVs. Nat Genet. 2008; 40(10):1253–60. doi:10.1038/ng.237PMID:18776909; PubMed Central PMCID: PMC2756534.
37. R: A language and environment for statistical computing. [Internet]. 2011. Available: http://www.R-project.org/.
38. Zhou X, Stephens M. Genome-wide efficient mixed-model analysis for association studies. Nature genetics. 2012; 44(7):821–4. doi:10.1038/ng.2310PMID:22706312; PubMed Central PMCID: PMC3386377.
39. Han L, Abney M. Using identity by descent estimation with dense genotype data to detect positive selection. European journal of human genetics: EJHG. 2013; 21(2):205–11. doi:10.1038/ejhg.2012. 148PMID:22781100; PubMed Central PMCID: PMC3548265.
40. Storey JD, Tibshirani R. Statistical significance for genomewide studies. Proceedings of the National Academy of Sciences of the United States of America. 2003; 100(16):9440–5. doi:10.1073/pnas. 1530509100PMID:12883005; PubMed Central PMCID: PMC170937.
41. Oksanen J, Guillaume Blanchet F, Kindt R, Legendre P, Minchin P, O'Hara R, et al. vegan: Community Ecology Package. R package version 22–1. 2015; Available:http://CRAN.R-project.org/package= vegan.
42. Natarajan A, Yardimci GG, Sheffield NC, Crawford GE, Ohler U. Predicting cell-type-specific gene expression from regions of open chromatin. Genome research. 2012; 22(9):1711–22. doi:10.1101/gr. 135129.111PMID:22955983; PubMed Central PMCID: PMC3431488.
43. Maurano MT, Humbert R, Rynes E, Thurman RE, Haugen E, Wang H, et al. Systematic localization of common disease-associated variation in regulatory DNA. Science. 2012; 337(6099):1190–5. doi:10. 1126/science.1222794PMID:22955828; PubMed Central PMCID: PMC3771521.
44. Quinlan AR, Hall IM. BEDTools: a flexible suite of utilities for comparing genomic features. Bioinformat-ics. 2010; 26(6):841–2. doi:10.1093/bioinformatics/btq033PMID:20110278; PubMed Central PMCID: PMC2832824.
45. Hiersche M, Ruhle F, Stoll M. Postgwas: advanced GWAS interpretation in R. PloS one. 2013; 8(8): e71775. doi:10.1371/journal.pone.0071775PMID:23977141; PubMed Central PMCID: PMC3747239.
46. Yatsunenko T, Rey FE, Manary MJ, Trehan I, Dominguez-Bello MG, Contreras M, et al. Human gut microbiome viewed across age and geography. Nature. 2012; 486(7402):222–7. doi:10.1038/ nature11053PMID:22699611; PubMed Central PMCID: PMC3376388.
48. Hopkins MJ, Macfarlane GT. Changes in predominant bacterial populations in human faeces with age and with Clostridium difficile infection. Journal of medical microbiology. 2002; 51(5):448–54. PMID: 11990498.
49. Yang J, Benyamin B, McEvoy BP, Gordon S, Henders AK, Nyholt DR, et al. Common SNPs explain a large proportion of the heritability for human height. Nature genetics. 2010; 42(7):565–9. doi:10.1038/ ng.608PMID:20562875; PubMed Central PMCID: PMC3232052.
50. Vogler C, Gschwind L, Coynel D, Freytag V, Milnik A, Egli T, et al. Substantial SNP-based heritability estimates for working memory performance. Translational psychiatry. 2014; 4:e438. doi:10.1038/tp. 2014.81PMID:25203169; PubMed Central PMCID: PMC4203010.
51. van Beek JH, Lubke GH, de Moor MH, Willemsen G, de Geus EJ, Hottenga JJ, et al. Heritability of liver enzyme levels estimated from genome-wide SNP data. European journal of human genetics: EJHG. 2014. doi:10.1038/ejhg.2014.259PMID:25424715.
52. Wellcome Trust Case Control C. Genome-wide association study of 14,000 cases of seven common diseases and 3,000 shared controls. Nature. 2007; 447(7145):661–78. doi:10.1038/nature05911 PMID:17554300; PubMed Central PMCID: PMC2719288.
53. Levy D, Ehret GB, Rice K, Verwoert GC, Launer LJ, Dehghan A, et al. Genome-wide association study of blood pressure and hypertension. Nature genetics. 2009; 41(6):677–87. doi:10.1038/ng.384PMID: 19430479; PubMed Central PMCID: PMC2998712.
54. Cho YS, Go MJ, Kim YJ, Heo JY, Oh JH, Ban HJ, et al. A large-scale genome-wide association study of Asian populations uncovers genetic factors influencing eight quantitative traits. Nature genetics. 2009; 41(5):527–34. doi:10.1038/ng.357PMID:19396169.
55. Wellcome Trust Case Control C, Craddock N, Hurles ME, Cardin N, Pearson RD, Plagnol V, et al. Genome-wide association study of CNVs in 16,000 cases of eight common diseases and 3,000 shared controls. Nature. 2010; 464(7289):713–20. doi:10.1038/nature08979PMID:20360734; PubMed Cen-tral PMCID: PMC2892339.
56. Ng MC, Hester JM, Wing MR, Li J, Xu J, Hicks PJ, et al. Genome-wide association of BMI in African Americans. Obesity. 2012; 20(3):622–7. doi:10.1038/oby.2011.154PMID:21701570; PubMed Central PMCID: PMC3291470.
57. Chen YG, Siddhanta A, Austin CD, Hammond SM, Sung TC, Frohman MA, et al. Phospholipase D stimulates release of nascent secretory vesicles from the trans-Golgi network. The Journal of cell biol-ogy. 1997; 138(3):495–504. PMID:9245781; PubMed Central PMCID: PMC2141634.
58. Emoto M, Klarlund JK, Waters SB, Hu V, Buxton JM, Chawla A, et al. A role for phospholipase D in GLUT4 glucose transporter translocation. The Journal of biological chemistry. 2000; 275(10):7144–51. PMID:10702282.
59. Gomez-Cambronero J, Keire P. Phospholipase D: a novel major player in signal transduction. Cellular signalling. 1998; 10(6):387–97. PMID:9720761.
60. Everard A, Belzer C, Geurts L, Ouwerkerk JP, Druart C, Bindels LB, et al. Cross-talk between Akker-mansia muciniphila and intestinal epithelium controls diet-induced obesity. Proceedings of the National Academy of Sciences of the United States of America. 2013; 110(22):9066–71. doi:10.1073/pnas. 1219451110PMID:23671105; PubMed Central PMCID: PMC3670398.
61. Galili O, Versari D, Sattler KJ, Olson ML, Mannheim D, McConnell JP, et al. Early experimental obesity is associated with coronary endothelial dysfunction and oxidative stress. American journal of physiol-ogy Heart and circulatory physiolphysiol-ogy. 2007; 292(2):H904–11. doi:10.1152/ajpheart.00628.2006PMID: 17012356.
62. Mantovani A, Bussolino F, Dejana E. Cytokine regulation of endothelial cell function. FASEB journal: official publication of the Federation of American Societies for Experimental Biology. 1992; 6(8):2591–
9. PMID:1592209.
63. DiStasi MR, Ley K. Opening the flood-gates: how neutrophil-endothelial interactions regulate perme-ability. Trends in immunology. 2009; 30(11):547–56. doi:10.1016/j.it.2009.07.012PMID:19783480; PubMed Central PMCID: PMC2767453.
64. Markiewski MM, Lambris JD. The role of complement in inflammatory diseases from behind the scenes into the spotlight. The American journal of pathology. 2007; 171(3):715–27. doi:10.2353/ajpath.2007. 070166PMID:17640961; PubMed Central PMCID: PMC1959484.
65. Samartı́n S, Chandra RK. Obesity, overnutrition and the immune system. Nutrition Research. 21
(1):243–62. doi:10.1016/S0271-5317(00)00255-4
66. Marti A, Marcos A, Martinez JA. Obesity and immune function relationships. Obesity reviews: an official journal of the International Association for the Study of Obesity. 2001; 2(2):131–40. PMID:12119664.