Family-Based Designs: A Universal, Robust Analysis
Approach and an Application to Four Genome-Wide
Association Studies
Sungho Won1,2, Jemma B. Wilk3, Rasika A. Mathias4, Christopher J. O’Donnell5,6, Edwin K. Silverman7,8,9, Kathleen Barnes10, George T. O’Connor11, Scott T. Weiss7,9,12, Christoph Lange9.12,13*
1Department of Statistics, Chung-Ang University, Seoul, Korea,2Research Center for Data Science, Chung-Ang University, Seoul, Korea,3Department of Neurology, Boston University School of Medicine, Boston, Massachusetts, United States of America,4Genometrics Section, Inherited Disease Research Branch, National Human Genome Research Institute, National Institutes of Health, Baltimore, Maryland, United States of America,5National Heart, Lung, and Blood Institute and Framingham Heart Study, Bethesda, Maryland, United States of America,6Cardiology Division, Massachusetts General Hospital, Harvard Medical School, Boston, Massachusetts, United States of America,7Channing Laboratory, Department of Medicine, Brigham and Women’s Hospital, Boston, Massachusetts, United States of America,8Division of Pulmonary and Critical Care Medicine, Brigham and Women’s Hospital, Boston, Massachusetts, United States of America,9Harvard Medical School, Boston, Massachusetts, United States of America,10Department of Medicine, School of Medicine, Johns Hopkins University, Baltimore, Maryland, United States of America,11Pulmonary Center, Boston University School of Medicine, Boston, Massachusetts, United States of America,12Center for Genomic Medicine, Brigham and Women’s Hospital, Boston, Massachusetts, United States of America,13Department of Biostatistics, Harvard School of Public Health, Boston, Massachusetts, United States of America
Abstract
For genome-wide association studies in family-based designs, we propose a new, universally applicable approach. The new test statistic exploits all available information about the association, while, by virtue of its design, it maintains the same robustness against population admixture as traditional family-based approaches that are based exclusively on the within-family information. The approach is suitable for the analysis of almost any trait type, e.g. binary, continuous, time-to-onset, multivariate, etc., and combinations of those. We use simulation studies to verify all theoretically derived properties of the approach, estimate its power, and compare it with other standard approaches. We illustrate the practical implications of the new analysis method by an application to a lung-function phenotype, forced expiratory volume in one second (FEV1) in 4 genome-wide association studies.
Citation:Won S, Wilk JB, Mathias RA, O’Donnell CJ, Silverman EK, et al. (2009) On the Analysis of Genome-Wide Association Studies in Family-Based Designs: A Universal, Robust Analysis Approach and an Application to Four Genome-Wide Association Studies. PLoS Genet 5(11): e1000741. doi:10.1371/ journal.pgen.1000741
Editor:Nicholas J. Schork, University of California San Diego and The Scripps Research Institute, United States of America
ReceivedMay 18, 2009;AcceptedOctober 26, 2009;PublishedNovember 26, 2009
This is an open-access article distributed under the terms of the Creative Commons Public Domain declaration which stipulates that, once placed in the public domain, this work may be freely reproduced, distributed, transmitted, modified, built upon, or otherwise used by anyone for any lawful purpose.
Funding:The CAMP Genetics Ancillary Study is supported by U01 HL075419, U01 HL65899, P01 HL083069, R01 HL086601, and T32 HL07427 from the National Heart, Lung, and Blood Institute, National Institutes of Health. CL is supported by the National Institutes of Health grant R01MH081862. Framingham Heart Study genotype and phenotype data are publicly available through the NHLBI’s SNP Health Association Resource (SHARe) initiative (http://public.nhlbi.nih.gov/ GeneticsGenomics/home/share.aspx). The British 1958 Birth Cohort DNA collection is funded by the Medic Research Council grant G00000934 and the Wellcome Trust grant 068545/Z/02. The funders had no role in study design, data collection and analysis, decision to publish, or preparation of the manuscript.
Competing Interests:The authors have declared that no competing interests exist.
* E-mail: [email protected]
Introduction
During the analysis phase of genome-wide association studies, one is confronted with numerous statistical challenges. One of them is the decision about the ‘‘right’’ balance between maximization of the statistical power and, at the same time, robustness against confounding. In family-based designs, the possible range of analysis options spans from a traditional family-based association analysis [1–4], e.g. TDT, PDT, FBAT, to the application of population-based analysis methods that have been adapted to family-data [1–3]. While, by definition, the first group of approaches is completely immune to population admixture and model misspecification of the phenotype, and can be applied to any phenotype that is permissible in the family-based association testing framework (FBAT [4–6]), the second category of approaches maximizes the statistical power by a
of the approach in which they are tested formally for association with a family-based test. The hybrid approaches can achieve power levels that are similar to approaches in which standard population-based methods are applied to family-data, but the optimal combination of the 2 sources of information (the between-family component and the within-between-family component) is not straightforward in the hybrid approaches.
In this communication, we propose a new family-based association test for genome-wide association studies that combines all sources of information about association, the between and the within-family information, into one single test statistic. The new test is robust against population-admixture even though both components, the between and the within-family components, are used to assess the evidence for association. The approach is applicable to all phenotypes or combinations of phenotypes that can be handled in the FBAT-approach, e.g. binary, continuous, time-to-onset, multivariate, etc [4–6,18]. While the correct model specification for the phenotypes will increase the power of the proposed test statistic, misspecification of the phenotypic model does not affect the validity of the approach. Using extensive simulation studies, we verify the theoretically derived properties of the test statistic, assess its power and compare it with other standard approaches. An application to the Framing heart study (FHS) illustrates the value of the approach in practice. A new genetic locus for the lung-function phenotype, FEV1 (forced expiratory volume in the first second) is discovered and replicated in 3 independent, genome-wide association studies.
Methods
We assume that in a family-based association study,nfamily members have been genotyped atmloci with a genome-wide SNP-chip. For each marker locus, a family-based association test is constructed based on the offspring phenotype and the within-family information. The within-within-family information is defined as the difference between the observed, genetic marker score and the expected, genetic marker score, which is computed conditional upon both the parental genotypes/sufficient statistic [19] under the assumption of Mendelian transmissions. We denote the
family-based association test for theith marker locus byFBATi. Such an FBAT statistic can be the standard TDT, an FBAT for quantitative/qualitative traits, FBAT-GEE for multivariate traits, etc [4,6,18,20,21]. Similarly, for the ith marker, the between-family information can be used to assess the evidence for association at a population-based level by computing a VanS-teen-type [11] ‘‘screening statistic’’ Ti. The screening statistic is computed based on the data for offspring phenotype and the parental genotypes/sufficient statistic. The statistic Ti can be a Wald test for the genetic effect size that is estimated based on the conditional mean model [22], or the estimated power of the family-based testFBATi[23], either of which is feasible. However, while theFBATistatistic is robust against population stratification, the screening statistic Ti is susceptible to confounding. For this reason, the VanSteen-type testing strategies have restrictively used the between-family information as weights for p-values of the
FBAT-statistic, but never as a component in the test statistic itself.
Construction of an overall family-based association test including the population-based and family-based components
In order to construct a family-based association test that incorporates both the within and the between-family information, the Z-statistics that correspond to the p-values ofFBATiandTiare computed. The statisticZa
*
is theaquantile of standard normal
distribution.pFBATiandpTiare the p-value of the FBAT-statistics and one sided p-value of the screening statistic where the direction of the one sided screening statistic is defined by the directionality ofFBATi. Based on the statistical independence ofFBATiandTi [11] under the null-hypothesis, we can obtain an overall family-based association test statisticZiby combining both Z-statistics in a weighted sum,
Zi~wFBATZpFBATi
zw
TZpTi
where the parameterswFBATand wTare standardized weights so that the overall family-based association test Zi has a normal distribution with mean 0 and variance 1, i.e.wFBAT2+wT2= 1. In the literature, this approach of combining two test statistics is known as the Liptak-method [24]. However, the Liptak-method varies here from its standard application in that the 2 test statistics have to be combined so that confounding in the screening statistic
Ticannot affect the validity of the overall family-based association test statisticZi. In the context of a genome-wide association study (GWAS), we are able to achieve this goal by using rank-based p-values for the screening statistic Ti instead of their asymptotic p-values.
The ‘‘screening statistics’’Tiare sorted based on their evidence for association so thatT(m)denotes the screening statistic with the
least amount of evidence for association and T(1) the screening
statistic with the largest amount of evidence for association. The rank-based p-value, (i – 0.5)/m, is then assigned to the ordered screening test statisticsT(i). If there is a tie, then the average of the
ranks will be used for the computation of the rank-based p-value for theith marker. Since the null-hypothesis will be true for the vast majority of the SNPs in a GWAS, the rank-based p-values provide an alternative way to assess the significance of the population-based screening statisticTi. The overall association test Ziis then computed based on the Z-score for the asymptotic p-value of the FBAT-statistic and theZ-score for the ranked-based p-value of the screening statisticTi. In Text S1 we show that the overall association testZimaintains the global significance levela,
under any situations including population admixture and
Author Summary
stratification. This can be understood intuitively as well. The smallest rank-based p-value is 0.5/m. Using the Bonferroni-correction to adjust for multiple testing, the individual, adjusted significance level is a/m which will always be smaller than the
smallest rank-based p-value, 0.5/m, unless the pre-specified global significance levelais great than 0.5. This implies that the overall
family-based association test can never achieve genome-wide significance just based on the rank-based p-values alone. The FBAT-statistic has to contribute evidence for the association as well in order for the overall family-based association test to reach genome-wide significance. Finally, we have to address the specification of the weightswFBATand wT in the overall family-based association test statistic Zi. While any combination of weightswFBATandwTwill provide a valid test statisticZi, the most powerful overall statisticZi is approximately achieved when the ratio of the weights is equal to the ratio of the standardized effect sizes, the expected effect size of the regression coefficient divided by its (estimated) standard deviation. For quantitative traits in unascertained samples, one can show that optimal power levels are achieved for equal weights, i.e.wFBAT=wT. In general, the equal weighting scheme seems to provide good power levels for any disease mode of inheritance and for different trait types, e.g. binary traits, time-to-onset, etc. The theoretical derivation of optimal weighting schemes for such scenarios is ongoing research and will be published subsequently.
Furthermore, it is important to note that, instead of the Liptak-method, Fisher’s method for combining p-values could have been used as well to construct an overall family-based association test which would have the same robustness properties as the overall-test based on the Liptak-method. However, simulation studies (data not shown) suggest that the highest power levels are consistently achieved with the Liptak method. We therefore omit the approach based on Fisher’s method here.
Results
Type I error for 500K GWAS
In the first part of the simulation study, the type-1 error of the proposed family-based association test denoted as LIP was assessed in the absence and in the presence of population admixture, and we use the Wald test based on the conditional mean model [22] with between-family component forpTiin our all simulations. For various scenarios, we verified that the proposed overall family-based association test maintains thea-level.
For simplicity, we assume in the simulation studies that the random samples are given, i.e. no ascertainment, and that the parental genotypes are known. Assuming Hardy-Weinberg equilibrium, the parental genotypes are generated by drawing from Bernoulli distributions defined by the allele frequencies. The offspring genotypes are obtained by simulated Mendelian transmissions from the parents to the offspring. For thejth trio, the offspring phenotypeYjis simulated from a Normal distribution with meanaXjand variance 1, i.e.N(aXj, 1), where the parametera represents the genetic effect size and the variable Xj denotes the offspring genotype. Under the null-hypothesis of no association, the genetic effect size parameterawill be set to 0.
For scenarios in which population admixture is present, we assume that the admixture is created by the presence of 2 subpopulations whose phenotypic means differ by 0.2. The allele frequencies for each marker in the two subpopulations are generated by the Balding-Nichols model [25]. That is, for each marker, the allele frequency in an ancestral population is generated from a uniform distribution between 0.1 and 0.9,
U(0.1, 0.9). Then, the marker allele frequencies for the two
subpopulations are independently sampled from the beta distri-butions (p(12FST)/FST, (12p)(12FST)/FST) for the whole markers in each replicate of the simulated GWAS. A survey reportedFST estimates with a median of 0.008 and 90th percentile of 0.028 among Europeans, and the corresponding values are 0.027 and 0.14 among Africans, and 0.043 and 0.12 among Asians [26]. The value for Wright’sFST was assumed to be 0.05, 0.1, 0.2, or 0.3. Each trio was assigned to the one of the 2 subpopulations with 50% probability.
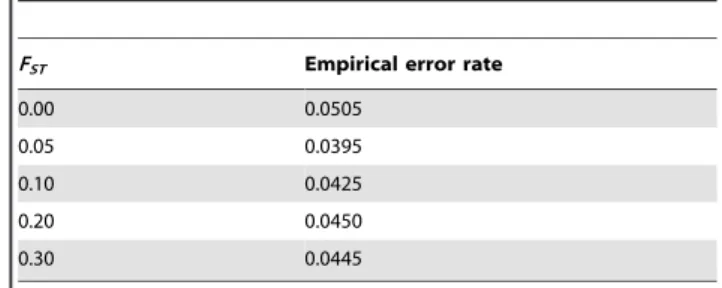
In the absence and presence of the population stratification (FST= 0.05, 0.1, 0.2, and 0.3), Table 1 shows the empirical type-1 error rates of the overall association test statisticZifor a GWAS with 500,000 SNPs. The estimates for the empirical significance levels in Table 1 are based on 2,000 replicates. The empirical genome-wide significance level is calculated as the proportion of replicates for which the minimum p-values among the 500,000 markers is less than 0.05/500,000. We consider the proposed equal weights for wFBAT and wT, for genome-wide significance level 0.05 and Table 1 shows that the type-1 error rate is preserved well. For different significance levels, we calculate in Table 2 the empirical proportions of SNPs for which the overall family-based association testZiis significant at thea-levels of 0.05, 0.01, 1023,
1024 and 1025. The simulation studies are conducted in the absence and in the presence of population admixture. Table 2 does not provide any evidence for a departure of the empirical significance levels from the theoretical levels, both in the absence and presence of population substructure. These results confirm our theoretical conclusions that Zi is robust against population stratification and maintains correct type-1 error.
In the next set of simulation studies, we assess the effects of the local population stratification on the overall family-based associ-ation test. We generate local populassoci-ation stratificassoci-ation under the
Table 1.Empirical type-1 error for 500K GWAS at
genome-wide significance level 0.05.
FST Empirical error rate
0.00 0.0505
0.05 0.0395
0.10 0.0425
0.20 0.0450
0.30 0.0445
The number of trios,Ntrio, is assumed to be 1,000 and the empirical type-1 error of the minimum p-value for GWAS at 500K GWAS is calculated with 2,000 replicates.
doi:10.1371/journal.pgen.1000741.t001
Table 2.Average of empirical proportion at 500K GWAS.
FST c= 561022 c= 1
61022 c= 1
61023 c= 1
61024 c= 1 61025
0.00 5.0061022 9.97
61023 9.91
61024 9.86
61025 9.66 61026 0.05 5.0061022 9.9761023 9.9161024 9.8561025 9.7661026
0.10 5.0061022 9.96
61023 9.88
61024 9.78
61025 9.79 61026 0.20 4.9961022 9.95
61023 9.87
61024 9.76
61025 9.60 61026 0.30 4.9861022 9.92
61023 9.82
61024 9.68
61025 9.40 61026
The number of trios,Ntrio, is assumed to be 1,000 and the empirical proportions of SNPs whose p-values forZiare less thancin each replicate for 500K GWAS are averaged over 2,000 replicates.
following assumptions: there are two subpopulations,G1and G2
which distinguish themselves from each other in 2 marker regions. We assume that a subject can be from all possible 4 combinations at the 2 particular regions, e.g. (G1,G1), (G1,G2), (G2,G1) and (G2, G2). Both regions consist of 10K SNPs and 90K SNPs respectively
and if subjects are from the same subpopulation in each genetic region, their assumed allele frequencies of the markers in the corresponding region are equal. For example, the allele frequen-cies of each marker in the marker region 1 are the same for samples in (G1,G1) and (G1,G2), but they are different for (G1,G1)
and (G2, G2). In the simulation study, we generate the parental
genotypes based on these allele frequency assumptions and obtain the offspring genotypes based on simulated Mendelian transmis-sions. Using the Balding-Nichols model we considered FST’s of 0.001, 0.005, 0.01 and 0.05 in the simulation studies. The offspring’s phenotype was generated under the null hypothesis, but we assumed that each sub-population strata had a different phenotypic mean: 0 for (G1,G1), 0.2 for (G1,G2), 0.4 for (G2,G1)
and 0.6 for (G2, G2). Each replicate consists of 2,000 trios with
equal number of trios for all 4 possible combinations. The data was analyzed with the proposed overall family-based association test and with standard linear regression after adjusting population admixture with EIGENSTRAT [10]. For EIGENSTRAT, we applied the principal component analysis to the mean of the paternal and maternal genotypes at each locus because parents of each offspring are from the same subpopulation, and then the residuals obtained from regressing offspring genotypes and phenotypes with eigenvectors respectively are used to calculate the generalized Armitage trend test [27]. Table 3 provides the empirical type-1 error for both analysis approaches based on 2,000 replicates. While EIGENSTRAT exhibits an inflated type-1 error, the proposed overall family test maintains the theoretical significance level.
Empirical power with simulation for 500K GWA for quantitative trait
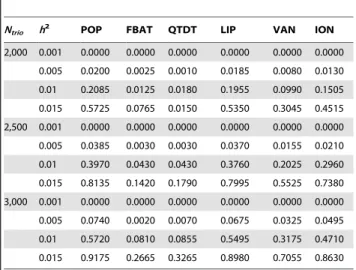
For the analysis of quantitative traits, Table 4 provides the empirical power for 500K GWAS from 2000 replicates when there is no population stratification. Under the assumption of an additive disease model for a quantitative trait, the genetic effect,a, is given as a function of the heritability, h2, the minor allele frequency pDı and the phenotypic variance, s2, by: a=sh/
[2p(12p)(12h2) ]0.5. In the simulation study, we assume
heritabil-ities of h2= 0.001, 0.005, 0.01 and 0.015 for 2,000, 2,500 and 3,000 trios. The allele frequency of the disease locus,pDı, is 0.3 and
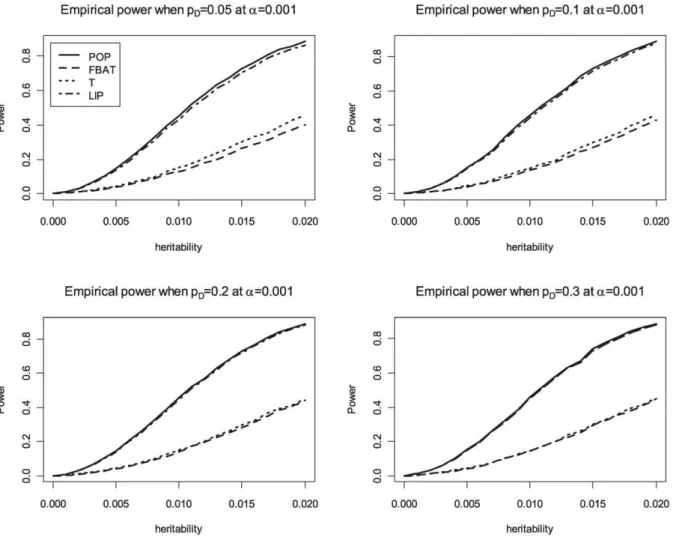
the phenotypic variance is 1. We compare the achieved power levels of the proposed overall family-based association test,Zi, with the weighting approach by Ionita-Laza et al [12], the original VanSteen approach [11], the QTDT approach [28] and population-based analysis, i.e. using linear regression of the phenotypeYon the genotypeX. Bonferroni correction is used to adjust for multiple testing in the population-based analysis, FBAT, QTDT and the proposed method. The results in Table 4 suggest that the proposed association test achieves power levels that represent a major improvement over the existing methods for family-based association tests (VanSteen [11] or Ionita-Laza [12]). Our approach reaches the same power levels as the population-based analysis. For the power comparisons that are shown in Figure 1, Figure 2, and Figure 3, the number of trios is assumed to be 1,000 in 500K GWAS and the empirical powers are calculated based on 10,000 replicates at ana-level of 0.001 for the all genetic
Table 4.Empirical power for GWAS under no population
stratification.
Ntrio h2 POP FBAT QTDT LIP VAN ION
2,000 0.001 0.0000 0.0000 0.0000 0.0000 0.0000 0.0000
0.005 0.0200 0.0025 0.0010 0.0185 0.0080 0.0130
0.01 0.2085 0.0125 0.0180 0.1955 0.0990 0.1505
0.015 0.5725 0.0765 0.0150 0.5350 0.3045 0.4515
2,500 0.001 0.0000 0.0000 0.0000 0.0000 0.0000 0.0000
0.005 0.0385 0.0030 0.0030 0.0370 0.0155 0.0210
0.01 0.3970 0.0430 0.0430 0.3760 0.2025 0.2960
0.015 0.8135 0.1420 0.1790 0.7995 0.5525 0.7380
3,000 0.001 0.0000 0.0000 0.0000 0.0000 0.0000 0.0000
0.005 0.0740 0.0020 0.0070 0.0675 0.0325 0.0495
0.01 0.5720 0.0810 0.0855 0.5495 0.3175 0.4710
0.015 0.9175 0.2665 0.3265 0.8980 0.7055 0.8630
Empirical powers are calculated from 2,000 replicates at the genome-wide significance level 0.05 from Bonferroni method under no population stratification. LIP stands for the proposed method using Liptak method to combinepFBATiandpTi.VAN and ION indicate the VanSteen approach screening top 20 SNPs and Ionita approach using an exponential weighting scheme with partitioning parameters ofK= 7 andr= 2 respectively. FBAT are the results only from the within-family component and POP is the standard population-based method.
doi:10.1371/journal.pgen.1000741.t004
Table 3.Average of empirical proportion at 100K GWAS.
Method FST c= 561022 c= 1
61022 c= 1
61023 c= 1
61024 c= 1 61025
EIGENSTRAT 0.001 5.0761022 1.02
61022 1.04
61023 1.05
61024 1.02 61025
0.005 5.4461022 1.17
61022 1.36
61023 1.72
61024 2.45 61025
0.01 5.8661022 1.39
61022 2.09
61023 3.62
61024 7.57 61025
0.05 8.2061022 3.24
61022 1.32
61022 6.58
61023 3.39 61023
LIP 0.001 5.0061022 9.9961023 9.9361024 9.8961025 9.7061026
0.005 5.0061022 9.99
61023 1.00
61023 1.01
61024 1.00 61025
0.01 5.0061022 9.99
61023 9.97
61024 9.96
61025 9.99 61026 0.05 5.0061022 9.9861023 9.9461024 9.8961025 9.9861026
The number of trios,Ntrio, is assumed to be 1,000. The empirical proportions of SNPs whose p-values forZiare less thancin each replicate for 500K GWAS are averaged over 2000 replicates when there is local population stratification. LIP stands for the proposed method using Liptak method to combinepFBATiandpTi.
models. The results confirm that the Liptak’s method combining
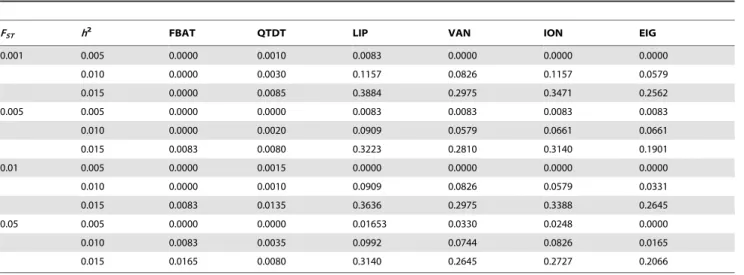
TiandFBATihas similar power to the population-based method, and the choice of equal weights performs well. The simulation results in Table 4 also suggest that QTDT [28] approach achieves similar power levels as the standard FBAT approach, which is consistent with previously reported findings in the literature [29]. However, both standard FBAT and QTDT are still much less powerful than the proposed overall family-based association test. Table 5 shows the empirical power for a GWAS with 100,000 SNPs in the presence of population stratification. For the parameters of this simulation study, we assume FST= 0.001, 0.005, 0.01, and 0.05, and the additive mode of inheritance at the disease locus with values for the heritability ofh2
= 0.005, 0.01 and 0.015. The disease allele frequencypDıin the ancestral population
is assumed to be 0.3. The phenotypic data is simulated so that their phenotypic means for two subpopulations are 0 and 0.2 respectively. Each individual/trio is assigned to either subpopu-lation with probability 0.5. The parental genotypes are used to estimate the ancestry for EIGENSTRAT as before. Various methods have been suggested to adjust the population stratifica-tion in a populastratifica-tion-based designs and we compare the proposed methods with the EIGENSTRAT approach [10]. In order to maximize the power of the proposed method, we apply the EIGENSTRAT approach to the population-based componentTi
of our approach, i.e. principal component analysis based on the parental genotypes and the offspring’s phenotype is integrated into the generalized Armitage test for Ti [27]. To keep the power comparisons unbiased, the population-based components of the approaches by VanSteen and Ionita-Laza are also adjusted for population admixture, using the EIGENSTRAT approach. The results in Table 5 show that the proposed test statistic Zi is considerably more powerful than population-based analysis adjusted with EIGENSTRAT. QTDT is slightly more powerful than FBAT, but it is much less powerful than LIP as is in Table 4. This suggests that EIGENSTRAT should be applied only to between-family component in family-based association studies. Our unpublished work showed that the proposed approach can be less powerful than the combination of population-based analysis and EIGENSTRAT ifpTiis calculated from the conditional mean model [11,22] without adjusting population stratification.
Applications to a genome-wide association in the Framingham Heart study
For the assessment of the severity of pulmonary diseases, the lung volume of air that a subject can blow out within one second after taking a deep breath is an important endo-phenotype. It is referred to as the forced expiratory volume in one second (FEV1). FEV1 is an important measure for lung function and we apply the proposed
Figure 1. Empirical power at 0.001 significance level for additive disease.POP is the empirical power of the standard population-based method. T is the empirical power of the Wald test based on the conditional mean model [22] for between-faimly components. LIP is the empirical power of the combined p-values with Liptak’s method. In this figure, FBAT and T are completely overlapped.
method to a family-based GWAS of FEV1. The proposed method is applied to 550K GWAS Framingham Heart Study (FHS) data set for FEV1, and then we confirm whether the selected SNPs are replicated in the British 1958 Birth Cohort (BBC), another population sample, as well as two samples of asthmatics in the the Childhood Asthma management program (CAMP) [30] and an Afro-Caribbean group of families from Barbados (ACG) [31]. In FHS, 9,274 subjects were genotyped and 10,816 subjects of those had at least one FEV1 measurement. Of the 8637 participants with genotyping and FEV1 measures, only those with a call rate of 97% or higher were included. We adjusted the covariates, age, sex and the quadratic term of height that are known to be associated with FEV1. For within-family components, the FBAT statistic for quantitative trait was applied. Markers were excluded from the analysis if the number of informative families was less than 20, or the minor allele frequency was less than 0.05. In total, 306,264 SNPs were used for analysis and, based on the number of SNPs, rank-based empirical p-values, pTi, and the genome-wide significance level was obtained with Bonferroni correction. When we letnand
ninf be the total number of individuals and the number of informative trios respectively,ninf: (2n2ninf) are used for the weights ofZibecause some of parental phenotypes are available.
Table 6 shows the p-values for the top 10 SNPs from the proposed method. In our analysis, the genome-wide significance
level at 0.05 is 1.63661027and our results show that only the first
ranked SNP, rs805294, is significant at the genome-wide level 0.2 with Bonferroni correction. For rs805294, we also checked the significance in other data sets, BBC, CAMP [30] and ACG [31]. In CAMP, 1215 subjects in 422 families were genotyped and there are 488 informative trios for rs809254 and in ACG, there were only 33 informative trios (Table 7). In the BBC, 1372 unrelated subjects were genotyped with the Affymetrix chip and 1323 unrelated subjects genotyped with the Illumina chip. In CAMP and ACG, age, sex and the quadratic terms of heights were adjusted and in the BBC, age, sex, height, recent chest infection and nurse were adjusted. Table 7 also shows that rs805294 is significant and their directions are same for the considered studies except for the ACG sample. In particular, in the ACG study, the MAF of the SNP is different from other studies, which indicates a different local LD structure; The ACG sample is from an Afro-Caribbean population, contrary to the other studies which only include Caucasian study subjects. In addition, the ACG sample lacks statistical power for this particular SNP, i.e. there are only 33 informative trios in this sample. Thus, the inconsistent finding in the ACG study could be attributable to genetic heterogeneity, i.e. different local LD structure/flip-flop phenomena [32], or insufficient statistical power. For meta analysis, the sample sizes are used as weights for Liptak’s method and we use
Figure 2. Empirical power at 0.001 significance level for dominant disease.POP is the empirical power of the standard population-based method. T is the empirical power of the Wald test based on the conditional mean model [22] for between-faimly components. LIP is the empirical power of the combined p-values with Liptak’s method. In this figure, FBAT and T are completely overlapped.
Figure 3. Empirical power at 0.001 significance level for recessive disease.POP is the empirical power of the standard population-based method. T is the empirical power of the Wald test based on the conditional mean model [22] for between-family components. LIP is the empirical power of the combined p-values with Liptak’s method. In this figure, FBAT and T are completely overlapped.
doi:10.1371/journal.pgen.1000741.g003
Table 5.Empirical power for GWAS under population stratification.
FST h2 FBAT QTDT LIP VAN ION EIG
0.001 0.005 0.0000 0.0010 0.0083 0.0000 0.0000 0.0000
0.010 0.0000 0.0030 0.1157 0.0826 0.1157 0.0579
0.015 0.0000 0.0085 0.3884 0.2975 0.3471 0.2562
0.005 0.005 0.0000 0.0000 0.0083 0.0083 0.0083 0.0083
0.010 0.0000 0.0020 0.0909 0.0579 0.0661 0.0661
0.015 0.0083 0.0080 0.3223 0.2810 0.3140 0.1901
0.01 0.005 0.0000 0.0015 0.0000 0.0000 0.0000 0.0000
0.010 0.0000 0.0010 0.0909 0.0826 0.0579 0.0331
0.015 0.0083 0.0135 0.3636 0.2975 0.3388 0.2645
0.05 0.005 0.0000 0.0000 0.01653 0.0330 0.0248 0.0000
0.010 0.0083 0.0035 0.0992 0.0744 0.0826 0.0165
0.015 0.0165 0.0080 0.3140 0.2645 0.2727 0.2066
The number of trios,Ntrio, is assumed to be 1,000. Empirical powers are calculated from 2,000 replicates at the genome-wide significance level 0.05 from Bonferroni method under no population stratification. LIP stands for the proposed method using Liptak method to combinepFBATiandpTi. VAN and ION indicate the VanSteen approach selecting top 20 SNP and Ionita approach using an exponential weighting scheme with partitioning parameters ofK= 5 andr= 2 respectively. FBAT indicates the empirical power only fromFBATiand EIG indicates the empirical power from EIGENSTRAT.
13:13:5:1 = FHS:BBC:CAMP:ACG as weights because the be-tween-family information is used only for FHS. If the p-value from Illumina gene chip in BBC and the p-values from FHS, CAMP and ACG are combined, then the p-values by Liptak’s method using proposed weights and Fisher’s method are 1.53461028and
1.08161027 respectively, and they become 4.62561029 and
3.55461028if the p-values from one-tailed tests are used for BBC,
CAMP and ACG with the same direction of FHS. If the p-value from the Affymetrix gene chip in BBC is combined with the other studies, then they are 3.78761028 (Liptak’s method) and
1.89061027 (Fisher’s method) for two-tailed tests, and
1.09861028(Liptak’s method) and 6.23661028(Fisher’s method)
for one-tailed tests. As a result we can conclude that rs805294 is significantly associated with FEV1 at a genome-wide scale and the gene, LY6G6C, associated with rs805293 will be investigated in further studies.
Discussion
Genome-wide association studies have become one of the most important tools for the identification of new disease loci in the human genome. However, even though advances in genotyping technology have enabled a new generation of genetic association studies that provide robust and replicable findings, population stratification/genetic heterogeneity and the multiple testing problems continue to be the major issues in the statistical analysis that have to be resolved in each study. While family-based association tests provide analysis results that are completely robust against confounding due to population-substructures, the
analysis approach is not optimal in terms of statistical power. Numerous approaches have been suggested to minimize this disadvantage of family-based association tests but the previous approaches had to compromise either in terms of robustness or in terms of efficiency.
In this communication, we develop an approach that efficiently utilizes all available data, while maintaining complete robustness against confounding due to population substructure. The proposed methods combines the p-values of the family-based tests (the within-component) with the rank-based p-values for population-based analysis (the between component) to achieve optimal power levels. The use of rank-based p-values for the population-based component is similar in spirit to the genomic control approach. In principle, the genomic control functions as rescaling the variance inflated due to population stratification under the assumption of the constantFST. Rank-based p-value directly rescales the statistics based on their ranks, which always generates the uniformly distributed p-value and provides validity even for varyingFSTdue to local population stratification etc.
Although our simulations are limited to independent unascer-tained samples and quantitative traits, the proposed work can be easily extended to ascertained samples, large pedigree, or different trait types, etc. By replacing the parental genotypes with the sufficient statistics by Rabinowitz&Laird [19], the FBAT-statistic and the screening-statistic can be adopted straight-forwardly to designs with extended pedigrees [23]. Similarly, parental pheno-types can be incorporated into the conditional mean model [23] or its non-parametric extensions [33] as additional outcome vari-ables. The optimal weights can vary between the different
Table 6.Applications to forced expiratory volume in one second in Framingham Heart study.
SNP Chrom Position MAF Num. Info. Fam. FBATi pTi Zi
rs805294 6 31796196 0.340 918 4.30061023 2.073
61025 5.929 61027
rs10863838 1 208750806 0.450 1016 7.40861025 2.535
61023 2.553 61026
rs6794842 3 119308208 0.331 950 3.22661022 2.400
61025 6.654 61026
rs804963 14 85918211 0.460 1031 9.78661022 2.775
61026 7.060 61026
rs525914 11 119200660 0.187 711 9.20461024 1.88861023 2.08161025
rs1886280 10 89347496 0.362 971 1.79761022 2.297
61024 2.511 61025
rs710469 3 188467212 0.491 1058 3.20261023 1.388
61023 2.639 61025
rs10799746 1 22497833 0.168 651 1.38861022 3.53861024 2.74861025
rs1225888 20 15972225 0.449 1007 7.51861025 1.736
61022 2.994 61025
rs4638547 15 71122046 0.377 999 3.45461025 2.760
61022 3.549 61025
The number of markers is 306,264 and the genome-wide significance level at 0.05 is 1.63661027. The top 10 SNPs fromZ
iare selected, assuming additive disease mode of inheritance. ForpTi, the estimated powers are used and the weights for LIP are calculated with the number of informative trios.
doi:10.1371/journal.pgen.1000741.t006
Table 7.Descriptive statistics and results of rs805294 in different studies.
FHS British Cohort CAMP BAR
Affy Illumina
Num. Info. Fam. 918 - - 488 33
Sample Size - 1372 1323 -
-MAF 0.34 0.36 0.36 0.33 0.22
P-values 25.92961027
21.23461022
26.53461023
21.37061022 7.84 61021
scenarios and further theoretical investigation is currently ongoing, but limited initial simulation studies suggest that equal weights, while not always the most powerful choice in such situation, will always result in more powerful analysis than currently used methods.
Supporting Information
Text S1 The validity of the proposed method.
Found at: doi:10.1371/journal.pgen.1000741.s001 (0.04 MB DOC)
Acknowledgments
Framingham Heart Study genotype and phenotype data are publicly available through the NHLBI’s SNP Health Association Resource (SHARe) initiative (http://public.nhlbi.nih.gov/GeneticsGenomics/
home/share.aspx). We acknowledge the CAMP investigators and research team for collection of CAMP Genetic Ancillary Study data and use of genotype data from the British 1958 Birth Cohort DNA collection. We further acknowledge the families in Barbados for their generous participation in this study. We are grateful to Drs. Raana Naidu, Paul Levett, Malcolm Howitt and Pissamai Maul, Trevor Maul, and Bernadette Gray for their contributions in the field; Dr. Malcolm Howitt and the Polyclinic and A&E Department physicians in Barbados for their efforts and their continued support; as well as Drs. Henry Fraser and Anselm Hennis at the Chronic Disease Research Centre.
Author Contributions
Conceived and designed the experiments: SW CL. Performed the experiments: SW. Analyzed the data: SW JBW RM CJO EKS KB GTO STW. Contributed reagents/materials/analysis tools: SW. Wrote the paper: SW CL.
References
1. Aulchenko YS, de Koning DJ, Haley C (2007) Genomewide rapid association using mixed model and regression: a fast and simple method for genomewide pedigree-based quantitative trait loci association analysis. Genetics 177: 577–585.
2. Chen WM, Abecasis GR (2007) Family-based association tests for genomewide association scans. Am J Hum Genet 81: 913–926.
3. Elston RC, Gray-McGuire C (2004) A review of the ‘Statistical Analysis for Genetic Epidemiology’ (S.A.G.E.) software package. Hum Genomics 1: 456–459.
4. Lange C, Blacker D, Laird NM (2004) Family-based association tests for survival and times-to-onset analysis. Stat Med 23: 179–189.
5. Laird NM, Horvath S, Xu X (2000) Implementing a unified approach to family-based tests of association. Genet Epidemiol 19 Suppl 1: S36–42.
6. Lange C, Silverman EK, Xu X, Weiss ST, Laird NM (2003) A multivariate family-based association test using generalized estimating equations: FBAT-GEE. Biostatistics 4: 195–206.
7. Devlin B, Roeder K (1999) Genomic control for association studies. Biometrics 55: 997–1004.
8. Devlin B, Roeder K, Wasserman L (2001) Genomic control, a new approach to genetic-based association studies. Theor Popul Biol 60: 155–166.
9. Pritchard JK, Stephens M, Donnelly P (2000) Inference of population structure using multilocus genotype data. Genetics 155: 945–959.
10. Price AL, Patterson NJ, Plenge RM, Weinblatt ME, Shadick NA, et al. (2006) Principal components analysis corrects for stratification in genome-wide association studies. Nat Genet 38: 904–909.
11. Van Steen K, McQueen MB, Herbert A, Raby B, Lyon H, et al. (2005) Genomic screening and replication using the same data set in family-based association testing. Nat Genet 37: 683–691.
12. Ionita-Laza I, McQueen MB, Laird NM, Lange C (2007) Genomewide weighted hypothesis testing in family-based association studies, with an application to a 100K scan. Am J Hum Genet 81: 607–614.
13. Murphy A, Weiss ST, Lange C (2008) Screening and replication using the same data set: testing strategies for family-based studies in which all probands are affected. PLoS Genet 4: e1000197. doi:10.1371/journal.pgen.1000197. 14. Nagelkerke NJ, Hoebee B, Teunis P, Kimman TG (2004) Combining the
transmission disequilibrium test and case-control methodology using generalized logistic regression. Eur J Hum Genet 12: 964–970.
15. Epstein MP, Veal CD, Trembath RC, Barker JN, Li C, et al. (2005) Genetic association analysis using data from triads and unrelated subjects. Am J Hum Genet 76: 592–608.
16. Chen YH, Lin HW (2008) Simple association analysis combining data from trios/sibships and unrelated controls. Genet Epidemiol 32: 520–527. 17. Zhu X, Li S, Cooper RS, Elston RC (2008) A unified association analysis
approach for family and unrelated samples correcting for stratification. Am J Hum Genet 82: 352–365.
18. Lange C, DeMeo DL, Laird NM (2002) Power and design considerations for a general class of family-based association tests: quantitative traits. Am J Hum Genet 71: 1330–1341.
19. Rabinowitz D, Laird N (2000) A unified approach to adjusting association tests for population admixture with arbitrary pedigree structure and arbitrary missing marker information. Hum Hered 50: 211–223.
20. Spielman RS, Ewens WJ (1998) A sibship test for linkage in the presence of association: the sib transmission/disequilibrium test. Am J Hum Genet 62: 450–458.
21. Lange C, Laird NM (2002) On a general class of conditional tests for family-based association studies in genetics: the asymptotic distribution, the conditional power, and optimality considerations. Genet Epidemiol 23: 165–180. 22. Lange C, Lyon H, DeMeo D, Raby B, Silverman EK, et al. (2003) A new
powerful non-parametric two-stage approach for testing multiple phenotypes in family-based association studies. Hum Hered 56: 10–17.
23. Lange C, DeMeo D, Silverman EK, Weiss ST, Laird NM (2003) Using the noninformative families in family-based association tests: a powerful new testing strategy. Am J Hum Genet 73: 801–811.
24. Liptak T (1958) On the combination of independent tests. Magyar Tud Akad Mat Kutato’ IntKo’’zl 3: 171.
25. Balding DJ, Nichols RA (1995) A method for quantifying differentiation between populations at multi-allelic loci and its implications for investigating identity and paternity. Genetica 96: 10.
26. Cavalli-Sforza LL, Piazza A (1993) Human genomic diversity in Europe: a summary of recent research and prospects for the future. Eur J Hum Genet 1: 16.
27. Armitage P (1955) Tests for linear trends in proportions and frequencies. Biometrics 11: 375–386.
28. Abecasis GR, Cardon LR, Cookson WO (2000) A general test of association for quantitative traits in nuclear families. Am J Hum Genet 66: 279–292. 29. Diao G, Lin DY (2006) Improving the power of association tests for quantitative
traits in family studies. Genet Epidemiol 30: 301–313.
30. (1999) The Childhood Asthma Management Program (CAMP): design, rationale, and methods. Childhood Asthma Management Program Research Group. Control Clin Trials 20: 91–120.
31. Barnes KC, Neely JD, Duffy DL, Freidhoff LR, Breazeale DR, et al. (1996) Linkage of asthma and total serum IgE concentration to markers on chromosome 12q: evidence from Afro-Caribbean and Caucasian populations. Genomics 37: 41–50.
32. Lin PI, Vance JM, Pericak-Vance MA, Martin ER (2007) No gene is an island: the flip-flop phenomenon. Am J Hum Genet 80: 531–538.