Genes in a Genome-Wide Association Study of African
American Diabetic Kidney Disease
Nicholette D. Palmer1,2,3*, Maggie C. Y. Ng2,3, Pamela J. Hicks1, Poorva Mudgal3, Carl D. Langefeld4, Barry I. Freedman2,3,5, Donald W. Bowden1,2,3,5
1Department of Biochemistry, Wake Forest School of Medicine, Winston-Salem, North Carolina, United States of America,2Center for Genomics and Personalized Medicine Research, Wake Forest School of Medicine, Winston-Salem, North Carolina, United States of America,3Diabetes Research Center, Wake Forest School of Medicine, Winston-Salem, North Carolina, United States of America,4Center for Public Health Genomics and Department of Biostatistical Sciences, Wake Forest School of Medicine, Winston-Salem, North Carolina, United States of America,5Department of Internal Medicine, Wake Forest School of Medicine, Winston-Salem, North Carolina, United States of America
Abstract
Type 2 diabetes (T2D)-associated end-stage kidney disease (ESKD) is a complex disorder resulting from the combined influence of genetic and environmental factors. This study contains a comprehensive genetic analysis of putative nephropathy loci in 965 African American (AA) cases with T2D-ESKD and 1029 AA population-based controls extending prior findings. Analysis was based on 4,341 directly genotyped and imputed single nucleotide polymorphisms (SNPs) in 22 nephropathy candidate genes. After admixture adjustment and correction for multiple comparisons, 37 SNPs across eight loci were significantly associated (1.6E-05,Pemp,0.049). Among these, variants inMYH9were the most significant
(1.6E-05,Pemp,0.049), followed by additional chromosome 22 loci (APOL1,SFI1, andLIMK2). Nominal signals were observed in AGTR1,RPS12,CHN2 and CNDP1. Additional adjustment forAPOL1 G1/G2 risk variants attenuated association at MYH9
(Pemp= 0.00026–0.043) while marginally improving significance of other APOL1SNPs (rs136161, rs713753, and rs767855;
Pemp= 0.0060–0.037); association at other loci was markedly reduced except forCHN2(chimerin; rs17157914, Pemp= 0.029).
In addition, SNPs in other candidate loci (FRMD3andTRPC6) trended toward association with T2D-ESKD (Pemp,0.05). These
results suggest that risk contributed by putative nephropathy genes is shared across populations of African and European ancestry.
Citation:Palmer ND, Ng MCY, Hicks PJ, Mudgal P, Langefeld CD, et al. (2014) Evaluation of Candidate Nephropathy Susceptibility Genes in a Genome-Wide Association Study of African American Diabetic Kidney Disease. PLoS ONE 9(2): e88273. doi:10.1371/journal.pone.0088273
Editor:Giuseppe Remuzzi, Mario Negri Institute for Pharmacological Research and Azienda Ospedaliera Ospedali Riuniti di Bergamo, Italy
ReceivedSeptember 5, 2013;AcceptedJanuary 9, 2014;PublishedFebruary 13, 2014
Copyright:ß2014 Palmer et al. This is an open-access article distributed under the terms of the Creative Commons Attribution License, which permits
unrestricted use, distribution, and reproduction in any medium, provided the original author and source are credited.
Funding:Genotyping services were provided by the Center for Inherited Disease Research (CIDR), which is fully funded through a federal contract from the National Institutes of Health (NIH) to The Johns Hopkins University, contract number HHSC268200782096C. This work was supported by NIH grants K99 DK081350 (NDP), R01 DK066358 (DWB), R01 DK053591 (DWB), R01 HL56266 (BIF), R01 DK 070941 (BIF), R01 DK 084149 (BIF) and in part by a grant from the General Clinical Research Center of the Wake Forest School of Medicine, M01 RR07122. The funders had no role in study design, data collection and analysis, decision to publish, or preparation of the manuscript.
Competing Interests:Nicholette D. Palmer is currently an Academic Editor at PLoS One. This does not alter the authors’ adherence to all the PLoS ONE policies on sharing data and materials.
* E-mail: nallred@wakehealth.edu
Introduction
Diabetes-associated kidney disease (DKD) is the most common cause of nephropathy in western societies, present in approxi-mately 40% of patients with type 2 diabetes (T2D) [1]. Patients with DKD account for half of the incident cases of end-stage kidney disease (ESKD) in the United States. T2D-ESKD is a devastating complication with five year survivals in the range of 30% [2]. Current trends suggest that the prevalence of DKD will continue to increase [1] constituting a significant socioeconomic burden on the healthcare system and resulting in increased morbidity and mortality.
T2D-ESKD is a complex disorder resulting from genetic and environmental factors [reviewed in [3]]. Among population groups, African Americans have the highest incidence and prevalence and the rate of new ESKD cases has grown by 7.0% since 2000 [2]. In contrast to risk for non-diabetic ESKD
in African Americans, which is powerfully associated with genetic variants in the apolipoprotein L1 gene (APOL1; [4]), evidence to date suggests that T2D-ESKD has multi-factorial genetic risk.
Results
Clinical Characteristics of Study Samples
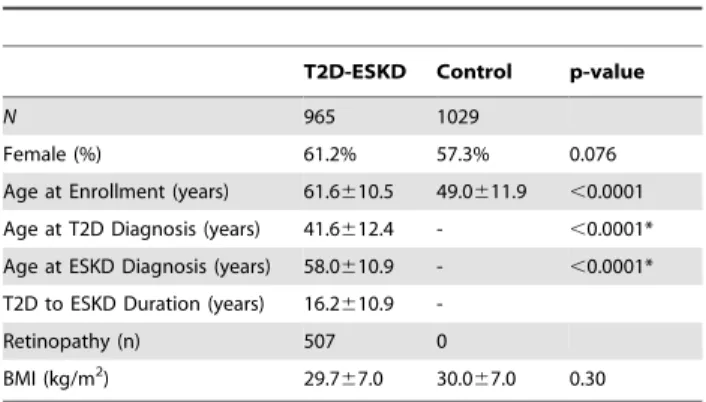
The clinical characteristics of study participants included in the GWAS are shown inTable 1. T2D-ESKD cases tended to have a higher proportion of females (P = 0.076), possibly reflecting the increased prevalence of T2D among African American women [6], participation bias, and survival. In addition, the age at enrollment for T2D-ESKD subjects is older than that for the control groups (P,0.0001); however, the age at enrollment for the control groups is older than the age of T2D diagnosis in T2D-ESKD subjects (P,0.0001). Notably, the use of population-based controls has not precluded the identification of trait associations in other investigations (e.g. [7]). Both cases and controls were overweight or obese at the time of enrollment (P = 0.30).
GWAS
A total of 832,357 directly genotyped autosomal SNPs passed quality control and were tested for association in 965 T2D-ESKD cases and 1029 controls lacking T2D and ESKD. Only a modest increase in the inflation factor was noted with inclusion of related individuals (1.04 versus 1.06) therefore, cryptic first degree relatives (n = 54) were retained in the analysis. In addition,
.2.28 million SNPs were imputed from HapMap II release 22. Results from twenty-two T2D-DKD candidate loci with 10 kb flanking sequence upstream and downstream (n = 4333 SNPs; Table S1) were selected for subsequent analysis.
T2D-ESKD Candidate Loci
We defined T2D-ESKD candidate loci as genes which have been implicated in ESKD (diabetes associated or non-diabetes associated) either through direct (e.g. CNDP1, APOL1) genetic analysis or through compelling functional relationships (e.g.REN). In addition, candidates highlighted from a previous genome-wide association study (GWAS) of T2D-ESKD in this African American population [5] were included (i.e. RPS12, LIMK2, and SFI1). Analysis of the twenty two loci (n = 4333 SNPs) using PC1 as a covariate revealed nominal association (P,0.05) at 20 loci (n = 382 SNPs; Table S1 and Figure S1). Correction for multiple comparisons using the number of independent tests at each locus identified eight loci (38 SNPs) with empiric p-values less than 0.05 (Pemp,0.05; Table 2). The most significant signal (rs5750250, Pemp= 1.6E-05, OR (95% CI) = 0.72 (0.63–0.81)) was observed in
intron 13 of the non-muscle myosin heavy chain 9 (MYH9) gene. Of the 157 SNPs evaluated inMYH9resulting in 56 independent SNPs, 12 SNPs had Pemp,0.05 and were modestly correlated
(0.02,r2,0.89;Figure S2). Association was also observed with three additional loci on chromosome 22: apolipoprotein L1 (APOL1; Pemp= 0.0068–0.045; 0.03,r2,0.82,Figure S2), LIM
domain kinase 2 (LIMK2; Pemp= 0.020–0.024; r 2
.0.99,FigureS 2), and Sfi1 homolog (SFI1; Pemp= 0.044). Among other significant
loci, two SNPs (rs9493454 and rs7769051; r2= 0.67) in the ribosomal protein S12 (RPS12) gene were associated with T2D-ESKD (Pemp= 0.0071 and 0.0083, respectively). Imputation
revealed two SNPs (rsq.0.90) in moderate LD (r2= 0.49) located in the cytosol nonspecific dipeptidase 1 (CNDP1) gene which remained significant after correction for 45 effective SNPs tested (rs4892249, Pemp= 0.043 and rs6566815, Pemp= 0.0076).
Addi-tionally, nominal signals were observed at the angiotensin II receptor type 1 (AGTR1; Pemp= 0.018) and chimerin 2 (CHN2;
Pemp,0.044; 0.00,r2,0.05) genes.
T2D-ESKD Candidate Loci with Adjustment for APOL1 G1 and G2 Variants
Adjustment for the APOL1 G1 and G2 nephropathy risk variants [4] marginalized but did not abolish the significant evidence of associations observed at three loci (Pemp,0.048; n = 5 SNPs; Table 3). The strongest signal observed was located downstream of theCNDP1gene (rs6566815, Pemp= 0.011). Three
signals of association were observed at the CHN2 locus (rs17157914, Pemp= 0.026; rs3793313, Pemp= 0.043;
rs17157908, Pemp= 0.048). Two of these signals, which were
highly correlated (rs17157908 and rs17157914, r2= 0.94),
emerged only after adjustment forAPOL1 G1/G2 (rs17157914, Pemp= 0.091 and rs17157908, Pemp= 0.14 prior toAPOL1G1/G2
adjustment) while the initial signal at rs3793313 maintained the same level of significance (Pemp= 0.043). The previous single signal
of association observed in theAGTR1gene remained significant (rs12695897, Pemp= 0.032) after accounting for the effects at the
APOL1 locus. In contrast, the previously observed significant association in the MYH9 gene was abolished (rs5750250, Pemp= 0.20) as were other signals observed on chromosome 22
(Pemp.0.099).
Discussion
The goal of this study was to perform a detailed genetic analysis of reported ESKD susceptibility genes in a large African American cohort. Previous studies have been few in number and limited in scope focusing on divergent populations and evaluating relatively few variants by modern day standards. Advantages of this study include a comprehensive evaluation of genetic variation at each susceptibility locus using directly genotyped and imputed SNPs in analysis. In addition, this study uses a single population in which to compare and contrast findings from all reported loci.
After correction for the effective number of variants tested at each locus (Table 2), we identified eight susceptibility loci as nominally associated with T2D-ESKD. Examination of the risk allele burden of these variants (n = 37) in the eight loci revealed an increased risk allele burden (P,0.0001) with cases, on average, carrying 50.2 risk alleles while controls carried 47.0 (data not shown). The most significant signal was observed at theMYH9
locus (rs5750250, Pemp= 1.6E-05) although this signal was
abolished (Pemp= 0.20) after adjustment for the APOL1 G1/G2
risk alleles. While this finding could be attributed to the potential inclusion of non-diabetic ESKD cases samples, the vast majority (.74%) of the case population had a duration of T2D greater than 5 years before initiating renal replacement therapy. Notably, this variant was the most significant SNP from our T2D-ESKD GWAS [5] despite inclusion of additional imputed variants to
Table 1.Clinical Characteristics of Study Participants.
T2D-ESKD Control p-value
N 965 1029
Female (%) 61.2% 57.3% 0.076
Age at Enrollment (years) 61.6610.5 49.0611.9 ,0.0001
Age at T2D Diagnosis (years) 41.6612.4 - ,0.0001*
Age at ESKD Diagnosis (years) 58.0610.9 - ,0.0001*
T2D to ESKD Duration (years) 16.2610.9
-Retinopathy (n) 507 0
BMI (kg/m2) 29.7
67.0 30.067.0 0.30
increase coverage in the current study, i.e. GWAS coverage of
MYH9with an r2.0.73 with 46 of 166 SNPs versus GWAS and imputed data coverage ofMYH9with an r2.0.99 with 156 of 166 SNPs. SNP rs5750250 lies within the genomic interval spanned by the four SNPs (rs4821480, rs2032487, rs4821481, and rs3752462) composing the E1 risk haplotype [8] however, individually none of
these variants were associated with T2D-ESKD (Pemp.0.53). Interestingly, evidence of association at the APOL1 locus was reduced in comparison toMYH9(Pemp,0.045) despite impressive associations previously observed with kidney disease in African Americans [4]. These results suggest that kidney disease, in general, is a heterogeneous class of diseases, consistent with the
Table 2.Association of Candidate Diabetic Kidney Disease Loci with T2D-ESKD.
SNP Position1 Gene Eff2 RA3 OR4 95% CI5 P
Add6 Pemp7
rs12695897 3:149927874 AGTR1 40 T 0.58 0.43–0.79 0.00046 0.018
rs9493454 6:133186322 RPS12 13 C 1.25 1.10–1.42 0.00055 0.0071
rs7769051 6:133188489 RPS12 13 A 1.26 1.10–1.44 0.00063 0.0083
rs3793313 7:29272298 CHN2 194 T 1.40 1.17–1.68 0.00023 0.044
rs2057737 7:29385620 CHN2 194 A 1.79 1.32–2.44 0.00020 0.038
rs3729621* 7:29487958 CHN2 194 G 1.57 1.24–1.99 0.00019 0.037
rs4892249* 18:70404575 CNDP1 45 G 1.25 1.09–1.42 0.00095 0.043
rs6566815* 18:70406087 CNDP1 45 T 1.31 1.14–1.51 0.00017 0.0076
rs2413035 22:29930460 LIMK2 20 T 0.60 0.44–0.82 0.0012 0.024
rs737888* 22:29941549 LIMK2 20 A 0.60 0.44–0.81 0.00099 0.020
rs5753521* 22:29968027 LIMK2 20 T 0.60 0.44–0.81 0.00099 0.020
rs2283879* 22:29968448 LIMK2 20 G 0.60 0.44–0.81 0.00099 0.020
rs2106294 22:29975759 LIMK2 20 C 0.60 0.44–0.81 0.00099 0.020
rs4820043 22:29977094 LIMK2 20 A 0.60 0.44–0.81 0.00099 0.020
rs2078803* 22:29982852 LIMK2 20 G 0.60 0.44–0.81 0.00099 0.020
rs2073857* 22:29988281 LIMK2 20 A 0.60 0.44–0.81 0.00099 0.020
rs737684* 22:29989827 LIMK2 20 C 0.60 0.44–0.81 0.00099 0.020
rs4141404* 22:30005185 LIMK2 20 A 0.60 0.44–0.81 0.00099 0.020
rs1858821* 22:30006454 LIMK2 20 T 0.60 0.44–0.81 0.00099 0.020
rs2040533* 22:30009110 LIMK2 20 G 0.60 0.44–0.81 0.00099 0.020
rs5753543* 22:30015458 LIMK2 20 G 0.60 0.44–0.81 0.0012 0.023
rs5749286 22:30230359 SFI1 27 A 0.62 0.46–0.84 0.0016 0.044
rs136161 22:34987378 APOL1 9 C 0.77 0.67–0.90 0.00076 0.0068
rs713753 22:34988480 APOL1 9 T 0.79 0.67–0.92 0.0032 0.029
rs767855* 22:35002241 APOL1 9 T 0.68 0.52–0.89 0.0050 0.045
rs735853 22:35009161 MYH9 56 G 0.68 0.55–0.84 0.00034 0.019
rs6000229 22:35016105 MYH9 56 T 0.75 0.66–0.86 2.3E-05 0.0013
rs2071730* 22:35019972 MYH9 56 C 0.79 0.69–0.91 0.00087 0.049
rs16996648 22:35022698 MYH9 56 C 1.29 1.12–1.48 0.00028 0.016
rs4821480* 22:35025193 MYH9 56 T 0.73 0.64–0.84 5.1E-06 0.00029
rs4821481* 22:35025888 MYH9 56 T 0.73 0.64–0.84 4.8E-06 0.00027
rs5750248* 22:35032838 MYH9 56 C 0.74 0.65–0.85 7.7E-06 0.00043
rs1557529* 22:35035475 MYH9 56 A 1.35 1.17–1.56 4.1E-05 0.0023
rs2157256 22:35037607 MYH9 56 G 0.80 0.70–0.91 0.00085 0.048
rs5750250 22:35038429 MYH9 56 A 0.72 0.63–0.81 2.9E-07 1.6E-05
rs5756152* 22:35042418 MYH9 56 A 1.39 1.17–1.64 0.00015 0.0086
rs2239784* 22:35044581 MYH9 56 C 0.73 0.61–0.87 0.00049 0.027
1hg18;
2Eff, effective number of SNPs per locus; 3RA, reference allele;
4OR, odds ratio;
595% CI, 95% confidence interval; 6P
Add, additive p-value; 7P
emp, empiric p-value;
*imputed SNPs.
observation of differential odds ratios (ORs) reported forAPOL1in HIV-associated nephropathy (OR = 29), focal segmental glomer-ulosclerosis (FSGS; OR = 17) and hypertension-attributed end-stage kidney disease (H-ESKD; OR = 7.3) [4,9].
The most significant signal of association observed after adjustment for the APOL1 G1/G2 variants was rs6566815 (Pemp= 0.011; Table 3) which lies 2.8 kb downstream of the
CNDP1locus on chromosome 18. This region has been linked to DKD in multiple populations [10,11,12], and CNDP1 was later implicated as the basis of the linkage peak [13]. In addition, a single variant on chromosomes 3 in theAGTR1gene was observed to be associated with T2D-ESKD (rs12695897, Pemp= 0.032). The
angiotensin II receptor type 1 gene product is an interesting biological candidate involved in the renin-angiotensin system (reviewed in [14]). Among 98 genotyped and imputed SNPs tested (40 effective tests), only the imputed SNP rs12695897 remained nominally associated. rs12695897 was a low frequency variant (MAF = 0.05) with good imputation quality (rsq = 0.95) which would have been missed without imputation since it was omitted from current GWAS arrays. The remaining three signals that survived multiple comparisons correction and adjustment for
APOL1 were located in the CHN2 gene. The initial variant (rs3793313) observed in the PC-adjusted analysis remained significant and two additional correlated variants (rs17157908 and rs17157914) increased in significance. This locus has been reported to be modestly associated with DKD in European-derived studies of type 1 diabetes [15] however, their seminal SNP rs39059 was not associated in our analysis (Pemp= 0.61).
Despite improvements in coverage afforded through imputa-tion, this GWAS is not without limitations. A primary limitation related to study design is the inclusion of 965 T2D-ESKD cases and 1029 population-based controls. While it is possible that T2D variants would be identified, in practice this has not been the case [5,16]. This study had.80% power to detect common variants (MAF.0.10) with a detectable OR of 1.33, consistent with common disease, when considering a significance threshold of 0.05 (Table S2). An advantage of our study design is the focus on loci with a priori evidence of association thus limiting the need for more stringent genome-wide significance thresholds. Although this study included evaluation of putative T2D-ESKD susceptibility loci that were identified within the same dataset, the current analyses extend those findings by increasing coverage and as was observed withCHN2, increased the number of variants observed
with association. Related to the analytical approach, the current analysis is derived from imputation using the HapMap Phase II reference panel. Recent technological advancements have lead the way for development of more superior reference panels that allow for a more comprehensive imputation of variants across the allele spectrum. As such, these additional low frequency variants may contribute to the underlying genetic architecture of disease and deserve further evaluation in larger sample sets that are more adequately powered to examine their contribution.
In conclusion, we performed a detailed genetic analysis of T2D-ESKD susceptibility genes identified from literature searches in a large African American cohort. This study demonstrates the need for more comprehensive genotyping arrays, especially in the African American population, and confirms the utility of imputation to increase coverage in existing datasets. These findings support the hypothesis that genetic variation contributes to risk of T2D-ESKD through the combined impact of multiple genetic variants contributing modest individual risk.
Methods
Ethics Statement
Recruitment and sample collection procedures were approved by the Institutional Review Board at Wake Forest School of Medicine. Written informed consent was obtained from all study participants.
Clinical Characteristics of Study Samples
This cross-sectional case-control study was designed to examine the genetics of T2D and ESKD in African Americans [5]. Patients with T2D-ESKD were recruited from dialysis facilities. T2D was diagnosed in African Americans who reported developing T2D after the age of 25 years and did not receive only insulin therapy since diagnosis. In addition, cases had at least one of the following three criteria for inclusion: a) T2D diagnosed at least 5 years before initiating renal replacement therapy, b) background or greater diabetic retinopathy by self-report and/or c)$100 mg/dl proteinuria on urinalysis in the absence of other causes of nephropathy. Unrelated African American controls without a current diagnosis of diabetes or renal disease were recruited from the community and internal medicine clinics. All T2D-ESKD cases and controls lacking T2D and ESKD were born in North Carolina, South Carolina, Georgia, Tennessee or Virginia. DNA
Table 3.Association of Candidate Diabetic Kidney Disease Loci with T2D-ESKD after Adjustment forAPOL1G1/G2.
Covariates: PC1 Covariates: PC1 andAPOL1G1/G2
SNP Position1 Gene Eff2 RA3 OR4 95% CI5 P
Add6 Pemp7 OR4 95% CI5 PAdd6 Pemp7
rs12695897 3:149927874 AGTR1 40 T 0.58 (0.43–0.79) 4.6E-04 0.018 0.58 (0.43–0.80) 7.9E-04 0.032
rs3793313 7:29272298 CHN2 194 T 1.40 (1.17–1.68) 4.6E-04 0.044 1.43 (1.18–1.72) 2.2E-04 0.043
rs17157908 7:29413882 CHN2 194 C 0.70 (0.57–0.86) 7.3E-04 0.14 0.66 (0.53–0.83) 2.5E-04 0.048
rs17157914 7:29414945 CHN2 194 A 0.69 (0.56–0.85) 4.7E-04 0.091 0.65 (0.52–0.81) 1.3E-04 0.026
rs6566815* 18:70406087 CNDP1 45 T 1.31 (1.14–1.51) 1.6E-04 0.076 1.32 (1.14–1.53) 2.5E-04 0.011
1hg18;
2Eff, effective number of SNPs per locus; 3RA, reference allele;
4OR, odds ratio;
595% CI, 95% confidence interval; 6P
Add, additive p-value; 7
Pemp, empiric p-value;
*imputed SNP.
extraction was performed using the PureGene system (Gentra Systems; Minneapolis, MN).
Genotyping, Imputation, and Variant Selection
As reported previously [5], genotyping was performed on the Affymetrix Genome-wide Human SNP array 6.0 (Affy6.0). Genotypes were called using Birdseed version 2; APT 1.10.0 by grouping samples by DNA plate to determine the genotype cluster boundaries. All autosomal SNPs (n = 868,157) were included in analysis. Imputation was performed for autosomes using MACH (version 1.0.16, http://www.sph.umich.edu/csg/abecasis/ MaCH/). SNPs with minor allele frequency (MAF) $1%, call rate $95% and Hardy–Weinberg p-value$1024
were used for imputation. A 1:1 mixture of the HapMap II release 22 (NCBI build 36) CEU:YRI consensus haplotypes (http://mathgen.stats. ox.ac.uk/impute/) was used as a reference panel. Imputation was performed in two steps. For the first step, 484 unrelated African American samples were randomly selected to calculate recombi-nation and error rate estimates. In the second step, these rates were used to impute all samples across the SNPs in the entire reference panel. Imputation results were filtered at an rsq threshold of$0.3 and a MAF$0.05. Adjustment for theAPOL1
G1/G2 risk variants was performed by direct genotyping of two SNPs in the APOL1 G1 nephropathy risk variant (rs73885319; rs60910145) and an indel for the G2 risk variant (rs71785313) [4] on the Sequenom platform (San Diego, CA).
SNPs in twenty two genes with prior evidence of association with nephropathy were examined. These included genes located within linkage peaks from family-based linkage analysis (NPHS1/2,
TRPC6 and CNDP1/2), candidate gene studies (AGTR1, NOS3,
ACACBandACTN4), gene expression studies (PLCE1), admixture mapping (APOL1andMYH9), and GWAS (CPVL,CHN2,ELMO1,
FRMD3,CARS,PVT1, andACE) including candidates highlighted from a previous genome-wide association study (GWAS) of T2D-ESKD in this African American population [5] (i.e. RPS12,
LIMK2, andSFI1). (Table S1).
Statistical Analysis
Principal Component Analysis (PCA). To address the effect of admixture in this African American dataset we performed a Principal Components Analysis (PCA) using all GWAS SNPs that passed quality control, excluding regions of high linkage disequilibrium (LD) and inversions. This approach was an iterative process whereby all high quality autosomal SNPs were used to calculate the top 50 principal components. Once calculated, the principal components were examined to determine if they were narrowly associated to specific regions of the genome. If so, those SNPs were excluded and the analysis repeated. The first principal component (PC1) explained the largest proportion of variation at 22% and was used as a covariate in all analyses. A direct comparison of the PCA with FRAPPE [17] analysis of 70 ancestry informative markers (AIMs; [18]) resulted in a high correlation between PC1 and the AIMs ancestry estimates, r2= 0.87. The mean (SD) African ancestry proportion in 965 T2D-ESKD cases and 1,029 controls was 0.8060.11 and 0.7860.11, respectively, as estimated by FRAPPE analysis. The remaining principal compo-nents explained markedly less variation and were associated with specific regions of the genome not in proximity to the candidate genes of interest; thus, not relecting either global or local ancestry [19]. Therefore, PC1 was used as a covariate in the association analyses to adjust for population substructure.
Locus-specific Analysis. Twenty-two previously reported T2D-DKD susceptibility loci were evaluated (Table S1). For
regional analysis, each gene was defined as +/210 kb from the longest annotated transcript. To test for an association with T2D-ESKD a logistic regression model was computed adjusting for PC1 and assuming an additive genetic model for each SNP individually using SNPGWA (www.phs.wfubmc.edu; [20]) with adjustment for PC1. In addition, variants were tested for association after adjusting for the influence of the APOL1 G1/G2 risk variants. Based on the known linkage disequilibrium pattern where G1 and G2 risk variants are very rarely observed on a single chromosome, we constructed a binary variable representing the compound G1/ G2 risk across these three markers, modelingAPOL1risk for all individuals with recessive haplotypes at either G1 or G2 or heterozygosity at both G1 and G2.APOL1has been shown to be powerfully associated with non-diabetic ESKD [4] and has been demonstrated to confound evidence of association in T2D-ESKD [21]. A BonferroniPvalue (Pemp),0.05 corrected for the effective
number of SNPs at each locus, i.e. independent SNPs in each locus was counted using the Li and Ji method [22] implemented in Sequential Oligogenic Linkage Analysis Routines (SOLAR), was considered statistically significant. Each locus was evaluated for the effective number of SNPs under the assumption of distinct pathways ultimately contributing to the overarching disease examined herein, diabetic nephropathy.
Power. The power of the tests of association were calculated using the genetic power calculator [23]. Estimates were based on a a sample of 965 T2D-ESKD cases and 1029 controls lacking T2D and ESKD under and additive genetic model assuming and r2= 1 of the genotyped variant with the causal variant for a disease prevalence of T2D-ESKD estimated at 1% in the African American population [24].
Supporting Information
Figure S1 Regional association plots for proposed T2D-ESRD susceptibility loci.
(DOCX)
Figure S2 LD Structure among associated T2D-ESRD susceptibility loci.
(DOCX)
Table S1 Proposed T2D-ESRD susceptibility loci iden-tified for follow-up study in the African American T2D-ESRD cohort.
(DOCX)
Table S2 Power calculations for a sample of 965 T2D-ESKD cases and 1029 controls lacking T2D and T2D-ESKD under and additive genetic model assuming and r2= 1 of the genotyped variant with the causal variant for a disease prevalence of T2D-ESKD estimated at 1%. (DOCX)
Acknowledgments
We wish to thank the patients, their relatives and staff of the Southeastern Kidney Council, Inc./ESRD Network 6 for their participation.
Author Contributions
References
1. de Boer IH, Rue TC, Hall YN, Heagerty PJ, Weiss NS, et al. (2011) Temporal trends in the prevalence of diabetic kidney disease in the United States. JAMA 305: 2532–2539.
2. System URD (2010) USRDS 2010 Annual Data Report: Atlas of Chronic Kidney Disease and End-Stage Renal Disease in the United States. Bethesda, MD: US Renal Data System.
3. Palmer ND, Freedman BI (2012) Insights into the genetic architecture of diabetic nephropathy. Curr Diab Rep 12: 423–431.
4. Genovese G, Friedman DJ, Ross MD, Lecordier L, Uzureau P, et al. (2010) Association of trypanolytic ApoL1 variants with kidney disease in African Americans. Science 329: 841–845.
5. McDonough CW, Palmer ND, Hicks PJ, Roh BH, An SS, et al. (2011) A genome-wide association study for diabetic nephropathy genes in African Americans. Kidney Int 79: 563–572.
6. Wild S, Roglic G, Green A, Sicree R, King H (2004) Global prevalence of diabetes: estimates for the year 2000 and projections for 2030. Diabetes Care 27: 1047–1053.
7. (2007) Genome-wide association study of 14,000 cases of seven common diseases and 3,000 shared controls. Nature 447: 661–678.
8. Kopp JB, Smith MW, Nelson GW, Johnson RC, Freedman BI, et al. (2008) MYH9 is a major-effect risk gene for focal segmental glomerulosclerosis. Nat Genet 40: 1175–1184.
9. Kopp JB, Nelson GW, Sampath K, Johnson RC, Genovese G, et al. (2011) APOL1 genetic variants in focal segmental glomerulosclerosis and HIV-associated nephropathy. J Am Soc Nephrol 22: 2129–2137.
10. Vardarli I, Baier LJ, Hanson RL, Akkoyun I, Fischer C, et al. (2002) Gene for susceptibility to diabetic nephropathy in type 2 diabetes maps to 18q22.3-23. Kidney Int 62: 2176–2183.
11. Iyengar SK, Abboud HE, Goddard KA, Saad MF, Adler SG, et al. (2007) Genome-wide scans for diabetic nephropathy and albuminuria in multiethnic populations: the family investigation of nephropathy and diabetes (FIND). Diabetes 56: 1577–1585.
12. Bowden DW, Colicigno CJ, Langefeld CD, Sale MM, Williams A, et al. (2004) A genome scan for diabetic nephropathy in African Americans. Kidney Int 66: 1517–1526.
13. Janssen B, Hohenadel D, Brinkkoetter P, Peters V, Rind N, et al. (2005) Carnosine as a protective factor in diabetic nephropathy: association with a leucine repeat of the carnosinase gene CNDP1. Diabetes 54: 2320–2327. 14. Crowley SD, Coffman TM (2012) Recent advances involving the
renin-angiotensin system. Exp Cell Res 318: 1049–1056.
15. Pezzolesi MG, Poznik GD, Mychaleckyj JC, Paterson AD, Barati MT, et al. (2009) Genome-wide association scan for diabetic nephropathy susceptibility genes in type 1 diabetes. Diabetes 58: 1403–1410.
16. Palmer ND, McDonough CW, Hicks PJ, Roh BH, Wing MR, et al. (2012) A genome-wide association search for type 2 diabetes genes in African Americans. PLoS One 7: e29202.
17. Tang H, Peng J, Wang P, Risch NJ (2005) Estimation of individual admixture: analytical and study design considerations. Genet Epidemiol 28: 289–301. 18. Keene KL, Mychaleckyj JC, Leak TS, Smith SG, Perlegas PS, et al. (2008)
Exploration of the utility of ancestry informative markers for genetic association studies of African Americans with type 2 diabetes and end stage renal disease. Hum Genet 124: 147–154.
19. Patterson N, Hattangadi N, Lane B, Lohmueller KE, Hafler DA, et al. (2004) Methods for high-density admixture mapping of disease genes. Am J Hum Genet 74: 979–1000.
20. Harley JB, Alarcon-Riquelme ME, Criswell LA, Jacob CO, Kimberly RP, et al. (2008) Genome-wide association scan in women with systemic lupus erythema-tosus identifies susceptibility variants in ITGAM, PXK, KIAA1542 and other loci. Nat Genet 40: 204–210.
21. Freedman BI, Langefeld CD, Lu L, Divers J, Comeau ME, et al. (2011) Differential effects of MYH9 and APOL1 risk variants on FRMD3 Association with Diabetic ESRD in African Americans. PLoS Genet 7: e1002150. 22. Li J, Ji L (2005) Adjusting multiple testing in multilocus analyses using the
eigenvalues of a correlation matrix. Heredity (Edinb) 95: 221–227.
23. Skol AD, Scott LJ, Abecasis GR, Boehnke M (2006) Joint analysis is more efficient than replication-based analysis for two-stage genome-wide association studies. Nat Genet 38: 209–213.