PD-L1 Expression on Retrovirus-Infected Cells
Mediates Immune Escape from CD8
+
T Cell
Killing
Ilseyar Akhmetzyanova1☯, Malgorzata Drabczyk1☯, C. Preston Neff2, Kathrin Gibbert1,
Kirsten K. Dietze1, Tanja Werner1, Jia Liu1,3, Lieping Chen4, Karl S. Lang5, Brent E. Palmer2, Ulf Dittmer1, Gennadiy Zelinskyy1*
1Institute for Virology, University Hospital Essen, University of Duisburg-Essen, Essen, Germany, 2University of Colorado, Anschutz Medical Campus, Aurora, Colorado, United States of America, 3Department of Infectious Diseases, Union Hospital of Tonji Medical College, Huazhong University of Science and Technology, Wuhan, P.R. China,4Department of Immunobiology, Yale School of Medicine, Yale University, New Haven, Connecticut, United States of America,5Institute for Immunology, University Hospital Essen, University of Duisburg-Essen, Essen, Germany
☯These authors contributed equally to this work. *[email protected]
Abstract
Cytotoxic CD8+ T Lymphocytes (CTL) efficiently control acute virus infections but can become exhausted when a chronic infection develops. Signaling of the inhibitory receptor PD-1 is an important mechanism for the development of virus-specific CD8+ T cell dysfunc-tion. However, it has recently been shown that during the initial phase of infection virus-spe-cific CD8+ T cells express high levels of PD-1, but are fully competent in producing
cytokines and killing virus-infected target cells. To better understand the role of the PD-1 signaling pathway in CD8+ T cell cytotoxicity during acute viral infections we analyzed the expression of the ligand on retrovirus-infected cells targeted by CTLs. We observed increased levels of PD-L1 expression after infection of cells with the murine Friend retrovi-rus (FV) or with HIV. In FV infected mice, viretrovi-rus-specific CTLs efficiently eliminated infected target cells that expressed low levels of PD-L1 or that were deficient for PD-L1 but the popu-lation of PD-L1high cells escaped elimination and formed a reservoir for chronic FV replica-tion. Infected cells with high PD-L1 expression mediated a negative feedback on CD8+ T cells and inhibited their expansion and cytotoxic functions. These findings provide evidence for a novel immune escape mechanism during acute retroviral infection based on PD-L1 expression levels on virus infected target cells.
Author Summary
Virus-specific cytotoxic T cells can eliminate infected cells during acute viral infections, but in chronic infections these cells often become dysfunctional or“exhausted.”The inhib-itory receptor PD-1 is involved in the suppression of cytotoxic T cell responses in chronic infections. However, during many acute viral infections cytotoxic T cells up-regulate the OPEN ACCESS
Citation:Akhmetzyanova I, Drabczyk M, Neff CP, Gibbert K, Dietze KK, Werner T, et al. (2015) PD-L1 Expression on Retrovirus-Infected Cells Mediates Immune Escape from CD8+T Cell Killing. PLoS Pathog 11(10): e1005224. doi:10.1371/journal. ppat.1005224
Editor:E. John Wherry, University of Pennsylvania, UNITED STATES
Received:January 9, 2015
Accepted:September 22, 2015
Published:October 20, 2015
Copyright:© 2015 Akhmetzyanova et al. This is an open access article distributed under the terms of the
Creative Commons Attribution License, which permits unrestricted use, distribution, and reproduction in any medium, provided the original author and source are credited.
Data Availability Statement:All relevant data are within the paper.
Funding:This work was supported by the Deutsche Forschungsgemeinschaft with grants to GZ (ZE 893/ 1-1 and Transregio 60, Project B8N), and with a grant to UD (Transregio 60, Project B4), and to KKD (DI 1914/1-1). The funders had no role in study design, data collection and analysis, decision to publish, or preparation of the manuscript.
PD-1 receptor but initially remain competent in killing virus infected target cells. Here we show that the ligand for PD-1, called PD-L1, can be induced on retrovirus infected cells and that the cells with the highest expression of PD-L1 escaped from cytotoxic T cell kill-ing. Thus, PD-L1high infected target cells accumulated during the course of infection, formed the reservoir of virus persistence, and subsequently mediated a negative feedback on cytotoxic T cells via the PD-1 receptor that ultimately resulted in functional exhaustion of these cells. The current results provide evidence for a novel escape mechanism of viruses from cytotoxic T cell responses and may explain how viral reservoirs are established dur-ing chronic infections.
Introduction
bronchial endothelial cells expressed enhanced levels of PD-L1 and co-cultivation with effector CD8+T cells resulted in decreased production of cytokines and cytotoxic molecules in the CD8+T cells [19]. In addition, studies on HIV-1 infection of human macrophages in cell cul-ture showed enhanced expression of PD-L1 and PD-L2 on the surface of infected cells [20]. However, thein vivoregulation of PD-L1 expression during an ongoing infection and its effect on CTL killing of virus-infected target cells has not been studied until now.
In the current study, the murine Friend retrovirus model was used to characterize the role of inhibitory ligand expression on FV infected cells in CTL immune escape during an acute ret-rovirus infection. FV is an oncogenic retroviral complex that can induce erythroleukemia in susceptible mice. However, resistant mouse strains, like the C57Bl/6 mice that we used in this study, mount a potent anti-viral immune response during the acute phase of infection that pre-vents the onset of leukemia [21]. Despite this efficient initial viral immunity, FV eventually escapes from T cell mediated immune control and establishes a chronic infection [22]. Interest-ingly, previous studies have shown that B cells and monocytes are the main reservoir for FV during chronic infection [23], but it is not known how these cells escape CTL destruction dur-ing the initial phase of infection. FV infected cells express the viral envelope protein gp70 on the cell membrane [24], which provides a unique method to detect infected cells ex vivo by sur-face staining with a specific antibody [25]. This allows these cells to be used for the kinetic anal-ysis of PD-L1 expression levels. We observed that in vivo same populations of FV infected cells expressed high levels of PD-L1 and escaped elimination by CTLs. In addition, they contributed to the development of exhaustion of virus specific PD-1 expressing CD8+T cells. The current study provides new and important data about the functional role of PD-L1 during acute retro-viral infection and the involvement of inhibitory ligands in retro-viral immune escape.
Results
PD-L1 expression levels on FV-infected target cells correlate with
survival
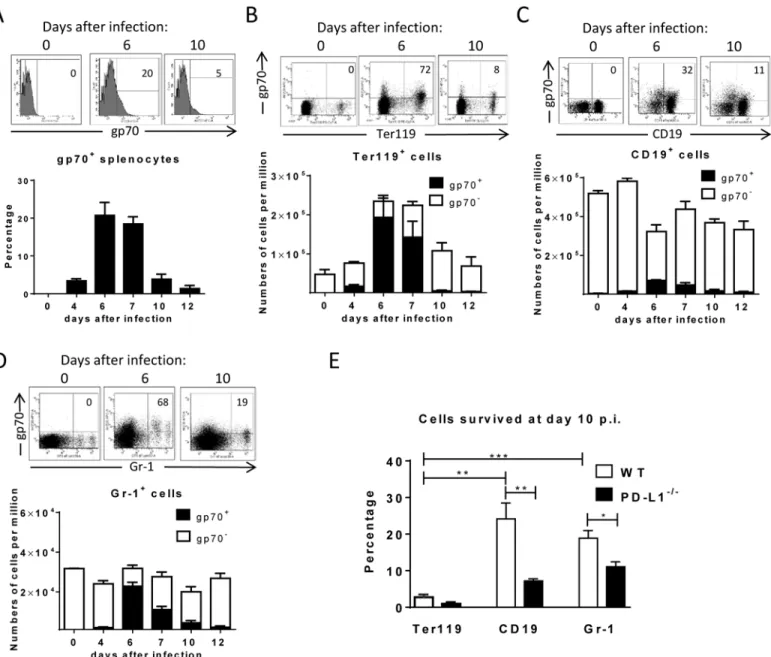
percentage of infected cells that had survived at day 10 compared to the peak infection at day 6 (Fig 1E; white bars). Whereas only 3% of the pool of FV infected Ter119+cells were left at day
Fig 1. Target cell populations of FV infection.C57BL/6 mice were infected with FV and splenocytes were isolated at different time points after infection. Multi-parameter flow cytometry analysis was used to compare the expression of FV gp70 antigen on the cell surface of different subpopulations of spleen cells.A. representative histograms of all nucleated cells positive for gp70 from naïve, 6 day and 10 day infected mice. The bars represent percentages of all
nucleated spleen cells positive for gp70 for a group of 6–10 mice.B. The representative dot plots of Ter119+cells positive for gp70 from naïve, 6 day and 10
day infected mice. Numbers in the upper right quadrat represent the percentage of gp70+of Ter119+cells. The bars represent the number of non-infected
Ter119+erythroblasts (gp70 negative) per one million nucleated cells (white columns) and the number of infected Ter119+gp70+cells (black columns).C.
The representative dot plot of CD19+cells positives for gp70 from naive, 6 day and 10 day infected mice. Numbers in the upper right quadrat represent the percentage of gp70+of CD19+cells. The bars represents the number of non-infected CD19+B cells (gp70 negative) per one million nucleated cells (white
columns) and the number of infected CD19+gp70+cells (black columns).D. The representative dot plot of Gr-1+cells positives for gp70 from naive, 6 day and
10 day infected mice. Numbers in the upper right quadrat represent the percentage of gp70+of Gr-1+cells. The bars represents the number of non-infected
myeloid Gr-1+cells (white column) and the number of infected Gr-1+gp70+cells (black columns).E. The frequency of gp70+cells at day 10 post infection in relation to the infected cells at day 6 from C57BL/6 (wt) (white bars) and PD-L1-/-(black bars) mice. Mean numbers plus SD from experiments with 5–8 mice
are shown. Data was pooled from three independent experiments with similar results. Differences between frequencies of infected (gp70+) cells from different
populations were analyzed by an unpaired t-test and are indicated in the figure (**p<0.005,***p<0.0005).
10 post infection, 25% of the infected B cells and 19% of the infected Gr-1+myeloid cells were still detectable. This analysis clearly shows a preferential survival of FV infected B cells and Gr-1+myeloid cells compared to erythroblasts. Since the control of FV replication during acute infection is dependent on killing of infected cells by virus-specific cytotoxic CD8+T cells [26,
29], it is reasonable to believe that differences in the efficacy of CTL killing of distinct popula-tions of infected target cells may exist.
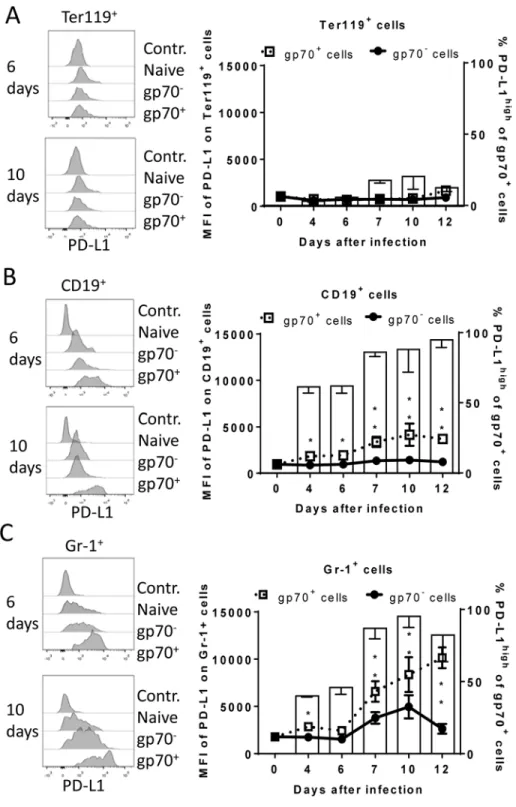
During acute FV infection virus-specific cytotoxic CD8+T cells express high levels of PD-1 [14] leading us to deduce that the PD-1/PD-L1 pathway may be involved in escape of FV infected cells from CTL killing. We therefore analyzed expression levels of PD-L1 (MFI) on FV infected (gp70+) versus non-infected (gp70-) cell subsets and frequencies of PD-L1highFV infected cellsex vivoat different time points during acute FV infection. Since the basic levels of PD-L1 expression on the three cell populations were different, we defined PD-L1high, as expres-sion levels which were higher than on the same cell population in naïve mice (seeFig 2A–2C
histograms). The population of Ter119+cells did not significantly change in their intensity of PD-L1 expression or in percentages of PD-L1highcells after FV infection (Fig 2A). In contrast, the infection of B cells and Gr-1+cells was associated with a significant increase in PD-L1 expression in comparison to naive cells (day 0) or to non-infected (gp70-) cells harvested at the same time point after infection (Fig 2B and 2C) This increase had two phases, it started early at 4 dpi but was most pronounced at 7–12 dpi corresponding with the expansion of cytotoxic CD8+T cells at this later time point [26]. The histograms shown inFig 2indicate that infected (gp70+) CD19+and Gr-1+cells with high expression of PD-L1 were enriched during the infec-tion process, most like because they survived CTL mediated killing (Fig 1E). Accordingly, the percentages of infected (gp70+) CD19+(Fig 2Bbars) and Gr-1+cells (Fig 2Cbars) expressing high levels of PD-L1 were increased as early as day 4 post infection reaching a plateau of more than 75% positive cells at day 7. Interestingly, the expression of PD-L1 on non-infected cells from infected mice was also enhanced during the second week of infection in comparison to cells from non-infected mice (day 0), most likely due to the inflammatory environment in the infected spleen.
To determine whether PD-L1 expression can influence survival of infected cells during acute FV infection, we took advantage of PD-L1 deficient mice [30]. PD-L1-/-mice were infected and the percentages of FV infected surviving Ter119+cells, B cells and Gr-1+cells were calculated (Fig 1E; black bars). In comparison to wild type mice (Fig 1E; white bars) sig-nificantly less gp70+B cells and Gr-1+cells survived between 6 and 10 dpi in PD-L1 deficient mice during acute FV infection. Thus, the expression of PD-L1 on FV infected cells influenced the elimination of these CTL target cells.
Retrovirus infection induces expression of PD-L1 on target cells
in vitro
Fig 2. Expression of PD-L1 on the surface of FV infected cells.C57BL/6 mice were infected with FV and the splenocytes were isolated at different time points after infection. Multi-parameter flow cytometry was used to compare the expression (MFI) of PD-L1 on the cell surface of infected (gp70+) and non-infected (gp70-)
Ter119+erythroid precursor cells (A), CD19+B cells (B), and Gr-1+myeloid derived cells (C) and the
percentage of PD-L1high(white bars) of gp70+cells. Data were pooled from three independent experiments
with similar results. Representative histograms of PD-L1 expression on infected (gp70+) and non-infected (gp70-) cells gated on every analyzed cell population on day 6 and day10 in infected mice are shown. Mean
numbers plus SD from experiments with 5–8 mice are shown. Data was pooled from three independent experiments with similar results. Differences between infected (gp70+) and non-infected (gp70-) cells were
analyzed by an unpaired t-test and are indicated in the figure (*p<0.05,**p<0.005,***p<0.0005).
Fig 3. PD-L1 expression on cells infected in vitro with FV or HIV.Spleen cells were isolated from naive B6 mice and cultivated with F-MuLV infectedMus Dunnicells to infect mouse cells in vitro. Multi-parameter flow cytometry was used to determine PD-L1 expression (MFI) (A) and the percentage of PD-L1high
cells (B) in different target cell populations of FV.C. Ter119+, CD19+, and Gr-1+cells were isolated from naïve wild type mice and were infected with F-MuLV
in vitro. mRNA from infected and non-infected cells was isolated for real time PCR quantification of the IFNαmRNA expression. The numbers of IFNαmRNA
copies in relation to 105copies of mRNA forβ-actin is shown. Data was pooled from at least two independent experiments with similar results. Spleen cells
were isolated from naїve wild type mice or from naïve IFNAR1-/-mice and cultivated with F-MuLV infectedMus Dunnicells to infect mouse cellsin vitro.
Multi-parameter flow cytometry was used to determine PD-L1 expression (MFI) on infected CD19+and Gr-1+cells(D) and in the presence of IFNα(E) Data was
pooled from at least two independent experiments with similar results.F. Multi-parameter flow cytometry was used to determine the expression of PD-L1 on the sur-face of gp70+Ter119+, gp70+CD19+, and gp70+Gr-1+cells isolated from spleens of 6 day FV infected WT and IFNAR1-/-mice. Data was pooled from
significantly increased after FV infection (Fig 3B). Murine retroviruses have been reported to be sensed by TLR3 and TLR7 [32,33] and this viral RNA recognition results in the induction of type I IFN responses [34]. Previous studies demonstrate that type I IFNs can stimulate the expression of PD-L1 on the surface of cells [35]. In order to determine whether FV infection induced transcription of IFNαin vitro, we compared the levels of mRNA by RT-PCR in
infected versus non-infected Ter119+cells, CD19+and Gr-1+cells. FV infection induced IFNα
mRNA expression in CD19+and Gr-1+cells (Fig 3C). Thus, viral infection induces IFNα
pro-ductionin vitroandin vivo[34], but does IFNαinfluence the expression of PD-L1 on the
sur-face of FV infected cells? To address this question spleen cells from wild type and IFN receptor deficient mice (IFNR1-/-) [36] were infectedin vitro. FV infection more efficiently enhanced the PD-L1 expression level on the surface of gp70+CD19+cells and on gp70+Gr-1+cells from WT mice in comparison to IFNR1-/-mice (Fig 3D). The expression of PD-L1 on the surface of FV infected CD19+and Gr-1+cells was significantly enhanced after treatment with exogenous IFNα(Fig 3E). This effect was not observed on FV infected cells from IFNR1-/-mice.
More-over, gp70+B cells and gp70+Gr-1+cells from FV infected IFNR1-/-mice expressed signifi-cantly less PD-L1 than those cells from WT mice (Fig 3F). This data suggest that type I interferon signaling is involved in PD-L1 expression and that virus induced IFNαis at least
one important regulator of PD-L1 expression on infected cells during the early phase of FV infection.
In order to show that human cells show enhanced expression of PD-L1 after infection with retrovirus as well, HIV infection of human CD4+T cell was performed. It has previously been reported that the overall T cell compartment from HIV-infected patients expresses increased levels of PD-L1 [37], but this has not been attributed to virus infection on a single cell level. Therefore, we investigated the PD-L1 expression on CD4+T cells from uninfected donors at day 3, 7 and 10 post HIV infectionin vitro. Staining against intracellular p24 antigen was used to identify HIV infected cells. A representative histogram plot of a PD-L1 staining shows that PHA alone (which is needed to activate T cells so they become permissive to in vitro infection) increased PD-L1 expression but HIV infection further enhanced this expression during the course of infection (Fig 3G). Cumulative data of day 10 post infection from 8 donors shows that PD-L1 expression on HIV-infected CD4+T cells (p24+) was significantly increased com-pared to p24-cells from the same cultures (Fig 3H). Similar results were achieved by determin-ing the percentages of infected CD4+cells expressing high levels of PD-L1 (Fig 3I). These data suggest that HIV infection of CD4+T cells also causes increased expression of PD-L1 that may help the virus to evade antiviral CTL responses.
Up-regulation of PD-L1 on FV infected cells protect them from CTL
killing
Cytotoxic CD8+T cells mediate elimination of infected target cells after day 6 of FV infection [26]. We hypothesize that cells with low-level expression of PD-L1 are more susceptible to CTL killing than cells expressing high levels of this molecule, which escape elimination by PD-1highCTL and subsequently get enriched (Fig 2). In order to confirm this theory anin vivoCTL
CD4+T cells after HIV-1 infection. Representative histograms of PD-L1 expression on human CD4+T cells non-stimulated and non-infected, stimulatedin vitrowith PHA and infected with HIV-1 or cells only stimulated with PHA are shown. The data is shown for day three, seven and ten after infection (G). Expression of PD-L1 on human CD4+T cells (H) and the percentage of PD-L1highCD4+T cells (I) in populations of non-stimulated and non-infected,
stimulatedin vitrowith PHA and infected with HIV-1 or cells only stimulated with PHA are shown at day ten after infection. Mean numbers plus SD from three independent experiments with similar results was shown. Differences between FV infected (gp70+) and FV non-infected (gp70-) mice cells were analyzed by an unpaired t-test. Differences between HIV infected (p24+) and HIV non-infected (p24-) CD4+cells were analyzed by Mann-Whitney t test. Statistically
significant differences between the groups are indicated in the figure (*p<0.05,**p<0.005).
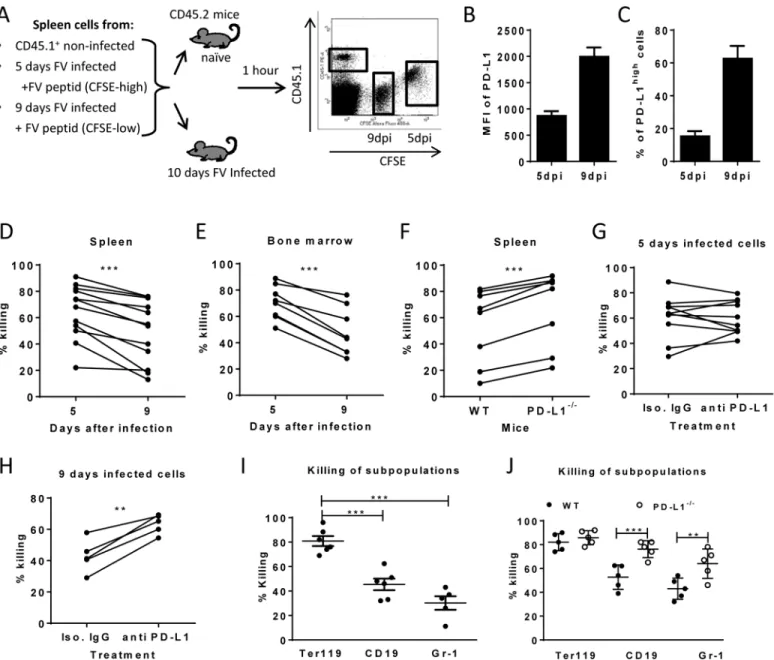
killing assay was performed (Fig 4A). This assay allows to differentially detect the elimination of different donor cell populations in the same mouse. Cells from 5 day infected mice (low level
Fig 4. Cytotoxic activity of CTL against target cells expressing different levels of PD-L1. A. Splenocytes from FV infected mice were isolated at day 5 (PD-L1low) and day 9 (PD-L1high) post infection and used as target cells for anin vivoCTL assay. Therefore the cells were loaded with peptide and stained
with different concentrations of CFSE. Spleen cells from naïve CD45-1 mice were used as control. Multi-parameter flow cytometry was used to compare the
elimination of 5 day FV infected cells with cells from 9 day infected mice. MFI of PD-L1 expression (B) and percentage of cells expressing high level of PD-L1 (C) on surface of spleen cells isolated from 5 day and from 9 day FV infected mice.In vivokilling of target cells from 5 day and from 9 day infected mice in the spleens (D) and in the bone marrow (E) of 10 day FV infected mice. The data points received from the same recipient mouse were connected.F.In vivokilling
of target cells from 9 day infected WT B6 and PD-L1 KO mice in the spleens of 10 day FV infected mice. The data points received from the same recipient mouse were connected.In vivokilling of target cells from 5 day (G) or cells from 9 day (H) FV infected B6 mice that were treated or non-treatedin vitrowith anti PD-L1 antibody before adoptive transfer into 10 day FV infected mice. The data points received from the same recipient mouse were connected.I. Elimination of Ter119+, CD19+cells, and Gr-1+cells transferred from 7 day infected mice in 10 day FV infected mice. (J). The elimination of target cells transferred from 9 day infected wild type and PD-L1-/-mice in in FV infected recipients. Data was pooled from two to three independent experiments with
similar results. Differences the elimination of target cell populations (D-H) was analyzed by paired t test. Differences elimination of subpopulations of target cells from 7 day infected mice (I, J) were analyzed by one-way ANOVA was used with a Tukey post-test. Statistically significant differences between the groups are indicated in the figure. (*p<0.05,**p<0.005,***p<0.0005).
of PD-L1) and cells from mice infected for 9 days (high level of PD-L1) (Fig 4B and 4C) were loaded with FV DbGagL peptide [38,39], mixed 1:1 and adoptively transferred as target cells for virus-specific CD8+T cells into FV infected mice (Fig 4A). The elimination of both popula-tions of target cells was simultaneously analyzed in the same infected donor mouse (connected dots inFig 4). This analysis was performed in the spleen (Fig 4D) and bone marrow (Fig 4E), because those are the organs with the highest FV loads and the strongest CTL activity [26]. In both organs elimination of target cells from donor mice was detected. However, the killing of splenocytes from 5 day infected mice (PD-L1low) was significantly higher in comparison to splenocytes from 9 day infected mice (PD-L1high). This confirms that enhanced expression of inhibitory ligands protected infected target cells from CTL killing.
In order to directly demonstrate the involvement of PD-L1 in the escape of target cells from CTL killingin vivo, two killing experiments with an impaired PD-L1 function on target cells were performed. Splenocytes from 9 day infected wild type mice or PD-L1 knockout mice were used as targets for CTLin vivo(Fig 4F). As expected, PD-L1 deficient target cells were more efficiently eliminated than wild type cells. Another modification of thein vivoCTL assay was performed to directly show the influence of PD-L1 on the efficacy of target cell killing. Half of the FV DbGagL peptide loaded spleen cells from 9 day infected mice (PD-L1high) were treated with blocking anti-PD-L1 antibodies and the other half with an isotype control antibody prior to their adoptive transfer into infected donor mice (Fig 4H). In all recipient mice splenocytes treated with anti-PD-L1 antibodies were killed significantly better than the cells with the con-trol antibody. If the same experiment was performed with spleen cells from 5 day infected mice that express only low levels of PD-L1 either slight enhancement or reduction of target cell elim-ination after treatment with anti-PD-L1 antibodies was observed (Fig 4G). If a 10% increase of target cell killing in the population of anti-PD-L1 treated target cells was considered as signifi-cant enhancement compared to the isotype control, then only 2 out of 10 animals showed that in the group of mice receiving 5 day infected cells (Fig 5G), whereas all mice (5 out of 5) showed this in the 9 day group (Fig 5H). These different numbers were analyzed with the Mann-Whitney-Rank test, which indicates a significant difference between the groups with a p-value of 0,0014.
The data clearly indicate that PD-1 signaling is influencing the efficacy of CTL killing during acute FV infection.
Enrichment of infected PD-L1
highcells was mediated by CTL
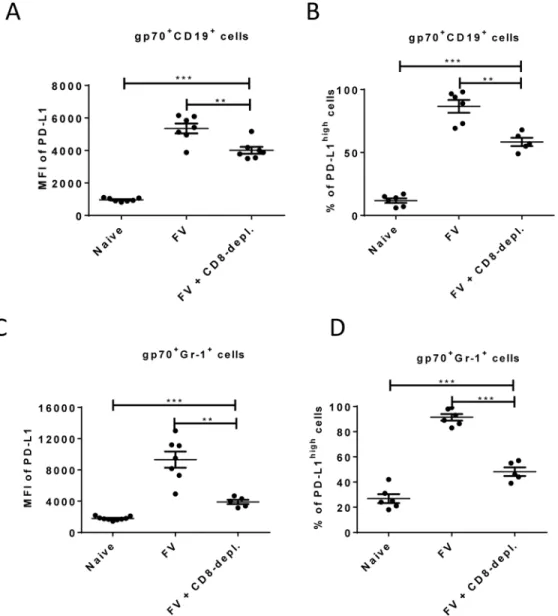
Enhancement of PD-L1 expression on infected CD19+and Gr-1+cells after day 6 post FV infection occurs concomitant with the expansion of virus-specific CTL (Fig 2and [26]). This suggests that CTL preferentially eliminate PD-L1lowtarget cells, but PD-L1highcells evade kill-ing and become enriched over time. In order to test this FV infected mice were depleted for CD8+T cells and the expression of PD-L1 on infected B cells and myeloid cells was analyzed.
As previously shown (Fig 2), the expression of PD-L1 is significantly increased on infected CD19+and Gr-1+cells at 10 days post infection suggesting a preferential survival of PD-L1high
Fig 5. Expression of PD-L1 on FV infected cells from CD8+T cells depleted mice.C57BL/6 mice were
infected with FV and treated with anti-mouse CD8 antibody. The spleen cells were isolated at day 10 after infection. Multi-parameter flow cytometry was used to compare the expression of PD-L1 on the cell surface of CD19+cells (A) and Gr-1+cells (C) and the percentage of infected (gp70+) CD19+(B) and Gr-1+(D) cells
expressing high levels of PD-L1. Data was pooled from three independent experiments with similar results. Differences in PD-L1 expression on CD19+cells or Gr-1+cells from naïve mice and gp70+CD19+cells or
gp70+Gr-1+cells from mice FV infected and FV infected and CD8+T cells depleted mice were analyzed by
one-way ANOVA was used with a Tukey post-test. Statistically significant differences between the groups are indicated in the figure (*p<0.05,**p<0.005,***p<0.0005).
cells (Fig 1E). However, the level of PD-L1 expression and the percentages of cells expressing high levels of PD-L1 on infected B cells (Fig 5A and 5B) and on infected myeloid cells (Fig 5C and 5D) was significantly reduced in mice depleted of CD8+T cells. During previous studies it was observed that mice without CD8+effector T cells were unable to efficiently control the rep-lication of FV, since cytotoxicity is the main functional property of FV-specific CD8+T cells [40]. Thus, the low mean fluorescence intensity values in mice deficient for CD8+T cells reflects the lack of cytotoxic T cell pressure on the infected target cells or the effect of proin-flammatory cytokines produced by effector CD8+T cells. However, the PD-L1 expression lev-els on infected CD19+and Gr-1+cells from CD8+depleted mice were still significantly higher than those of non-infected cells of the same population. The data demonstrate the enrichment of PD-L1hightarget cells by CTL activity but also imply that the infection of the cells itself, most likely by production of type I IFN, induced up-regulation of PD-L1.
High expression of PD-L1 on infected target cells suppresses the
functionality of CD8
+T cells
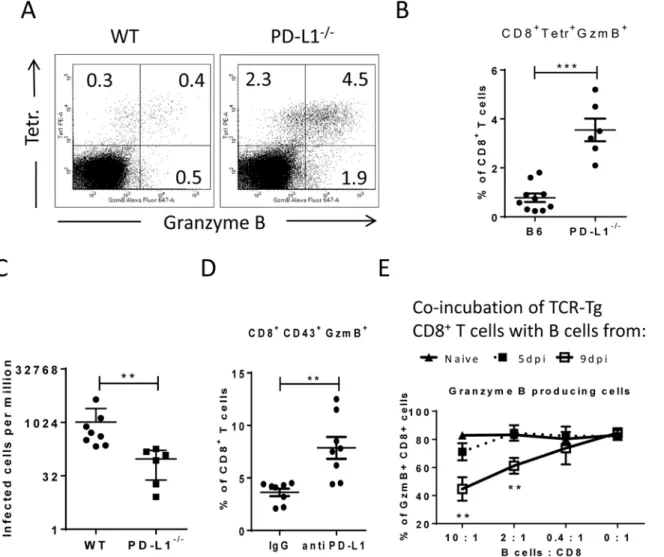
Virus-specific CD8+T cells form tight contacts with infected target cells called cytotoxic synap-ses. Binding of virus-specific PD-1highCTLs to infected targets with high expression of PD-L1 may therefore have functional consequences for the effector CD8+T cell. In order to analyze this, we infected PD-L1 knockout mice and compared their CTL response with wild type ani-mals (Fig 6A and 6B). The absence of PD-L1 resulted in enhanced expansion of virus-specific CD8+T cells and augmented production of the cytotoxic molecule granzyme B by FV-specific (tetramer+) CD8+T cells. The expanded effector CD8+T cells efficiently controlled FV infec-tion in PD-L1 knockout mice (Fig 6C). Similar results were obtained from 10 day infected wild type mice treated once at day 7 with anti-PD-L1 blocking antibody (Fig 6D). When binding of PD-L1 to the PD-1 receptor was blocked by the antibody more granzyme B was produced by activated CD43+CD8+T cells. Theseex vivodata demonstrate the regulatory role of PD-L1 on the functionality of CD8+T cells during acute FV infection.
In order to show that target cells with enhanced expression of PD-L1 potently inhibit the cyto-toxic functions of CD8+T cells the followingin vitroexperiment was performed (Fig 6E). Naïve CD8+T cells from TCR transgenic mice [39,41] specific for the FV GagL immunodominant epi-tope were stimulated with DC loaded with respective FV peptide (FV GagL CTL epiepi-tope) to induce activation and proliferation of the CD8+T cells. We then added different numbers of B cells isolated either from naïve mice or mice infected with FV for 5 (PD-L1low) or 9 (PD-L1high) days. The stimulation of the FV GagL-specific CD8+T cells with their cognate antigen resulted in cell proliferation and more than 80% of the CD8+T cells started to produce granzyme B. Adding increasing numbers of naïve B cells to these cultures did not change T cell proliferation or gran-zyme B production (Fig 6D). Also FV infected B cells expressing low levels of PD-L1 (from 5 day infected mice) did not change proliferation or function of the CD8+T cells. However, the pro-duction of the cytotoxic molecule granzyme B in T cells was significantly reduced after incuba-tion with PD-L1highB cells from 9 day infected mice. The magnitude of the suppressive effect of PD-L1highB cells was dependent on B cell numbers. The current data fromin vivoandin vitro
experiments prove that infected target cells expressing high levels of PD-L1 suppress the prolifer-ation and functionality of anti-viral CD8+T cells. In FV infected mice this effect starts at a late phase of acute infection (9 dpi) and results in immune escape of infected cells.
Discussion
tolerance and for preventing autoimmune disorders. The PD-1 inhibitory receptor also plays a key role in the development of exhaustion of virus-specific CD8+T cells during numerous chronic infections [42]. Blocking of PD-1 signaling by antibody treatment partially reconsti-tutes the functionality of CD8+T cells during chronic infection and can even result in elimina-tion of viruses [15]. However, the kinetic of T cell exhaustion and the involvement of the PD-1 ligand PD-L1 is less well established in many virus infections. PD-1 and other inhibitory recep-tors are often up-regulated on virus-specific CD8+T cells very early after infection and can even be used as activation markers during several acute viral infections. Although, the impact of PD-1 expression on T cells during acute infections is quite contradictory. Some studies sug-gested that the expression of PD-1 was associated with T cell dysfunction during initial infec-tion [12,43,44]. In other infection models PD-1 expression did not induce exhaustion of
Fig 6. Suppression of CD8+T cell function by PD-L1 expressing target cells.C57BL/6 and PD-L1-/-mice were infected with FV. Multi-parameter flow
cytometry was used to compare the populations of FV gag tetramer positive CD8+T cells at 8 days after infection.A. Representative dot plots gated on
CD3+CD8+T cells. Tetramer+cells were stained for granzyme B expression.B. The percentage of CD8+Tetramer+Granzyme B+cells per one million
nucleated spleen cells is shown.C. The numbers of infectious cells in the spleens of 10 day infected wild type and PD-L1-/-mice.D. C57BL/6 mice were infected with FV and treated with anti PD-L1 antibody or with mice IgG as a control group. Spleen cells were isolated at day ten after infection. The number of CD8+CD43+GzmB+cells per one million nucleated cells was determined by flow cytometry.E. Naïve CD8+T cells from FV-specific TCR transgenic mice
were stimulated with FV peptide loaded DCs and incubated with different numbers of B cells from naive, 5 day infected or 9 day infected mice. The production of granzyme B in CD8+T cells was analyzed after 48h of co-incubation. Data was pooled from three independent experiments with similar results.
Differences were analyzed by paired t-test. Statistically significant differences between the groups are indicated in the figure (**p<0.005,***p<0.0005).
virus-specific CD8+T cells during acute infection [10,14,45]. Even studies using the same infection model reported contradictory findings. For example, Takamura et al. claimed that PD-1highCD8+T cells are prematurely exhausted during acute FV infection of mice and play only a limited role in virus control [46]. However, in a subsequent study we could clearly dem-onstrate that FV-specific PD-1highCTL efficiently killed virus infected target cells and were critical for reducing acute viral loads [14]. During initial FV infection PD-1 is an activation rather than an exhaustion marker for CD8+T cells. However, after several days of acute FV infection (>9dpi) T cells start to become dysfunctional and signaling through PD-1 receptor can contribute to this exhaustion. Our current study provides an explanation for our previous findings. The critical factor that determines whether or not PD-1 expression is resulting in T cell exhaustion is the expression of the ligand PD-L1 on cells that have close contact to CD8+T cells. During FV infection of resistant mice the main target cell population of the virus are Ter119+cells but for an unknown reason the expression of PD-L1 on these cells was not changed after infection. Consequently, these target cells were almost completely eliminated by virus-specific CTL during the acute infection. In contrast, in the other two important target cell populations, B cells and myeloid cells, FV infection resulted in a significant up-regulation of PD-L1 during the initial phase of infection (4 dpi,Fig 2). This expression of inhibitory recep-tors protected infected cells from cytotoxic killing and thus, it is not surprising that B cells and myeloid cells ultimately form the viral reservoir in chronic FV infection [23]. The immune escape of infected PD-L1highcells enriched these cells during the late phase of acute infection (>7 dpi), whereas infected PD-L1lowCD19+and Gr-1+cells were eliminated (Fig 4I). Despite killing virus-specific CD8+T cells also produce proinflammatory cytokines, like TNFαand
IFNγ. These cytokines were shown to enhance the expression of PD-L1 in infected organs [31].
Thus, the cytotoxic activity of CD8+T cells and the secretion of cytokines by these cells might contribute to the accumulation of infected cells with enhanced PD-L1 expression during the establishment of a chronic infection.
During the late phase of acute FV infection (>9dpi) many infected cells, which express high levels of PD-L1, are left as targets for activated PD-1+CTL. The multiple inhibitory signals from these PD-L1hightargets then induce the functional exhaustion of virus-specific CD8+T cells (Fig 6E). Similar findings were obtained byin vivoimaging of CD8+T cell responses against LCMV [47]. The enhanced expression of PD-L1 on LCMV infected cells abrogated the migration of virus-specific CD8+T cells and resulted in formation of long-lasting immunologi-cal synapses. The outcome of this prolonged CTL target cell interaction was a PD-L1 depen-dent migration arrest of antigen-specific CD8+T cells and a decreased production of pro-inflammatory cytokines by these cells. Also in other studies of LCMV infection [48,49] an enhanced PD-L1 expression on infected cells was observed and the suppressive effect of this ligand on the functionality of virus-specific CD8+T cells was demonstrated. Thus, PD-L1 on infected cells directly suppresses the functionality of virus-specific CD8+T cells.
The first moderate but significant enhancement of PD-L1 expression was observed directly after infection, which suggests that this enhancement was induced by the virus. The FV infec-tion of cellsin vitro(Fig 3C) andin vivo[50] induces the transcription of IFNαmRNA, which
can up-regulate PD-L1 expression on infected cells. Thus, the virus-induced production of IFNαis one possible mechanism regulating the expression of PD-L1 on the surface of infected
human rhinovirus [55]. Obviously, PD-L1 expression on the surface of infected target cells can be regulated by different viruses and infected cells expressing PD-L1 acquire immunoregula-tory properties.
The expression of PD-L1 was observed in different types of tumors [56]. The suppressive effect of this molecule on the T cell antitumor immunity was also demonstrated. Moreover, the prevention of PD-1 signaling after treatment with PD-1 or PD-L1 therapeutic anti-body shows the effective elimination of tumors in the experimental models as well as in clinical trials [15]. The mechanisms regulating the expression of PD-L1 on tumor cells are not
completely understood, but the recent study shows that CD8+T cells induce the expression of PD-L1 on melanoma tumor cells [57]. Based on current data, we propose that during tumor elimination CTLs preferentially kill cells with a low expression of PD-L1, whereas cells with a high expression of PD-L1 seem to escape from this elimination and subsequently accumulate.
Thus the provided data concerning PD-L1 expression on infected cells and regulation of CTL functionality may be helpful information for the development of new therapeutic approaches against chronic viral infections and cancer.
Materials and Methods
Ethics statement
Animal experiments were performed in strict accordance with the German regulations of the Soci-ety for Laboratory Animal Science (GV-SOLAS) and the European Health Law of the Federation of Laboratory Animal Science Associations (FELASA). The protocol was approved by the North Rhine-Westphalia State Agency for Nature, Environment and Consumer Protection (LANUV) (Permit number: G 1252/10 and G 1193/11). All efforts were made to minimize suffering.
Mice
Inbred C57BL/6 (B6) mice were maintained under pathogen free conditions. Experiments were performed using C57BL/6 (B6) mice. The relevant FV resistance genotype of B6 mice is H-2b/b, Fv1b/b, Fv2r/r, Rfv3r/r. The B6 mice were obtained from Charles River Laboratories. B6-background PD-L1 KO (B7-H1-KO) mice were originally generated by L.C. [30]. B6. SJL-Ptprca Pep3b/BoyJ (CD45.1) B6-background mice were obtained from Charles River Lab-oratories. IFNAR knockout mice [36] were backcrossed more than 10 times on a C57BL/6 background. DbGagL TCR tg mice were on a C57BL/6 background and more than 90% of the CD8+ T cells contained a TCR specific for the DbGagL FV epitope [39,41]. All mice were females 8–16 weeks of age at the beginning of the experiments.
Virus and viral infection
The FV stock used in these experiments was a FV complex containing B-tropic Friend murine leukemia helper virus (F-MuLV) and polycythemia-inducing spleen focus-forming virus free of lactate dehydrogenase-elevating virus [58,59]. The stock was prepared as a 10% spleen cell homogenate from BALB/c mice infected 14 days previously with 3 000 spleen focus-forming units of non-cloned virus stock. Experimental mice were injected intravenously with 0.3ml of PBS containing 20 000 spleen focus-forming units of FV.
Phenotypic analysis of PD-L1 during HIV infection of human CD4
+T
cells
Blood was collected from healthy donors under an approved Institutional Review Board proto-col. Peripheral blood mononuclear cells (PBMC) were purified by Ficoll-Hypaque density gra-dient separation as previously described [60]. CD4+T cells were isolated by positive selection using magnetic bead separation according to the manufacturer’s protocol (Miltenyi Biotec, Auburn, CA). 1x10⁷CD4+T cells were cultured in RPMI 1640 (Invitrogen, Gaithersburg, MD) containing 10% fetal bovine serum (Hyclone, Logan, UT) and 1% Pen-Strep-Glut (Invitrogen) in a 6-well plate. Cells were pretreated with polybrene (4ug/ml) for 30 minutes to improve viral infection. After two washes, cells were resuspended in complete medium in the absence or presence of 2μg/ml PHA (Sigma). Cells were cultured overnight in the absence or presence of
cell free NL4.3 HIV virus (MOI 0.1) at 37°C in a humidified 5% CO2atmosphere. The
follow-ing day, cells were washed twice and resuspended at 2x10⁶cells per milliliter culture media. Cells were collected at days 3, 7 and 10 and were stained with fluorescent antibodies against CD3 (OKT3, BioLegend), CD4 (OKT4, BioLegend), CD8 (3B5, Invitrogen), PD-1 (MIH4, BD Pharmingen) and PD-L1 (MIH1, eBioscience) before fixation. The cells were then permeabi-lized (BD Cytoperm) and stained for intracellular p24 antigen (KC57-RD1, Beckman Coulter). The cells were analyzed by flow cytometry, and CD3+CD8-cells were gated to identify p24 pos-itive and negative populations and the expression levels of PD-L1 was measured on both populations.
Cell surface and intracellular staining by flow cytometry
Cell surface staining was performed using Becton Dickinson or eBioscience reagents. Following antibodies were used: anti-CD3, anti-CD4 (RM4-5), anti-CD8 (53–6.7), anti-CD19 (ID3), CD43 (1B11), CD45.1 (A20), Gr-1 (RB6-8C5), PD-L1 (MIH-5), and anti-Ter119 (Ter-119). Dead cells (propidium iodide positive) were excluded from analyses. Intra-cellular granzyme B (monoclonal anti-human granzyme B (GB11), (Invitrogen, Darmstadt, Germany) staining was performed as described [26]. FV protein gp70 expressing cells were detected by labeling with antibody 720 (Ab720) [25]. Ab720 were isolated from hybridoma supernatant and conjugated with Alexa Fluor 647 according to manufacturer’s protocol (Molecular Probes). Data were acquired on a LSR II flow cytometer (Becton Dickinson) from 200,000–300,000 lymphocyte-gated events per sample. Analyses were done using FlowJo (Treestar) and FACSDiva software (Becton Dickinson). The quantity of survived cells at day 10 was calculated by determining the portion of cells detectible at day 10 after infection from the numbers of infected cells at the peak of FV infection at day 6. These quantities were calculated for every cell population separately.
Tetramers and tetramer staining
For the detection of Db-GagL-specific CD8+T cells, spleen cells were stained with PE labelled MHC class I H2-Db(Beckman Coulter, Marseille, France) tetramers specific for FV GagL pep-tide [38,39] as described previously (Zelinskyy et al., 2009).
In vivo
cytotoxicity assay
Thein vivoCTL assay described by Barber et al. [61] was modified to measure cytotoxicity in FV-infected mice (Fig 4A). Splenocytes from mice infected for 5 or 9 days were loaded with 1–5μM DbGagL peptide. The peptide loaded cells were stained with 4nM or 200 nM of CFSE
Splenocytes (1x10⁷cells of each population) were transferred i.v. into naïve or 10 day FV-infected mice. One hour after adoptive transfer, spleens and bone marrows from recipient mice were harvested and cell suspensions were prepared. Cell suspensions were stained with anti CD45.1 antibody and measured by LSR II. Donor cells were distinguished from recipient cells and from one another based on different CFSE intensities and on expression of CD45.1 (Fig 4A, dot plot). The percentage of killing of each population of FV pulsed cells was calculated as follows: 100 - ([(% peptide pulsed in infected / % CD45.1+ unpulsed in infected) / (% peptide pulsed in uninfected / % CD45.1+ unpulsed in uninfected)] x 100). [38,39].
In order to show the direct role of PD-L1 for elimination of target cells thein vivo cytotoxic-ity assay was modified. Cells from 9 day FV infected PD-L1 KO mice or cells from 9 day infected C57BL/6 mice in vitro treated with anti PD-L1 antibody (10F.9G2) (BioXCell) were used instead of cells from 5 day infected mice in above described in vivo cytotoxicity assay. The remaining steps of assays were performed as described above. A control experiment was per-formed with target cells from 5 day infected C57BL/6 mice treated with anti PD-L1 antibody (10F.9G2; BioXCell) and injected together with non-treated cells from 5 day infected mice and with a reference population from CD45.1 mice.
PD-L1 blockade and lymphocyte depletion
C57BL/6 mice were infected with FV. 250μg of anti PD-L1 antibody (10F.9G2) (BioXCell) or
control rat IgG antibody (BioXCell) was administered i.p. at the time of infection and every other day for a total of 5 injections. CD8+T cell depletion was started simultaneously with FV infection. Mice were inoculated every other day for 5 times intraperitoneally (i.p.) with 0.5 mL of supernatant fluid obtained from hybridoma cell culture 169.4 producing CD8a-specific monoclonal antibody [62]. The treatment depleted more than 95% of the CD8+cells in the spleen (at 10 days post infection).
In vitro
suppression assay
To examine the influence of PD-L1high cells in vitro on both proliferation and function of CD8+T cells, we modified a standard in vitro immunosuppression assay as described for the characterization of the suppressive function of regulatory T cells [63]. Mice bone marrow derived dendritic cells were generated as previously described (Balcow et al.) and incubated with DbGagL peptide (5μg/ml) (28) in RPMI (Life Technologies) containing 10% normal
mouse serum for 60 min at 37°C. FV-specific TCR Tg CD8+T cells were isolated from spleens of DbGagL TCR Tg mice [39,41] by positive selection using magnetic bead separation accord-ing to the manufacturer’s protocol (Miltenyi Biotec), and then labeled with 5μM CFSE
(Molec-ular Probes). B cells (CD19+) were isolated from spleens of naïve, 5 days, and 9 days FV infected B6 mice by positive selection using magnetic bead separation according to the manu-facturer’s protocol (Miltenyi Biotec). Purities of all cell populations were>94%. For the induc-tion of T cell proliferainduc-tion, 1 × 10⁵of peptide-pulsed DCs and 5 x 10⁵TCR Tg CD8+T cells per well were cultured on a flat-bottom 96-well plate in AIM-V (Life Technologies) containing 10% FBS, 2 mM L-glutamine, 50μM 2-ME and 100 U/ml each penicillin and streptomycin at
37°C with 5% CO2. B cells were added to cultures simultaneously with CD8+T cells at a 10:1, 2:1, and 0,4:1 ratio of B cells to CD8+target cells. After 48 h cultivation cells were then stained for CD8, fixed, permeabilized, and stained for intracellular granzyme B as described above.
RNA isolation and real time-PCR
stored at -80°C. Total RNA concentration was determined by using NanoDrop 2000c spec-trometer (Thermo Scientific, Wilmington, DE). Real time-PCR analysis for the quantification of IFN-αmRNA was performed using Power SYBR Green RT-PCR kit (Life Technologies)
Primer sequences (Biomers) were as follows: 5’-atggctaggctctgtgctttcct-3’, 5’ -agggctctcca-gacttctgctctg-3’. The absolute mRNA copy numbers were determined by using StepOne Soft-ware v2.3 (Life Technologies).
Statistical analysis
Statistics comparing the two groups were done using the unpaired non-parametric t test or Mann-Whitney t test. Statistics comparing the elimination of the two groups of target cellsin vivowere done using the paired non-parametric t test. When more than two groups were com-pared, a one-way ANOVA was used with a Tukey post-test. (GraphPad Prism software; Graph-Pad Software Inc., San Diego, USA).
Author Contributions
Conceived and designed the experiments: IA MD CPN KKD JL BEP UD GZ. Performed the experiments: IA MD CPN KKD KG TW JL GZ. Analyzed the data: IA MD CPN KKD JL BEP UD GZ. Contributed reagents/materials/analysis tools: LC KSL. Wrote the paper: IA CPN BEP UD GZ.
References
1. Kantzanou M, Lucas M, Barnes E, Komatsu H, Dusheiko G, Ward S, et al. Viral escape and T cell exhaustion in hepatitis C virus infection analysed using Class I peptide tetramers. Immunol Lett. 2003; 85(2):165–71. Epub 2003/01/16. doi: S0165247802002249 [pii]. PMID:12527224.
2. Pantaleo G, Soudeyns H, Demarest JF, Vaccarezza M, Graziosi C, Paolucci S, et al. Evidence for rapid disappearance of initially expanded HIV-specific CD8+ T cell clones during primary HIV infection. Proc Natl Acad Sci U S A. 1997; 94(18):9848–53. Epub 1997/09/02. PMID:9275214; PubMed Central PMCID: PMC23280.
3. Barber DL, Wherry EJ, Masopust D, Zhu B, Allison JP, Sharpe AH, et al. Restoring function in exhausted CD8 T cells during chronic viral infection. Nature. 2006; 439(7077):682–7. Epub 2005/12/ 31. doi: nature04444 [pii] doi:10.1038/nature04444PMID:16382236.
4. Golden-Mason L, Palmer B, Klarquist J, Mengshol JA, Castelblanco N, Rosen HR. Upregulation of PD-1 expression on circulating and intrahepatic hepatitis C virus-specific CD8+ T cells associated with reversible immune dysfunction. J Virol. 2007; 81(17):9249–58. Epub 2007/06/15. doi: JVI.00409-07 [pii] doi:10.1128/JVI.00409-07PMID:17567698; PubMed Central PMCID: PMC1951397.
5. Radziewicz H, Ibegbu CC, Fernandez ML, Workowski KA, Obideen K, Wehbi M, et al. Liver-infiltrating lymphocytes in chronic human hepatitis C virus infection display an exhausted phenotype with high lev-els of PD-1 and low levlev-els of CD127 expression. Journal of Virology. 2007; 81(6):2545–53. doi:10. 1128/Jvi.02021-06PMID:ISI:000244850800001.
6. Blackburn SD, Shin H, Haining WN, Zou T, Workman CJ, Polley A, et al. Coregulation of CD8+ T cell exhaustion by multiple inhibitory receptors during chronic viral infection. Nat Immunol. 2009; 10(1):29– 37. Epub 2008/12/02. doi: ni.1679 [pii] doi:10.1038/ni.1679PMID:19043418.
7. Dietze KK, Zelinskyy G, Liu J, Kretzmer F, Schimmer S, Dittmer U. Combining regulatory T cell deple-tion and inhibitory receptor blockade improves reactivadeple-tion of exhausted virus-specific CD8+ T cells and efficiently reduces chronic retroviral loads. PLoS pathogens. 2013; 9(12):e1003798. Epub 2013/ 12/18. doi:10.1371/journal.ppat.1003798PMID:24339778; PubMed Central PMCID: PMC3855586. 8. Palmer BE, Neff CP, Lecureux J, Ehler A, Dsouza M, Remling-Mulder L, et al. In vivo blockade of the
PD-1 receptor suppresses HIV-1 viral loads and improves CD4+ T cell levels in humanized mice. Jour-nal of immunology. 2013; 190(1):211–9. Epub 2012/12/05. doi:10.4049/jimmunol.1201108PMID: 23209326; PubMed Central PMCID: PMC3529847.
10. Kasprowicz V, Schulze Zur Wiesch J, Kuntzen T, Nolan BE, Longworth S, Berical A, et al. High level of PD-1 expression on hepatitis C virus (HCV)-specific CD8+ and CD4+ T cells during acute HCV infec-tion, irrespective of clinical outcome. J Virol. 2008; 82(6):3154–60. Epub 2007/12/28. doi: JVI.02474-07 [pii] doi:10.1128/JVI.02474-07PMID:18160439; PubMed Central PMCID: PMC2258997.
11. Zhang Z, Zhang JY, Wherry EJ, Jin B, Xu B, Zou ZS, et al. Dynamic programmed death 1 expression by virus-specific CD8 T cells correlates with the outcome of acute hepatitis B. Gastroenterology. 2008; 134(7):1938–49. doi:10.1053/j.gastro.2008.03.037PMID:ISI:000256686400019.
12. Petrovas C, Price DA, Mattapallil J, Ambrozak DR, Geldmacher C, Cecchinato V, et al. SIV-specific CD8+ T cells express high levels of PD1 and cytokines but have impaired proliferative capacity in acute and chronic SIVmac251 infection. Blood. 2007; 110(3):928–36. Epub 2007/04/19. doi: blood-2007-01-069112 [pii] doi:10.1182/blood-2007-01-069112PMID:17440051; PubMed Central PMCID: PMC1924769.
13. Santosuosso M, Righi E, Hill ED, Leblanc PR, Kodish B, Mylvaganam HN, et al. R5-SHIV induces multi-ple defects in T cell function during early infection of rhesus macaques including accumulation of T reg cells in lymph nodes. PLoS One. 2011; 6(4):e18465. Epub 2011/04/13. doi:10.1371/journal.pone. 0018465PMID:21483689; PubMed Central PMCID: PMC3071731.
14. Zelinskyy G, Myers L, Dietze KK, Gibbert K, Roggendorf M, Liu J, et al. Virus-specific CD8+ T cells upregulate programmed death-1 expression during acute friend retrovirus infection but are highly cyto-toxic and control virus replication. J Immunol. 2011; 187(7):3730–7. Epub 2011/08/30. doi: jimmu-nol.1101612 [pii] doi:10.4049/jimmunol.1101612PMID:21873525.
15. Sakthivel P, Gereke M, Bruder D. Therapeutic intervention in cancer and chronic viral infections: anti-body mediated manipulation of PD-1/PD-L1 interaction. Rev Recent Clin Trials. 2012; 7(1):10–23. Epub 2011/10/26. PMID:22023178.
16. Seko Y, Yagita H, Okumura K, Azuma M, Nagai R. Roles of programmed death-1 (PD-1)/PD-1 ligands pathway in the development of murine acute myocarditis caused by coxsackievirus B3. Cardiovasc Res. 2007; 75(1):158–67. Epub 2007/04/17. doi:10.1016/j.cardiores.2007.03.012PMID:17434153. 17. Blackburn SD, Crawford A, Shin H, Polley A, Freeman GJ, Wherry EJ. Tissue-specific differences in PD-1 and PD-L1 expression during chronic viral infection: implications for CD8 T-cell exhaustion. J Virol. 2010; 84(4):2078–89. Epub 2009/12/04. doi: JVI.01579-09 [pii] doi:10.1128/JVI.01579-09PMID: 19955307; PubMed Central PMCID: PMC2812396.
18. Lafon M, Megret F, Meuth SG, Simon O, Velandia Romero ML, Lafage M, et al. Detrimental contribution of the immuno-inhibitor B7-H1 to rabies virus encephalitis. J Immunol. 2008; 180(11):7506–15. Epub 2008/05/21. doi: 180/11/7506 [pii]. PMID:18490751.
19. Telcian AG, Laza-Stanca V, Edwards MR, Harker JA, Wang H, Bartlett NW, et al. RSV-induced bron-chial epithelial cell PD-L1 expression inhibits CD8+ T cell nonspecific antiviral activity. The Journal of infectious diseases. 2011; 203(1):85–94. Epub 2010/12/15. doi:10.1093/infdis/jiq020PMID: 21148500; PubMed Central PMCID: PMC3086441.
20. Rodriguez-Garcia M, Porichis F, de Jong OG, Levi K, Diefenbach TJ, Lifson JD, et al. Expression of PD-L1 and PD-L2 on human macrophages is up-regulated by HIV-1 and differentially modulated by IL-10. Journal of leukocyte biology. 2011; 89(4):507–15. Epub 2010/11/26. doi:10.1189/jlb.0610327 PMID:21097698; PubMed Central PMCID: PMC3058820.
21. Hasenkrug KJ, Chesebro B. Immunity to retroviral infection: the Friend virus model. P Natl Acad Sci USA. 1997; 94(15):7811–6. Epub 1997/07/22. PMID:9223268; PubMed Central PMCID: PMC33712. 22. Zelinskyy G, Robertson SJ, Schimmer S, Messer RJ, Hasenkrug KJ, Dittmer U. CD8+ T-cell
dysfunc-tion due to cytolytic granule deficiency in persistent Friend retrovirus infecdysfunc-tion. J Virol. 2005; 79 (16):10619–26. PMID:16051854.
23. Hasenkrug KJ, Brooks DM, Dittmer U. Critical role for CD4(+) T cells in controlling retrovirus replication and spread in persistently infected mice. J Virol. 1998; 72(8):6559–64. PMID:9658100.
24. Nowinski RC, Emery S, Ledbetter J. Identification of an FMR cell surface antigen associated with murine leukemia virus-infected cells. J Virol. 1978; 26(3):805–12. Epub 1978/06/01. PMID:78990; PubMed Central PMCID: PMC525905.
25. Robertson MN, Miyazawa M, Mori S, Caughey B, Evans LH, Hayes SF, et al. Production of monoclonal antibodies reactive with a denatured form of the Friend murine leukemia virus gp70 envelope protein: use in a focal infectivity assay, immunohistochemical studies, electron microscopy and western blot-ting. J Virol Methods. 1991; 34(3):255–71. Epub 1991/10/01. PMID:1744218.
27. Zelinskyy G, Kraft AR, Schimmer S, Arndt T, Dittmer U. Kinetics of CD8+ effector T cell responses and induced CD4+ regulatory T cell responses during Friend retrovirus infection. Eur J Immunol. 2006; 36 (10):2658–70. PMID:16981182.
28. Li JP, D'Andrea AD, Lodish HF, Baltimore D. Activation of cell growth by binding of Friend spleen focus-forming virus gp55 glycoprotein to the erythropoietin receptor. Nature. 1990; 343(6260):762–4. Epub 1990/02/22. doi:10.1038/343762a0PMID:2154701.
29. Dittmer U, Race B, Hasenkrug KJ. Kinetics of the development of protective immunity in mice vacci-nated with a live attenuated retrovirus. J Virol. 1999; 73(10):8435–40. PMID:10482595.
30. Dong H, Zhu G, Tamada K, Flies DB, van Deursen JM, Chen L. B7-H1 determines accumulation and deletion of intrahepatic CD8(+) T lymphocytes. Immunity. 2004; 20(3):327–36. Epub 2004/03/20. PMID:15030776.
31. Keir ME, Butte MJ, Freeman GJ, Sharpe AH. PD-1 and its ligands in tolerance and immunity. Annu Rev Immunol. 2008; 26:677–704. Epub 2008/01/05. doi:10.1146/annurev.immunol.26.021607.090331 PMID:18173375.
32. Gibbert K, Francois S, Sigmund AM, Harper MS, Barrett BS, Kirchning CJ, et al. Friend retrovirus drives cytotoxic effectors through Toll-like receptor 3. Retrovirology. 2014; 11(1):126. Epub 2014/12/30. doi: 10.1186/s12977-014-0126-4PMID:25539593; PubMed Central PMCID: PMC4299798.
33. Kane M, Case LK, Wang C, Yurkovetskiy L, Dikiy S, Golovkina TV. Innate immune sensing of retroviral infection via Toll-like receptor 7 occurs upon viral entry. Immunity. 2011; 35(1):135–45. Epub 2011/07/ 05. doi:10.1016/j.immuni.2011.05.011PMID:21723157; PubMed Central PMCID: PMC3519935. 34. Gerlach N, Schimmer S, Weiss S, Kalinke U, Dittmer U. Effects of type I interferons on Friend retrovirus
infection. Journal of virology. 2006; 80(7):3438–44. Epub 2006/03/16. doi:10.1128/JVI.80.7.3438– 3444.2006PMID:16537611; PubMed Central PMCID: PMC1440373.
35. Francisco LM, Sage PT, Sharpe AH. The PD-1 pathway in tolerance and autoimmunity. Immunol Rev. 2010; 236:219–42. Epub 2010/07/20. doi: IMR923 [pii] doi:10.1111/j.1600-065X.2010.00923.xPMID: 20636820; PubMed Central PMCID: PMC2919275.
36. Muller U, Steinhoff U, Reis LF, Hemmi S, Pavlovic J, Zinkernagel RM, et al. Functional role of type I and type II interferons in antiviral defense. Science. 1994; 264(5167):1918–21. Epub 1994/06/24. PMID: 8009221.
37. Trabattoni D, Saresella M, Biasin M, Boasso A, Piacentini L, Ferrante P, et al. B7-H1 is up-regulated in HIV infection and is a novel surrogate marker of disease progression. Blood. 2003; 101(7):2514–20. Epub 2002/12/07. doi:10.1182/blood-2002-10-3065PMID:12468426.
38. Schepers K, Toebes M, Sotthewes G, Vyth-Dreese FA, Dellemijn TA, Melief CJ, et al. Differential kinet-ics of antigen-specific CD4+ and CD8+ T cell responses in the regression of retrovirus-induced sarco-mas. J Immunol. 2002; 169(6):3191–9. PMID:12218137.
39. Chen W, Qin H, Chesebro B, Cheever MA. Identification of a gag-encoded cytotoxic T-lymphocyte epi-tope from FBL-3 leukemia shared by Friend, Moloney, and Rauscher murine leukemia virus-induced tumors. J Virol. 1996; 70(11):7773–82. PMID:8892898.
40. Zelinskyy G, Balkow S, Schimmer S, Werner T, Simon MM, Dittmer U. The level of friend retrovirus rep-lication determines the cytolytic pathway of CD8+ T-cell-mediated pathogen control. J Virol. 2007; 81 (21):11881–90. PMID:17728236.
41. Ohlen C, Kalos M, Cheng LE, Shur AC, Hong DJ, Carson BD, et al. CD8(+) T cell tolerance to a tumor-associated antigen is maintained at the level of expansion rather than effector function. J Exp Med. 2002; 195(11):1407–18. Epub 2002/06/05. PMID:12045239.
42. Wherry EJ. T cell exhaustion. Nature immunology. 2011; 12(6):492–9. Epub 2011/07/09. PMID: 21739672.
43. Urbani S, Amadei B, Tola D, Massari M, Schivazappa S, Missale G, et al. PD-1 expression in acute hepatitis C virus (HCV) infection is associated with HCV-specific CD8 exhaustion. J Virol. 2006; 80 (22):11398–403. Epub 2006/09/08. doi:10.1128/JVI.01177-06PMID:16956940; PubMed Central PMCID: PMC1642188.
44. Rutigliano JA, Sharma S, Morris MY, Oguin TH 3rd, McClaren JL, Doherty PC, et al. Highly pathological influenza A virus infection is associated with augmented expression of PD-1 by functionally compro-mised virus-specific CD8+ T cells. J Virol. 2014; 88(3):1636–51. Epub 2013/11/22. doi:10.1128/JVI. 02851-13PMID:24257598; PubMed Central PMCID: PMC3911576.
46. Takamura S, Tsuji-Kawahara S, Yagita H, Akiba H, Sakamoto M, Chikaishi T, et al. Premature terminal exhaustion of Friend virus-specific effector CD8+ T cells by rapid induction of multiple inhibitory recep-tors. J Immunol. 2010; 184(9):4696–707. Epub 2010/03/31. doi: jimmunol.0903478 [pii] doi:10.4049/ jimmunol.0903478PMID:20351188.
47. Zinselmeyer BH, Heydari S, Sacristan C, Nayak D, Cammer M, Herz J, et al. PD-1 promotes immune exhaustion by inducing antiviral T cell motility paralysis. The Journal of experimental medicine. 2013; 210(4):757–74. Epub 2013/03/27. doi:10.1084/jem.20121416PMID:23530125; PubMed Central PMCID: PMC3620347.
48. Frebel H, Nindl V, Schuepbach RA, Braunschweiler T, Richter K, Vogel J, et al. Programmed death 1 protects from fatal circulatory failure during systemic virus infection of mice. The Journal of experimen-tal medicine. 2012; 209(13):2485–99. Epub 2012/12/12. doi:10.1084/jem.20121015PMID:23230000; PubMed Central PMCID: PMC3526355.
49. Penaloza-MacMaster P, Kamphorst AO, Wieland A, Araki K, Iyer SS, West EE, et al. Interplay between regulatory T cells and PD-1 in modulating T cell exhaustion and viral control during chronic LCMV infec-tion. The Journal of experimental medicine. 2014; 211(9):1905–18. Epub 2014/08/13. doi:10.1084/ jem.20132577PMID:25113973.
50. Gerlach N, Gibbert K, Alter C, Nair S, Zelinskyy G, James CM, et al. Anti-retroviral effects of type I IFN subtypes in vivo. European journal of immunology. 2009; 39(1):136–46. Epub 2009/01/09. doi:10. 1002/eji.200838311PMID:19130550.
51. Planes R, BenMohamed L, Leghmari K, Delobel P, Izopet J, Bahraoui E. HIV-1 Tat Protein Induces PD-L1 (B7-H1) Expression on Dendritic Cells through Tumor Necrosis Factor Alpha- and Toll-Like Receptor 4-Mediated Mechanisms. J Virol. 2014; 88(12):6672–89. Epub 2014/04/04. doi:10.1128/JVI. 00825-14PMID:24696476; PubMed Central PMCID: PMC4054384.
52. Benedict CA, Loewendorf A, Garcia Z, Blazar BR, Janssen EM. Dendritic cell programming by cyto-megalovirus stunts naive T cell responses via the PD-L1/PD-1 pathway. Journal of immunology. 2008; 180(7):4836–47. Epub 2008/03/21. PMID:18354207; PubMed Central PMCID: PMC2637915. 53. McNally B, Ye F, Willette M, Flano E. Local blockade of epithelial PDL-1 in the airways enhances T cell
function and viral clearance during influenza virus infection. J Virol. 2013; 87(23):12916–24. Epub 2013/09/27. doi:10.1128/JVI.02423-13PMID:24067957; PubMed Central PMCID: PMC3838157. 54. Jin YH, Hou W, Kang HS, Koh CS, Kim BS. The role of interleukin-6 in the expression of PD-1 and
PDL-1 on central nervous system cells following infection with Theiler's murine encephalomyelitis virus. J Virol. 2013; 87(21):11538–51. Epub 2013/08/24. doi:10.1128/JVI.01967-13PMID:23966393; PubMed Central PMCID: PMC3807328.
55. Heinecke L, Proud D, Sanders S, Schleimer RP, Kim J. Induction of B7-H1 and B7-DC expression on airway epithelial cells by the Toll-like receptor 3 agonist double-stranded RNA and human rhinovirus infection: In vivo and in vitro studies. J Allergy Clin Immunol. 2008; 121(5):1155–60. Epub 2008/04/02. doi:10.1016/j.jaci.2008.02.009PMID:18378285; PubMed Central PMCID: PMC2810151.
56. Driessens G, Kline J, Gajewski TF. Costimulatory and coinhibitory receptors in anti-tumor immunity. Immunological reviews. 2009; 229(1):126–44. Epub 2009/05/12. doi:10.1111/j.1600-065X.2009. 00771.xPMID:19426219; PubMed Central PMCID: PMC3278040.
57. Spranger S, Spaapen RM, Zha Y, Williams J, Meng Y, Ha TT, et al. Up-regulation of PD-L1, IDO, and T (regs) in the melanoma tumor microenvironment is driven by CD8(+) T cells. Sci Transl Med. 2013; 5 (200):200ra116. Epub 2013/08/30. doi:10.1126/scitranslmed.3006504PMID:23986400; PubMed Central PMCID: PMC4136707.
58. Robertson SJ, Ammann CG, Messer RJ, Carmody AB, Myers L, Dittmer U, et al. Suppression of acute anti-friend virus CD8+ T-cell responses by coinfection with lactate dehydrogenase-elevating virus. J Virol. 2008; 82(1):408–18. Epub 2007/10/26. doi: JVI.01413-07 [pii] doi:10.1128/JVI.01413-07PMID: 17959678.
59. Lilly F, Steeves RA. B-tropic Friend virus: a host-range pseudotype of spleen focus-forming virus (SFFV). Virology. 1973; 55(2):363–70. PMID:4742777.
60. D'Souza M, Fontenot AP, Mack DG, Lozupone C, Dillon S, Meditz A, et al. Programmed death 1 expression on HIV-specific CD4+ T cells is driven by viral replication and associated with T cell dys-function. Journal of immunology. 2007; 179(3):1979–87. Epub 2007/07/21. PMID:17641065. 61. Barber DL, Wherry EJ, Ahmed R. Cutting edge: rapid in vivo killing by memory CD8 T cells. J Immunol.
2003; 171(1):27–31. Epub 2003/06/21. PMID:12816979.
62. Cobbold SP, Waldmann H. Therapeutic potential of monovalent monoclonal antibodies. Nature. 1984; 308(5958):460–2. PMID:6608694.