Breast Cancer Cells
Hatem Soliman1*, Farah Khalil2, Scott Antonia3
1Department of Women’s Oncology and Experimental Therapeutics, Moffitt Cancer Center, Tampa, Florida, United States of America,2Department of Anatomic Pathology, Moffitt Cancer Center, Tampa, Florida, United States of America,3Department of Thoracic Oncology and Immunology, Moffitt Cancer Center, Tampa, Florida, United States of America
Abstract
Background:Tumor cells express programmed death ligand 1 (PD-L1) and is a key immune evasion mechanism. PD-L1 expression in multiple breast cancer cell lines was evaluated to identify intrinsic differences that affect their potential for immune evasion.
Methods:PD-L1 expression was analyzed in six breast cancer cell lines: AU565&MCF7 (luminal), BT20&HCC1143 (basal A), MDA231&HCC38 (basal B). Surface and intracellular PD-L1 expression+/2interferoncfor 48 hours was measured by flow cytometry. PD-L1 gene expression data for all breast cancer cell lines in the Comprehensive Cell Line Encyclopedia (CCLE) was analyzed. Correlation between PD-L1 levels and clinicopathologic parameters was analyzed within Oncomine datasets. A tissue microarray containing 61 invasive breast cancer primary tumor cores was stained for PD-L1 expression and analyzed.
Results:Basal breast cancer cells constitutively express the highest levels of PD-L1. All cell lines increased PD-L1 expression with interferonc, but basal B cells (MDA-231 and HCC38) demonstrated the largest increases. There were no differences in protein localization between cell lines. In the CCLE data, basal cell lines demonstrated higher mean PD-L1 expression compared to luminal cell lines. High PD-L1 expressing basal cell lines over-express genes involved in invasion, proliferation, and chemoresistance compared to low PD-L1 basal cell lines. High PD-L1 basal cell lines had lower expression of IRF2BP2 and higher STAT1 levels compared to low PD-L1 expressing cell lines. Within Oncomine datasets PDL1 mRNA levels were higher in basal type tumors. The TMA analysis demonstrated that lymph node positive cases had higher levels of PD-L1 protein expression compared to lymph node negative cases.
Conclusions:Basal type breast cancer (especially basal B) express greater levels of PD-L1 constitutively and with IFNc. High PD-L1 basal cells over-express genes involved in invasion, motility, and chemoresistance. Targeting PD-L1 may enhance eradication of aggressive breast cancer cells by the immune system.
Citation:Soliman H, Khalil F, Antonia S (2014) PD-L1 Expression Is Increased in a Subset of Basal Type Breast Cancer Cells. PLoS ONE 9(2): e88557. doi:10.1371/ journal.pone.0088557
Editor:Rajeev Samant, University of Alabama at Birmingham, United States of America
ReceivedNovember 21, 2013;AcceptedJanuary 7, 2014;PublishedFebruary 14, 2014
Copyright:ß2014 Soliman et al. This is an open-access article distributed under the terms of the Creative Commons Attribution License, which permits unrestricted use, distribution, and reproduction in any medium, provided the original author and source are credited.
Funding:This work was funded through the Moffitt Foundation. The funders had no role in study design, data collection and analysis, decision to publish, or preparation of the manuscript.
Competing Interests:The authors have declared that no competing interests exist.
* E-mail: [email protected]
Introduction
Programmed cell death 1 ligand 1 (PD-L1, CD274, B7-H1) is encoded by the CD274 gene on chromosome nine under the control of an interferon regulatory factor 1 (IRF1) and Signal Transducer Activation of Transcription 1 (STAT1) response elements within its promoter. [1] PD-L1 is a 40kDa transmem-brane protein that is expressed on a wide variety of normal tissues including natural killer cells, macrophages, myeloid dendritic cells, B cells, epithelial cells, and vascular endothelial cells. [2] Its normal physiologic role is to bind programmed death 1 receptors (PD-1) expressed on the surface of activated cytotoxic T cells. This binding causes inhibition of IL-2 production and T cell activation through reduced phosphorylation of ZAP70 and PKCh. [3] The PD-1/PD-L1 interaction serves as an important regulatory check
against an excessive adoptive immune response to antigens and autoimmunity. [4].
negative and basal), they are not synonymous. We sought to explore this question further by looking at different breast cancer cell lines classified as luminal or basal. Furthermore, looking at the cancer cell lines without the influence of tumor stroma or immune infiltrates would provide additional information on intrinsic tumor cell properties that are associated with PD-L1 expression. This study identified a subset of basal breast cancer cells lines with much higher PD-L1 expression compared to other basal and luminal cell lines. Molecular and pathologic data suggests that these high PD-L1 expressing cells may behave in a more invasive and aggressive fashion. Not only would this data be informative for in vitro immunology assays that use breast cancer cell lines, but could be informative in breast cancer clinical research of PD-1/ PD-L1 blockade as well.
Methods
Cell culture conditions
Assay ready cells were obtained from American Type Culture Collection (ATCC, Manassas VA) and are shown in Table 1.
Flow cytometry for PD-L1 expression, protein localization
Assay ready cell lines (ATCC) were treated with 10ng interferon gamma (IFN c) (R&D) for 48 hours. After which they were
harvested and counted. 20uL of anti-PD-L1 FITC (BD Bioscience) was added for 1 hour at 4C. Cells were washed and stained with PI (Invitrogen). Data acquisition was performed on a LSR II with FACSDiva software (BD Bioscience). Data analysis was performed using FloJo software (Tree Star). Mean fluorescence intensity (MFI) was determined by gating on live cells and subtracting background (isotype) MFI.
For intracellular flow cells were treated the same as above except they were stained with Live/dead violet fixable dye (Invitrogen) for 30 min prior to addition of PDL1 for surface staining. After surface stain cells were washed and fixed in 4% paraformaldahyde for 15 minutes. Washed and treated with Perm buffer (BD Bioscience) for 30 minutes then stained with 20 uL anti-PD-L1 for another hour at 4uC. Cells were then washed and flow was ran the same as above. Intracellular protein was calculated by subtracting the MFI of fully stained samples from surface only stained samples.
Comprehensive cell line encyclopedia (CCLE) data analysis
The data was accessed at the following URL: http://www. broadinstitute.org/ccle/home. Using the GENE-E analysis tool on the website, the expression dataset of all breast cancer cell lines was downloaded. Two sided, unpaired T test was used to compare the mean Robust Multi-array Average (RMA) expression levels between basal and non-basal cell lines. The Gene Set Enrichment Analysis (GSEA) tool in the CCLE database was then used to compare differential genes expressed between two groups of high (BT20, CAL120, CAL851, HCC1954, HCC70, HS578T, MB-231,HDQ-P1, HCC1937,HCC38, MB-436, BT-549) versus low (DU4475, CAL51, HCC1143, HCC1187, HCC1569, HCC1395, HCC1500, HCC1599, HCC2157, MB-157, MB-468, HCC1806) PD-L1 expressing basal cell lines on Affymetrix U133+2 CEL file data. The groups were separated by the median PDL1 RMA expression level for the group. The cutoff used for enriched pathways within high PDL1 expressing cell lines was a false discovery rate of,25%, and the genes listed within the individual pathways are those which contributed the most to the enrichment score for each pathway listed. The listed individual genes were
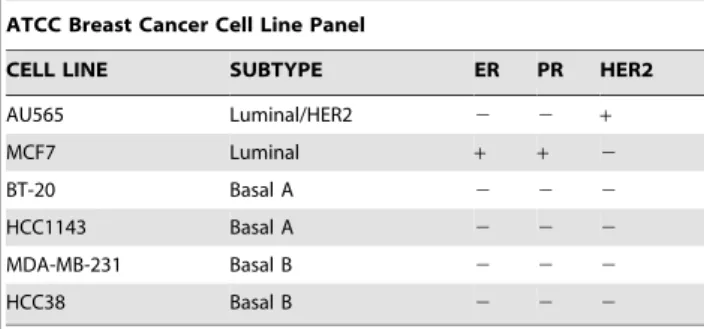
Table 1.ATCC cell lines used in the flow cytometry analysis.
ATCC Breast Cancer Cell Line Panel
CELL LINE SUBTYPE ER PR HER2
AU565 Luminal/HER2 2 2 +
MCF7 Luminal + + 2
BT-20 Basal A 2 2 2
HCC1143 Basal A 2 2 2
MDA-MB-231 Basal B 2 2 2
HCC38 Basal B 2 2 2
doi:10.1371/journal.pone.0088557.t001
Figure 1. PD-L1 expression across the six different ATCC cell lines. Basal subtypes (especially basal B) demonstrated much greater constitutive PD-L1 expression than luminal subtypes. Treatment with IFNccaused PD-L1 expression to increase in all cell lines but basal subtypes demonstrated much greater inducible levels of PD-L1.
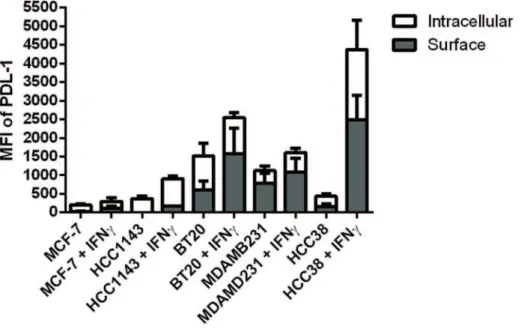
Figure 2. PD-L1 protein localization at baseline and post IFNctreatment.PD-L1 protein expression increases with treatment, but there does
not appear to be a major shift in protein localization patterns (proportion of surface vs. surface+intracellular) between the different cell lines and molecular subtypes.
doi:10.1371/journal.pone.0088557.g002
Figure 3. PD-L1 mRNA expression across multiple cell lines in the CCLE database.Basal cell lines as a group had statistically higher mean PD-L1 expression levels compared to non-basal subtypes.
designated ‘‘core enriched’’ by the GSEA algorithm. Documentation regarding these criteria recommended by the GSEA tool is available online at http://www.broadinstitute.org/cancer/software/gsea/ wiki/index.php/Main_Page. Mutation analysis was done by tabu-lating all the somatic mutations for the PD-L1 high and PD-L1 low basal cell lines documented in CCLE and looking for exclusive mutations in either the high or low group which had functional relevance. The STAT1 and IRF2BP2 gene expression analysis between high versus low PD-L1 groups used unpaired T tests with a two sided p value and descriptive statistics were generated along with 95% confidence intervals.
Oncomine analysis
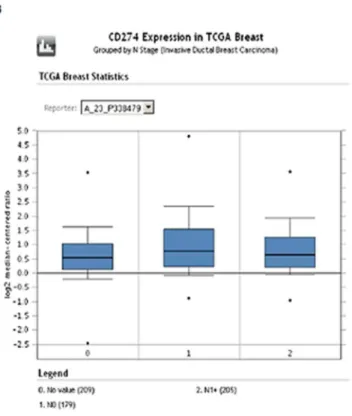
Oncomine (Compendia Bioscience, Ann Arbor, MI) was used for analysis and visualization of the Cancer Genome Atlas and Gluck annotated breast cancer datasets (http://www.oncomine. org). PD-L1 RNA expression levels were displayed using log2 median centered ratio boxplots for triple negative vs. non triple negative, PAM50 molecular subtypes, and nodal status (node2vs. node+).
Tissue microarray PD-L1 analysis
A slide was cut from a pre-existing invasive ductal carcinoma TMA maintained by the Moffitt tissue core (breast 2B) with de-identified clinical information (age, TNM stage, histology, estrogen receptor status, progesterone receptor status, human epithelial growth receptor 2 status (HER2), grade) annotated for each of the 61 available cores. This work was conducted under the review and approval of the University of South Florida Institutional Review Board-Human Research Protection committee (FWA#00001669) under protocol number MCC16015. The informed consent requirement was waived as these were archival, de-identified, annotated tissue specimens from a pre-existing TMA maintained by the Moffitt Tissue Core. No patient specific protected health information was used in the analysis.
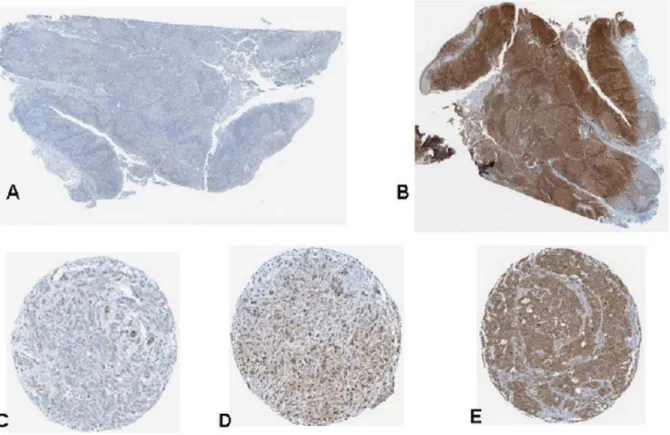
Immunohistochemical staining
Slides were stained using a Ventana Discovery XT automated system (Ventana Medical Systems, Tucson, AZ) as per manufac-turer’s protocol with proprietary reagents. Briefly, slides were deparaffinized on the automated system with EZ Prep solution (Ventana). Heat-induced antigen retrieval method was used in Cell Conditioning 1 (Ventana). The rabbit primary antibody that reacts
to PD-L1, (#10084-R015, Sino Biological, China) was used at a 1:200 concentration in Dako antibody diluent (Carpenteria, CA) and incubated for 60 min. The Ventana OmniMap Anti-Rabbit Secondary Antibody was used for 16 min. The detection system used was the Ventana ChromoMap kit and slides were then counterstained with hematoxylin. Slides were then dehydrated and coverslipped as per normal laboratory protocol. Scoring of PD-L1 was performed using digital image analysis software (Aperio Spectrum System) and positive pixel scoring algorithm version 9. The PD-L1 score used in the analysis was total positive pixel counts for PD-L1 within the core divided by the total pixel count multiplied by 100. A pathologist (FK) independently scored the tissue as a quality control on the image analysis scoring algorithm. Statistical analysis of the mean PD-L1 expression level (as a continuous variable) was compared between estrogen receptor (+/2), grade K vs. 3, and node status (N0/N1–3) using a nonparametric Kolmogorov-Smirnov test comparing cumulative distributions with Graphpad Prism 6 software. HER2 was not evaluated due to insufficient number of positive cases on the microarray for meaningful comparison.
Results
Flow cytometry analysis of PD-L1 expression across the six ATCC cell lines
As shown in Figure 1, there were considerable differences in both constitutive and IFN c induced PD-L1 surface expression as measured by mean fluorescence intensity between the cell lines. The two luminal subtypes (MCF-7 and AU565) had the lowest levels of expression. The HCC1143 basal A cell line had low constitutive expression but significantly upregulated PD-L1 in response to IFN
c. BT20 had higher constitutive and inducible expression when compared to luminal subtypes. The highest constitutive expression was seen in the basal B MB-231 cells. Both basal B cell lines had the greatest levels of IFNcinducible PD-L1 expression, especially with HCC38 cells. The results were very reproducible and the results shown are from the experiment run in triplicate. Representative flow data for one of the runs is provided in figure S1.
Flow cytometry analysis of PD-L1 protein localization in the ATCC cell lines
We sought to determine if the difference in surface PD-L1 expression between the different cell lines was due to preferential localization of the protein to the cell surface or just reflective of overall increased amounts of total protein expression. Figure 2 shows the results of our flow cytometry analysis to quantify the cell surface and intracellular fractions of PD-L1 protein across the different cell lines. The same pattern of higher constitutive and inducible PD-L1 expression in the basal cell lines compared to the luminal cell lines was seen. It appears that the amount of surface PD-L1 expression in all six cell lines tested was representative of the overall amount of protein expression. Furthermore it appears that treatment with IFNc did not result in a significant shift in the proportion of surface versus intracellular protein when compared to the constitutive PD-L1 expression for each cell line. Representative flow data for protein localization in BT20, HCC1143, HCC38, and MB-231 cell lines is provided in figures S2-1 and S2-2.
PD-L1 mRNA expression in multiple breast cancer cell lines within the CCLE database
The gene expression data for all the breast cancer cell lines within the CCLE database was studied to see if the pattern of
Figure 4. High PD-L1 expressing basal breast cancer cell lines (N = 12) demonstrate higher levels of STAT1 expression and lower levels of IRF2BP2 compared to low PD-L1 expressing cell lines (N = 12).Error bars are 95% CI.
Table 2.Differentially expressed genes associated with high L1 expressing basal breast cancer cell lines compared to low PD-L1 expressing basal breast cancer cell lines in CCLE GSEA analysis.
GSEA ENRICHED PATHWAYS
AMINO ACID SUGARS
METABOLISM IL6 SIGNALING
GNE glucosamine (UDP-N-acetyl)-2-epimerase/N-acetylmannosamine kinase
IL6 interleukin 6
CTBS chitobiase, di-N-acetyl- JAK2 Janus kinase 2
HK2 hexokinase 2 JAK1 Janus kinase 1
MTMR2 myotubularin related protein 2 IL6ST interleukin 6 signal transducer
NANS N-acetylneuraminic acid synthase STAT3 signal transducer and activator of transcription 3
CYB5R1 cytochrome b5 reductase 1 SHC1 SHC (Src homology 2 domain containing)
transforming protein 1
HK1 hexokinase 1 MAPK3 mitogen-activated protein kinase 3
MTMR6 myotubularin related protein 6 INTEGRIN
PATHWAY
NAGK N-acetylglucosamine kinase CAV1 caveolin 1, caveolae protein
CMAS cytidine monophosphate
N-acetylneuraminic acid synthetase
FYN FYN oncogene related to SRC, FGR, YES
CYB5R3 cytochrome b5 reductase 3 RAP1A RAP1A, member of RAS oncogene family
HEXB hexosaminidase B (beta polypeptide) PXN paxillin
UAP1 UDP-N-acteylglucosamine pyrophosphorylase 1 ACTA1 actin, alpha 1, skeletal muscle
BLOOD CLOTTING ZYX zyxin
SERPINE1 serpin peptidase inhibitor, clade E, member 1 ACTN1 actinin, alpha 1
SERPINB2 serpin peptidase inhibitor, clade B, member 2 BCAR1 breast cancer anti-estrogen resistance 1
PLAU plasminogen activator, urokinase CAPN1 calpain 1, (mu/I) large subunit
PLAT plasminogen activator, tissue VCL vinculin
FGG fibrinogen gamma chain ROCK1 Rho-associated, coiled-coil containing protein kinase 1
GATA3 PATHWAY MAP2K2 mitogen-activated protein kinase kinase 2
GATA3 GATA binding protein 3 CAPNS1 calpain, small subunit 1
PRKAR2B protein kinase, cAMP-dependent, regulatory, type II, beta
ACTN3 actinin, alpha 3
PRKAR2A protein kinase, cAMP-dependent, regulatory, type II, alpha
MAPK1 mitogen-activated protein kinase 1
PRKACB protein kinase, cAMP-dependent, catalytic, beta
MCALPAIN PATHWAY
JUNB jun B proto-oncogene EGFR epidermal growth factor receptor
MAP2K3 mitogen-activated protein kinase kinase 3 CAPN2 calpain 2, (m/II) large subunit
G COUPLED PROTEIN RECEPTORS
RHO PATHWAY
FOS v-fos FBJ murine osteosarcoma viral oncogene homolog
ARPC1B actin related protein 2/3 complex, subunit 1B
JUN jun oncogene GSN gelsolin
PPP3CA protein phosphatase 3, catalytic subunit, alpha isoform
ACTR3 ARP3 actin-related protein 3 homolog (yeast)
GNGT1 guanine nucleotide binding protein, gamma transducing activity polypeptide 1
ARHGEF1 Rho guanine nucleotide exchange factor (GEF) 1
MAP2K1 mitogen-activated protein kinase kinase 1 LIMK1 LIM domain kinase 1
PRKCA protein kinase C, alpha ARHGAP4 Rho GTPase activating protein 4
RPS6KA3 ribosomal protein S6 kinase, polypeptide 3 ARHGEF5 Rho guanine nucleotide exchange factor (GEF) 5
CALM3 calmodulin 3 (phosphorylase kinase, delta) ARHGAP1 Rho GTPase activating protein 1
HRAS v-Ha-ras Harvey rat sarcoma viral oncogene homolog
TLN1 talin 1
HYPERTROPHY ARPC2 actin related protein 2/3 complex, subunit 2
higher PD-L1 expression in basal cell lines could be confirmed in a larger dataset. Figure 3 shows the RMA expression level of PD-L1 for basal and non-basal breast cancer cell lines. The mean RMA value of the basal cell lines was significantly greater than the non-basal group (6.37 versus 4.6, p = .002). It was noted that there were basal breast cancer cell lines that had lower expression of PD-L1 mRNA similar to the non-basal cell lines. Based on this observation, a GSEA gene analysis was run to find genes differentially expressed in high PD-L1 expressing basal cell lines as compared to the low expressing basal cell lines. Table 2 lists the pathways identified by GSEA (along with their corresponding genes) as being significantly enriched within the high PD-L1 expressing cell lines. Of particular note there were multiple pathways (MCALPAINPATHWAY, INTEGRINPATHWAY, RHOPATHWAY) involved in cytoskeleton interactions and cell motility required for invasiveness. Four pathways involved in immune mediated signaling (GATA3PATHWAY, HYPERTRO-PHY, and IL6PATHWAY) were found as well. Finally, genes involved in coagulation (BLOOD_CLOTTING) including serpin peptidase inhibitor, clade E member 1 (SERPINE1) and plasminogen activator, urokinase (PLAU) were enriched in the high PD-L1 group. Since PD-L1 has interferon and STAT1 response elements within its promoter we analyzed multiple mRNA levels of proteins known to regulate IFNc induced expression in 24 basal cell lines divided into two groups of twelve based on the median PD-L1 expression level. There was a trend for higher mean STAT1 expression in high versus low PD-L1 expressing cell lines (9.19 (CI 95% = 8.59–9.79) and 8.38 (CI 95% = 7.88–8.87), p = .03). Also, mean interferon regulatory factor 2 binding protein 2 (IRF2BP2) trended lower in the high PD-L1 group compared to the low PD-L1 group of cell lines (9.66 (CI 95% = 9.26–10.07) and 10.18 (CI 95% = 9.93–10.43), p = .02). (Figure 4) IRF2 is a negative regulator of IFNc induced gene expression, and IRF2BP2 acts as a co-repressor protein along with IRF2 to more effectively silence IFNcinduced gene expression. [11,12] This pattern of higher STAT1/lower IRF2BP2 expression may partially explain the higher constitutive PD-L1 levels observed in some basal cell lines. Somatic mutations between the high PD-L1 and low PD-L1 basal cell lines were compared and there were no unique functional mutations or polymorphisms found in either group. This likely suggests there isn’t one dominant driver mutation which accounts for differences in PD-L1
expression between the different basal cell lines. The gene expression data file from CCLE is provided in file S1.
Relationship between PD-L1 expression by mRNA, immunohistochemistry and clinicopathologic factors in patient samples
The box plot data from the Oncomine analysis are shown in Figure 5. Triple negative breast cancer samples in TCGA had a higher log2 median expression compared to non-triple negative 1.28 (2.27–4.80) versus.60 (2.97–3.17). Median expression between node positive and node negative samples did not appear different. Molecular subtyping within the Gluck dataset showed lower median log2 levels in luminal A subsets (.33 (2.90–1.26)) compared to basal (.72 (2.60–3.32)).
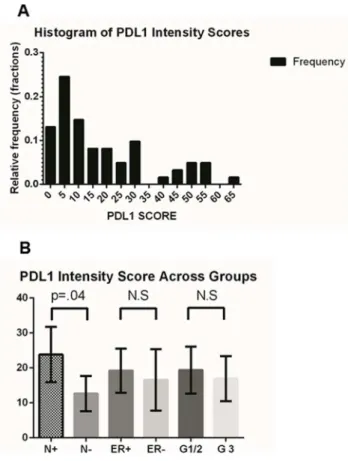
Sixty one invasive breast cancer primary tumors were examined using immunohistochemistry for PD-L1 expression in a tissue microarray using a digital image analysis algorithm. (Figure 6) The software demonstrated an excellent ability to localize protein expression within the various cores. Concordance with pathologist scoring in terms of relative intensity (absent/low, intermediate, and high) was.90%. The distribution frequency of PD-L1 scores was mostly clustered in the low-intermediate range and is shown in Figure 7a. We were not able to find a statistically significant difference in PD-L1 expression between ER+ and ER- breast cancer primaries on our TMA in contrast to earlier published reports. However, the mean PD-L1 expression value of the node positive group trended higher (23.82, 95% CI = 15.93–31.71) than node negative breast cancers (12.62, 95% CI = 7.59–17.64) with a p = .04 (Figure 7b). There were no other statistically significant differences in PD-L1 expression level in the other clinicopathologic parameters. It should be noted though that the power of the analysis was somewhat limited due to the depletion of some of the cores in the TMA which reduced the number of samples available. This association needs to be tested further in larger annotated tissue sets.
Discussion
The data demonstrates basal subtype cell lines generally have higher constitutive expression levels compared to luminal cell lines. Those cell lines with relatively high constitutive PD-L1 expression also appear to produce much more surface PD-L1 in response to
Table 2.Cont.
GSEA ENRICHED PATHWAYS
AMINO ACID SUGARS
METABOLISM IL6 SIGNALING
CYR61 cysteine-rich, angiogenic inducer, 61 ARPC4 actin related protein 2/3 complex, subunit 4
HBEGF heparin-binding EGF-like growth factor DIAPH1 diaphanous homolog 1 (Drosophila)
ANKRD1 ankyrin repeat domain 1 MYL2 myosin, light chain 2, regulatory, cardiac, slow
WDR1 WD repeat domain 1 PFN1 profilin 1
DUSP14 dual specificity phosphatase 14 CFL1 cofilin 1 (non-muscle)
MYLK myosin, light chain kinase
ACTR2 ARP2 actin-related protein 2 homolog (yeast)
THROMBOPOETIN PATHWAY
STAT1 signal transducer and activator of transcription 1
Figure 5. Oncomine box plot RNA expression data for PD-L1 (CD274) shown within the TCGA (Fig 5A. TNBC and Fig 5B. nodal status) and Fig 5C. Gluck datasets (PAM50 data).
IFNc. The observed variation in PD-L1 surface expression between cell lines is not because of differences in cell membrane protein localization but rather due to differences in overall PD-L1 expression. The cell line data also suggests that there are intrinsic differences between different breast cancers which lead to increased PD-L1 expression on the tumor cells independent of the tumor microenvironment. The combination of higher STAT1/lower IRFBP2 gene expression levels is one such mechanism which could explain this difference. Additional investigation is ongoing to confirm this hypothesis. It should be made clear that multiple pathways besides IFNcactivated JAK/ STAT signaling can affect PD-L1 expression in tumor cells. Signaling through key proliferative pathways such as MEK/ERK and PI3K/AKT can also increase PD-L1 expression. [13] Understanding which tumors have a genetic propensity to greatly up-regulate PD-L1 expression is important because the expression of PD-L1 is fluid and can vary within different regions of the same tumor over time. This tumor heterogeneity can lead to false negative PD-L1 immunohistochemistry testing if the sampled region of the tumor happened to have a temporarily lower level of PD-L1 expression at that time. Clinical trials are using PD-L1 immunohistochemistry as a predictive biomarker for PD-1 blockade, but it is clear that this marker alone is not able to identify all those who would benefit from this therapy. Identifying additional biomarkers that would predict either high constitutive or inducible PD-L1 in a tumor would aid in better selecting patients for treatment with PD-1/PD-L1 antibodies.
Analysis of the CCLE expression data supports the hypothesis that basal cells with high PD-L1 differentially express several genes implicated in invasion, chemotherapy resistance, and metastatic potential. This is especially the case with some of the INTEGRIN
(CAV1, PXN, ZYX, VCL), RHO (TLN1, CFL1), and calpain1/2 genes.[14–21] Basal B breast cancer cell lines have been shown to be more invasive in Boyden chamber experiments, providing more evidence that high PD-L1 cell lines behave in a more invasive manner. [22] Cells that are highly proliferative, invasive, and able to effectively evade cytotoxic T cells would have a greater selective advantage and likely contribute more to the progression of breast cancer. The higher expression of PD-L1 in our TMA lymph node positive breast tumors would suggest that this is the case. While the Oncomine TGCA dataset did not show a higher median PD-L1 expression in the node positive tumors, this could have been due to factors such as differences in tumor sampling, intratumoral heterogeneity, and differences between mRNA and corresponding protein levels. Additional analysis of larger annotated breast cancer tissue sets looking at both genomic and proteomic aspects of PD-L1 expression will need to be carried out to confirm any associations with clinicopathologic factors. So PD-L1 can be thought of as a potential biomarker for highly invasive breast cancer cells within a tumor that can be targeted by the immune system via PD-L1 antibodies. While these cells are only a fraction of the total number of cells within a tumor, they likely contribute disproportionately more to the progression of metastatic disease. This means that clinical trials using PD-L1 targeting agents should be powered not only to look at objective response rates using these agents but also the impact on overall survival.
It has become very clear that malignant cells must be able to successfully evade immune surveillance in order to progress and metastasize. Tumor cells use a variety of different pathways to achieve this goal including overexpression of certain cytokines (IL-4, IL-10, TGFB), catabolic enzymes such as indoleamine 2,3 dioxygenase, and also by upregulation of surface PD-L1 expression.
This work suggests that as certain breast cancer cells within a tumor increase their invasive potential, they also increase their ability to evade immune surveillance and form distant metastases. Future research will need to look at the role of PD-L1 expression in models of invasion, epithelial-mesenchymal transition, and in patients with circulating tumor cells available for analysis. Effective immune eradication of these highly invasive cells via PD-L1 antibody therapy may prove to be an effective strategy for limiting the progression of micrometastatic breast cancer.
Conclusions
N
A subset of basal type breast cancer cell lines express higher levels of PD-L1 compared to other basal and luminal breast cancer cell lines. These high expressing PD-L1 basal cells differentially express genes involved in motility, invasion, and drug resistance at a higher level compared to low PD-L1 expressing basal cell lines.N
One possible mechanism for the higher constitutive expression of PD-L1 in certain basal breast cancer cell lines is higher levels of STAT1 and lower levels of IRF2BP2 expression.N
This data suggests that immune evasion and increased metastatic potential through processes like epithelial to mesenchymal transition in tumor cells are linked. Use of PD-L1 blockade in clinical trials may selectively target these aggressive clones for immune destruction and improve outcomes.Supporting Information
Figure S1 Flow cytometry data for surface expression of PD-L1 in six breast cancer cell lines+/2 IFN gamma treatment for 48 hours.
(TIF)
Figure S2 Protein localization flow cytometry data for basal cell lines.The fluorescence curves and MFI values shown in the legends are isotype surface and intracellular staining, then PD-L1 mAB surface+isotype intracellular staining, followed by PD-L1 mAB surface+PD-L1 mAB intracellular staining. (TIF)
Acknowledgments
We would like to thank Noel Clark for his assistance with the immunohistochemistry work. CK Zhang with ATCC for graciously providing the assay ready breast cancer cells used in this study.
Author Contributions
Conceived and designed the experiments: HS FK SA. Performed the experiments: HS FK. Analyzed the data: HS FK SA. Contributed reagents/materials/analysis tools: HS. Wrote the paper: HS.
References
1. Lee SJJB, Lee SW, Yang YI, Suh SI, Park YM, et al. (2008) Interferon regulatory factor-1 is prerequisite to the constitutive expression and IFN-gamma-induced upregulation of B7-H1 (CD274). FEBS Lett: 755–762. 2. Butte MJ P-CV, Kim MJ, Freeman GJ, Sharpe AH (2007) Interaction of human
PD-L1 and B7–1. Molecular immunology: 3567–3572.
3. Sheppard KAFL, Lee JM, Benander C, George JA, Wooters J, et al. (2004) PD-1 inhibits T-cell receptor induced phosphorylation of the ZAP70/CD3zeta signalosome and downstream signaling to PKCtheta. FEBS Lett: 37–41. 4. Mozaffarian NWA, Stevens AM (2008) Active systemic lupus erythematosus is
associated with failure of antigen-presenting cells to express programmed death ligand-1. Rheumatology: 1335–1341.
5. Droeser RA HC, Viehl CT, Frey DM, Nebiker C, Huber X, et al. (2013) Clinical impact of programmed cell death ligand 1 expression in colorectal cancer. Eur J Cancer: 123–128.
6. Chen YB MC, Huang JA (2012) Clinical significance of programmed death-1 ligand-1 expression in patients with non-small cell lung cancer: a 5-year-follow-up study. Tumori: 751–755.
7. Hamanishi JMM, Iwasaki M, Okazaki T, Tanaka Y, Yamaguchi K, et al. (2008) Programmed cell death 1 ligand 1 and tumor-infiltrating CD8+T lymphocytes
are prognostic factors of human ovarian cancer. Proc Natl Acad Sci USA: 3360– 3365.
8. Ghebeh HMS, Al-Omair A, Qattan A, Lehe C, Al-Qudaihi G, et al. (2006) The B7-H1 (PD-L1) T lymphocyte-inhibitory molecule is expressed in breast cancer patients with infiltrating ductal carcinoma: correlation with important high-risk prognostic factors. Neoplasia: 190–198.
9. Ghebeh HBE, Tulbah A, Elkum N, Al-Tweigeri T, Dermime S (2008) FOXP3+ Tregs and B7-H1+/PD-1+T lymphocytes co-infiltrate the tumor tissues of high-risk breast cancer patients: Implication for immunotherapy. BMC Cancer: 57. 10. Parsa AT, Waldron JS, Panner A, Crane CA, Parney IF, et al. (2007) Loss of
tumor suppressor PTEN function increases B7-H1 expression and immunore-sistance in glioma. Nat Med 13: 84–88.
11. Teng AC, Al-Montashiri NA, Cheng BL, Lou P, Ozmizrak P, et al. (2011) Identification of a phosphorylation-dependent nuclear localization motif in interferon regulatory factor 2 binding protein 2. PLoS One 6: e24100. 12. Carneiro FR, Ramalho-Oliveira R, Mognol GP, Viola JP (2011) Interferon
regulatory factor 2 binding protein 2 is a new NFAT1 partner and represses its transcriptional activity. Mol Cell Biol 31: 2889–2901.
13. Hasan AGH, Lehe C, Ahmad R, Dermime S (2011) Therapeutic targeting of B7-H1 in breast cancer. Expert Opin Ther Targets: 1211–1225.
Figure 7. PD-L1 expression in node negative and node positive breast cancer tissue microarray samples. Figure 7a shows the distribution of PD-L1 scores across the 61 TMA samples. Figure 7b shows the mean PD-L1 expression was significantly higher in node positive (N+) compared to node negative (N2) cases overall (error bars are 95% CI).
doi:10.1371/journal.pone.0088557.g007
File S1 CCLE gene expression data for cell lines.
14. Aoudjit F and Vuori K (2012) Integrin signaling in cancer cell survival and chemoresistance. Chemother Res Pract 2012: 283181.
15. Burbelo P, Wellstein A, Pestell RG (2004) Altered Rho GTPase signaling pathways in breast cancer cells. Breast Cancer Res Treat 84: 43–48. 16. Cortesio CL, Chan KT, Perrin BJ, Burton NO, Zhang S, et al. (2008) Calpain 2
and PTP1B function in a novel pathway with Src to regulate invadopodia dynamics and breast cancer cell invasion. J Cell Biol 180: 957–971. 17. Patani N, Martin LA, Reis-Filho JS, Dowsett M (2012) The role of caveolin-1 in
human breast cancer. Breast Cancer Res Treat 131: 1–15.
18. Cai H, Zhang T, Tang WX, Li SL (2010) [Expression of paxillin in breast cancer cell with high and low metastatic potentiality]. Sichuan Da Xue Xue Bao Yi Xue Ban 41: 91–94.
19. Sakamoto S, McCann RO, Dhir R, Kyprianou N (2010) Talin1 promotes tumor invasion and metastasis via focal adhesion signaling and anoikis resistance. Cancer Res 70: 1885–1895.
20. Hirata H, Tatsumi H, Sokabe M (2008) Zyxin emerges as a key player in the mechanotransduction at cell adhesive structures. Commun Integr Biol 1: 192– 195.
21. Wang W, Eddy R, Condeelis J (2007) The cofilin pathway in breast cancer invasion and metastasis. Nat Rev Cancer 7: 429–440.