www.adv-radio-sci.net/12/197/2014/ doi:10.5194/ars-12-197-2014
© Author(s) 2014. CC Attribution 3.0 License.
Geometric considerations of polar mesospheric summer echoes in
tilted beams using coherent radar imaging
S. Sommer, G. Stober, J. L. Chau, and R. Latteck
Leibniz Institute of Atmospheric Physics at the University of Rostock, Schlossstr. 6, 18225 Kühlungsborn, Germany
Correspondence to:S. Sommer ([email protected])
Received: 17 December 2013 – Revised: 5 May 2014 – Accepted: 7 May 2014 – Published: 10 November 2014
Abstract. We present observations of polar mesospheric summer echoes (PMSE) using the Middle Atmosphere Alo-mar Radar System in Northern Norway (69.30◦N, 16.04◦E). The radar is able to resolve PMSE at high spatial and tempo-ral resolution and to perform pulse-to-pulse beam steering. In this experiment, 81 oblique beam directions were used with off-zenith angles up to 25◦. For each beam pointing di-rection and range gate, coherent radar imaging was applied to determine the mean backscatter location. The location of the mean scatterer in the beam volume was calculated by the deviation from the nominal off-zenith angle of the brightest pixel. It shows that in tilted beams with an off-zenith angle greater than 5◦, structures appear at the altitudinal edges of
the PMSE layer. Our results indicate that the mean influence of the location of the maximum depends on the tilt of the beam and on the observed area of the PMSE layer. At the upper/lower edge of the PMSE layer, the mean backscatter has a greater/smaller zenith angle than the nominal off-zenith angle. This effect intensifies with greater off-off-zenith beam pointing direction, so the beam filling factor plays an important role in the observation of PMSE layers for oblique beams.
1 Introduction
Strong VHF backscatter at mesospheric heights in polar re-gions were described by Ecklund and Balsley (1981) for the first time. As these echoes occur only during the sum-mer months, they were named polar mesospheric sumsum-mer echoes (PMSE). PMSE are caused by inhomogeneities in the electron density of a size comparable to the radar Bragg wave length (3 m at 50 MHz radar frequency) in the pres-ence of negatively charged aerosol particles. Different
as-pects of PMSE have been studied with radars around 50 MHz since their first observation, in particular the spectral width (Czechowsky and Rüster, 1997; Blix, 1999) or aspect sen-sitivity (Röttger and Vincent, 1978; Hocking et al., 1986) to understand the formation of these echoes. A review of the understanding of PMSE was done by Rapp and Lübken (2004), where the formation was explained by the presence of heavy charged ice particles. These ice particles lead to a significantly reduced electron diffusivity and explain the ex-istence of PMSE in the presence of neutral air turbulence. This widely accepted theory explains the overall formation, but still the inner structure of the PMSE is mostly unknown. The limiting factor of the observation of the small scale struc-tures is the relatively wide beam width, so interferometric techniques has been applied to gain insight into finer struc-tures of PMSE.
Rx1 Rx2
Rx3
Rx4 Rx5 Rx6
Rx7
14.0° E 15.0° E 16.0° E 17.0° E 18.0° E 68.5° N
69.0° N 69.5° N 70.0° N
Figure 1.Left: Sketch of the antenna array. The 7 anemones
in-dicated by different colors were used for reception. Right: Beam pointing directions of the CRI experiment setup. The black lines indicate the coast of Northern Norway, the red circles indicate the areas illuminated by the radar beams at about 85 km altitude.
In this study we present results obtained with the Middle Atmosphere Alomar Radar System (MAARSY) at Andøya in Northern Norway (69.30◦N, 16.04◦E). The purpose of
MAARSY is to investigate the dynamics of the mesosphere by studying wind and waves on a high spatial and tempo-ral resolution and also the inner structure of PMSE, such as thin layers, that cannot be resolved by standard measurement techniques. For example, PMSE can be used as a tracer for wind measurements. In order to improve the derivation of gravity wave parameter out of wind measurements (Stober et al., 2012), the experiment should have a better spatial res-olution. We have used MAARSY with a vertical and several oblique beams and applied CRI for different range gates and beam pointing directions. This allows us to determine the fine structure of PMSE in the vertical as well as in the oblique beams and estimate the deviation of the mean scatterer from the beam pointing direction.
2 Experimental configuration
MAARSY is a powerful tool to observe the troposphere up to the mesosphere at polar latitudes. It employs an active phased array antenna system at 53.5 MHz consisting of 433 linear polarized Yagi antennas arranged in a circular shape with a diameter of 90 m. The system reaches a half power beam width of 3.6◦and yields a peak power of about 800 kW. It has pulse-to-pulse beam steering capabilities with 16 re-ceiving channels allowing the observations of PMSE at high spatial and temporal resolutions. For further system descrip-tions, see Latteck et al. (2012).
The flexible setup of MAARSY can be used to assign receiving channels to different antenna sub-arrays allowing different baseline lengths and directions. The smallest sub-array consists of seven antennas in the shape of a hexagon. Seven adjacent hexagons can be combined to an antenna sub-structure consisting of 49 single antennas called anemone. A sketch of the locations of the seven possible anemones is shown in Fig. 1 (left panel). MAARSY can be used for
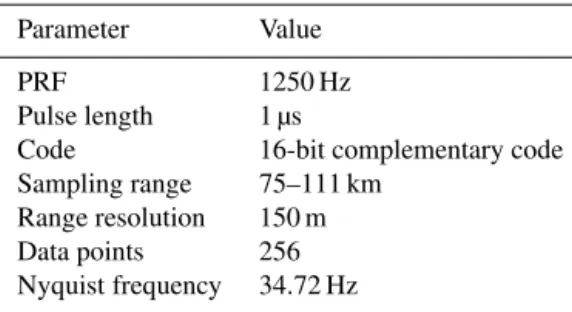
in-Table 1.Experiment parameters
Parameter Value
PRF 1250 Hz
Pulse length 1 µs
Code 16-bit complementary code
Sampling range 75–111 km
Range resolution 150 m
Data points 256
Nyquist frequency 34.72 Hz
terferometry and imaging experiments by selecting up to 16 receiving channels out of the 55 hexagons or 7 anomenes, revealing information within the beam volume. In this ex-periment, MAARSY transmitted with the whole array and 7 anemones were used for reception. These seven receiving channels have been phase calibrated using radio sources as described in Chau et al. (2013).
During the PMSE season in summer 2012, MAARSY was operated in a multi-beam mode using 81 different beam di-rections. In this experiment, 16 azimuth angles from 0 to 360◦with an azimuthal step width of 22.5◦and an off-zenith step width of 5◦ from 0 to 25◦were used. The experiment was divided into sub-experiments, each consisting of 9 beam pointing directions and including the vertical beam. During a sub-experiment, the beam pointing position was changed along a straight line on a pulse-to-pulse basis. The coher-ent integration time for each sub-experimcoher-ent was 7.3 s and the whole sequence took 2.4 min (including sub-experiments probing the troposphere and therefore not used here). The beam pointing directions are visualized in Fig. 1 (right panel) where the red circles indicate the areas illuminated by the radar beams at about 85 km altitude. The sampling range was from 75 to 111 km with a range resolution of 150 m. Addi-tional experiment parameters are summarized in Table 1.
3 Coherent radar imaging (CRI)
W − E offset [°]
S − N offset [
°
]
07−Jul−2012 11:53:02, Height: 85.7 km, Θ=20°, φ=90°
−6 −4 −2 0 2 4 6
−6 −4 −2 0 2 4 6
Brightness [dB]
46 48 50 52 54 56 58 60
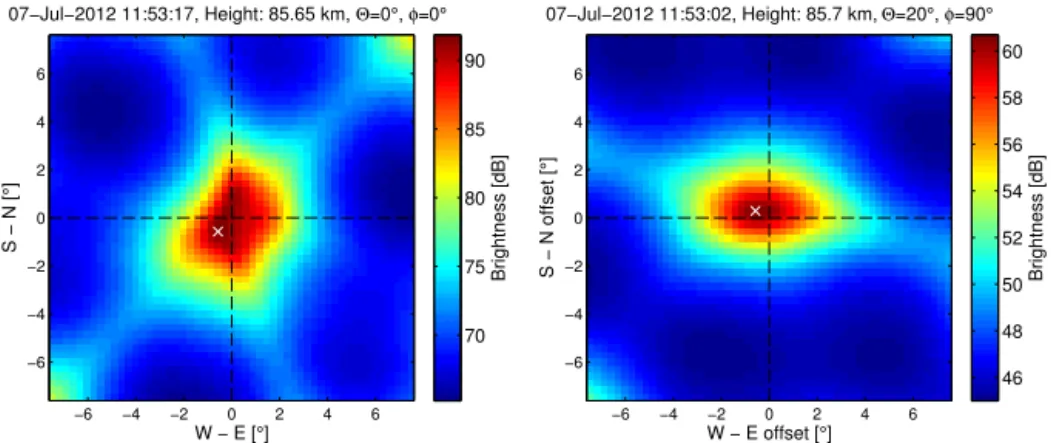
Figure 2.Brightness distribution of the zenith beam and a beam tilted 20◦off-zenith andφ=90◦using Capon’s method in one range gate.
The color coded brightness shows a superposition of the echo and the hexagonal receiving structure due to the alignment of the sub arrays. Furthermore, aliasing due to phase ambiguity can be seen at the outer edges of figures.
However, for lower SNR, MaxEnt gives better results at the expense of significantly higher processing time. Another possible algorithm is the Fourier-based algorithm (Palmer et al., 1998), but it results in a much broader brightness distributions than Capon’s algorithm. In this work we present results using Capon’s method.
This method makes use of visibility dataRij ofnspatially separated antennas i andj. The visibility data is obtained from the normalized cross-correlation estimation:
Rij(t )=
hνi(t )νj⋆(t )i q
h|νi(t )|2ih|νj(t )|2i
, (1)
whereνare the complex voltage samples,|. . .|is the abso-lute value of the complex data andh. . .idenotes the time av-erage. This can be done for all receiver pairs andRij can be arranged in a matrix, containing the visibility data
R(t )=
R11(t ) . . . R1n(t ) R21(t ) . . . R2n(t )
..
. ... Rn1(t ) . . . Rnn(t )
. (2)
The resulting brightness distribution is
Bc(t,k)= 1
e†R−1e (3)
with
e=
ejk·D1 ejk·D2 ejk·D3
.. . ejk·Dn
, (4)
wherekrepresents the wavenumber vector andDi the dis-tance vector in meters of the receiver i with respect to the
origin,tis the time,e†denotes the conjugate transpose ofe,
andR−1is the inverse of the matrixR.
Capon’s algorithm does not consider the beam pattern, nei-ther during transmission nor reception. As Capon’s algorithm cannot contain a priori information, the beam weighting ef-fects cannot be removed easily (Hysell and Chau, 2006). An example of the beam weighting effect on data is shown in Fig. 2 for the brightness in a vertical and in a 20◦ off-zenith beam. Due to aliasing, the pattern is repeated which can be seen at the corners of Fig. 2 (left panel). The ef-fect of the antenna pattern of the transmitting and receiving beams are qualitatively in good agreement with the theoreti-cal antenna pattern. Differences are attributed to the integra-tion time used. Trying to remove the beam pattern afterwards may lead to an overestimation at the image periphery. This happens because it implies dividing by small numbers at the outer edges of the beam pattern.
However, the resulting brightness, i.e. the antenna pattern plus PMSE brightness, can be measured. From this bright-ness we can estimate the deviations of echo center from the beam pointing direction. For our analysis below, we selected the brightest pixel to be the mean echo center.
4 Results
To avoid the analysis of low SNR data, we set the thresh-old for the detection of PMSE to a SNR of 8 dB. When the signal becomes noisy outside a PMSE layer due to the cos-mic background, the mean scatter location is randomly dis-tributed. Most of the time, more than one center of brightness appear in these noisy images.
00:00 06:00 12:00 18:00 00:00 80
85 90 95 100
07/07/2012, UTC
Range [km]
φ = 0°, Θ = 0°
06:00 12:00 18:00 00:00
07/07/2012, UTC
φ = 90°, Θ = 25°
SNR [dB]
10 15 20 25 30
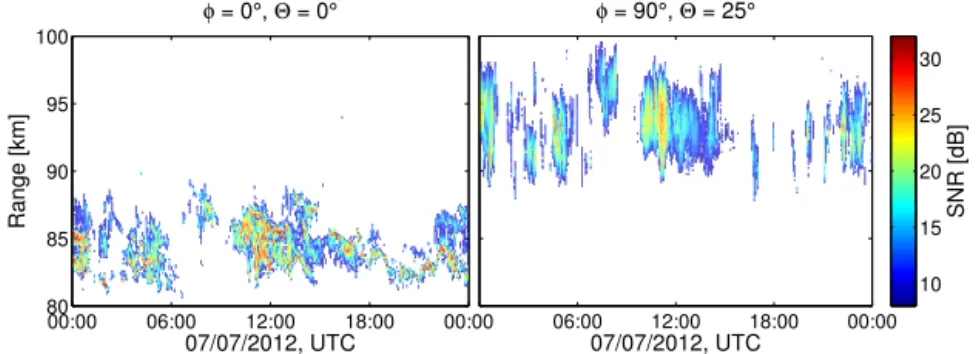
Figure 3.Range-time-intensity plot of PMSE occurring on 07 July 2012 in the zenith beam (left) and a beam tilted 25◦off-zenith (right).
Color coded is the SNR, whereas only a SNR greater than 8 dB is displayed. The PMSE observed by the zenith beam occur in altitudes between about 80 and 90 km, but appear at longer ranges in the tilted beam.
00:00 06:00 12:00 18:00 00:00 80
85 90 95 100
07/07/2012, UTC
Range [km]
φ = 0°, Θ = 0°
06:00 12:00 18:00 00:00
07/07/2012, UTC φ = 90°, Θ = 25°
α
[
°
]
−3 −2 −1 0 1 2 3
Figure 4.Deviation of the brightness peak from the beam pointing directions. Zenith (left) and 25◦off-zenith (right). The echo center is
determined from brightest pixel. In the tilted beam the mean center deviates significantly from the pointing directions.
off-zenith beam. Comparing both RTI plots, it can be seen that the PMSE layer occurs in the tilted beam (right panel) at a longer and wider range than in the zenith beam (left panel), as expected. Besides, the two layers observed around 12:00 UTC in the vertical beam were not detected by the tilted beams.
The brightness for each range gate and pointing direc-tion was gridded with a meridional and zonal step width of 0.01 rad. Next, the off-zenith anglesαfor the brightest pixel was calculated. The results for the zenith beam and the off-zenith beam using the brightest pixel are shown for one day in Fig. 4. For a vertical beam, shown in the left panel of Fig. 4, the deviation is calculated with respect to the swivel direction. Deviations up to±3◦occur, but no pattern with the same direction of the deviation can be identified. Therefore we do not see evidence of tilted layers during the time of our observation.
In the right panel of Fig. 4, the deviation of the mean backscatter from the nominal beam pointing angle 25◦
off-zenith is shown. It can be seen that deviations away from/towards the zenith (positive/negative values) occur in the upper/lower part of the PMSE layer. In between, the off-zenith angle of the mean backscatter location is almost the same as the nominal beam pointing angle. Comparing this with the SNR of the range gate, especially for the large off-zenith angles, the large deviations belong to low SNR values
resulting from a low beam filling factor. Higher SNR values occur mostly in the middle of the PMSE layer, where the de-viations from the nominal pointing directions are small and the beam volume appears to be homogeneously filled.
In Figs. 5 and 6 a swivel from North to South and East to West, respectively, is shown for the same date. Greater off-zenith pointing beams show deviations of echo centers from the beam directions and such deviations emerge at the outer parts of the PMSE layer. Moreover, sub-structures indicated by the deviations of echo centers appear in some beams with 2≥10◦. More than one layer can be seen in tilted beams in contrast to the RTI plots. An example for this occurs at about 12:00 UTC in the beam pointing towardsφ=90◦with2≥
10◦. From the SNR plot in Fig. 3 (right panel), the PMSE appears to consist of one thick layer, however two layers are visible after the CRI analysis (see Fig. 5). Using CRI, the two layers observed in the vertical beam (left panel of Fig. 3) can now be observed in the tilted beams.
MAARSY’s half power beam width of 3.6◦ corresponds
to a horizontal extension of 5 km at 80 km altitude, a titled beam pointing 25◦ off-zenith spans a height of 2.4 km. If
80 85 90 95
Range [km]
φ = 90°, Θ = 20° φ = 90°, Θ = 15° φ = 90°, Θ = 10°
α
[
°
]
−2 0 2
80 85 90 95
Range [km]
φ = 90°, Θ = 5° φ = 0°, Θ = 0° φ = 270°, Θ = 5°
α
[
°
]
−2 0 2
00:00 06:00 12:00 18:00 00:00
80 85 90 95
07/07/2012, UTC
Range [km]
φ = 270°, Θ = 10°
00:00 06:00 12:00 18:00 00:00
07/07/2012, UTC
φ = 270°, Θ = 15°
00:00 06:00 12:00 18:00 00:00
07/07/2012, UTC
φ = 270°, Θ = 20°
α
[
°
]
−2 0 2
Figure 5.Similar to Fig. 4, but showing nine beams from North to South with different off-zenith angles.
80 85 90 95
Range [km]
φ = 0°, Θ = 20° φ = 0°, Θ = 15° φ = 0°, Θ = 10°
α
[
°
]
−2 0 2
80 85 90 95
Range [km]
φ = 0°, Θ = 5° φ = 0°, Θ = 0° φ = 180°, Θ = 5°
α
[
°
]
−2 0 2
00:00 06:00 12:00 18:00 00:00
80 85 90 95
07/07/2012, UTC
Range [km]
φ = 180°, Θ = 10°
00:00 06:00 12:00 18:00 00:00
07/07/2012, UTC
φ = 180°, Θ = 15°
00:00 06:00 12:00 18:00 00:00
07/07/2012, UTC
φ = 180°, Θ = 20°
α
[
°
]
−2 0 2
Figure 6.Same as Fig. 5, but with a scan from East to West.
part of the PMSE layer the mean backscatter location shifts downwards/upwards, indicated by positive/negative α. The small deviations in the middle part of the PMSE region in-dicate that such regions are homogenously filled. No large deviation of the mean scatterer location from the nominal beam pointing direction.
5 Conclusions
Our PMSE observations applying CRI in tilted beams show a deviation of the mean scatter location depending on the tilt angle of the beam. To determine the mean backscatter
loca-tion, we assumed a single center distribution and used the brightest pixel as a proxy of the mean backscatter location. Using tilted beams, sub-structures like small layers appear sometimes in oblique beams that cannot be seen in the SNR. This analysis might be used in the future to investigate the inner structures such as sub-layers on a higher spatial resolu-tion.
the nominal off-zenith angle of the beam is around zero. As the beam volume is not totally filled at large off-zenith angles at the edges of the PMSE, the backscattered power is smaller compared to the vertical beam. Woodman and Chu (1989) suggest a scattering mechanism for turbulent atmospheric layers which are discrete over height. The sharp boundaries described in their layer model are consistent with our mea-surements, although they investigated echoes in the lower lat-itudes.
So far, we can not distinguish between a homogeneous filled beam volume and several thin layers. But in some cases, our method reveals sub-layers in tilted beams which are hard to detect using only the power as an indicator.
The deviation of the mean scatterer from the beam point-ing direction should also be considered in wind calculations using PMSE as a tracer as already indicated by Stober et al. (2013). Using CRI to locate the scattering center can lead to better results since we showed that significant deviations of echo centers from the beam direction occur systematically at the PMSE edges. As Huaman and Balsley (1998) pointed out, the aspect sensitivity of PMSE has also to be taken into account for measuring the wind velocities, but our results in-dicate that this is only true at the lower and upper regions of the PMSE. The necessary corrections are more complicated and depend on the probed part of the PMSE layer and there-fore alter with altitude and time.
Acknowledgements. The authors would like to thank Marius Zecha for MAARSY data handling and the Andøya Rocket Range for the support while building and operating the MAARSY radar and an anonymous reviewer for his/her helpful comments. The radar was built under grant 01 LP 0802A of Bundesmisterium für Bildung und Forschung.
Edited by: M. Förster
Reviewed by: C. Jacobi and one anonymous referee
References
Blix, T. A.: Small scale plasma and charged aerosol variations and their importance for polar mesosphere summer echoes, Adv. Space Res., 24, 537–546, 1999.
Chau, J. L., Renkwitz, T., Stober, G., and Latteck, R.: MAARSY multiple receiver phase calibration using radio sources, J. Atmos. Sol.-Terr. Phy., doi:10.1016/j.jastp.2013.04.004, 2013.
Chen, J.-S. and Furumoto, J.: Measurement of atmospheric aspect sensitivity using coherent radar imaging after mitigation of radar beam weighting effect, J. Atmos. Ocean. Tech., 30, 245–259, 2013.
Chen, J.-S., Hoffmann, P., Zecha, M., and Röttger, J.: On the re-lationship between aspect sensitivity, wave activity, andmulti-ple scattering centers of mesosphere summer echoes: a case study using coherent radar imaging, Ann. Geophys., 22, 807– 817, doi:10.5194/angeo-22-807-2004, 2004.
Chen, J.-S., Hoffmann, P., Zecha, M., and Hsieh, C.-H.: Coherent radar imaging of mesosphere summer echoes: Influence of radar
beam pattern and tilted structures on atmospheric echo center, Radio Sci., 43, RS1002, doi:10.1029/2006RS003593, 2008. Chilson, P. B., Yu, T.-Y., Palmer, R. D., and Kirkwood, S.: Aspect
sensitivity measurements of polar mesosphere summer echoes using coherent radar imaging, Ann. Geophys., 20, 213–223, doi:10.5194/angeo-20-213-2002, 2002.
Czechowsky, P. and Rüster, R.: VHF radar observations of turbu-lent structures in the polar mesopause region, Ann. Geophys., 15, 1028–1036, doi:10.1007/s00585-997-1028-8, 1997. Ecklund, W. L. and Balsley, B. B.: Long-term
observa-tions of the Arctic mesosphere with the MST radar at Poker Flat, Alaska, J. Geophys. Res.-Space, 86, 7775–7780, doi:10.1029/JA086iA09p07775, 1981.
Farley, D. T., Ierkic, H. M., and Fejer, B. G.: Radar inter-ferometry: A new technique for studying plasma turbulence in the ionosphere, J. Geophys. Res.-Space, 86, 1467–1472, doi:10.1029/JA086iA03p01467, 1981.
Harding, B. J. and Milla, M.: Radar imaging with compressed sens-ing, Radio Sci., 48, 582–588, doi:10.1002/rds.20063, 2013. Hocking, W. K., Ruster, R., and Czechowsky, P.: Absolute
reflectiv-ities and aspect sensitivreflectiv-ities of VHF radiowave scatterers mea-sured with the SOUSY radar, J. Atmos. Terr. Phys., 48, 131–144, 1986.
Huaman, M. M. and Balsley, B. B.: Long-term-mean aspect sen-sitivity of PMSE determined from Poker Flat MST radar data, Geophys. Res. Lett., 25, 947–950, 1998.
Hysell, D. L. and Chau, J. L.: Optimal aperture synthesis radar imaging, Radio Sci., 41, 1–12, doi:10.1029/2005RS003383, 2006.
Kudeki, E. and Sürücü, F.: Radar interferometric imaging of field-aligned plasma irregularities in the equatorial electrojet, Geophys. Res. Lett, 18, 41–44, doi:10.1029/GL008i004p00377, 1991.
Kudeki, E., Fejer, B., Farley, D., and Ierkic, H.:
In-terferometer studies of equatorial F region
irregu-larities and drifts, Geophys. Res. Lett., 8, 377–380,
doi:10.1029/0GPRLA000008000004000377000001, 1981. Latteck, R., Singer, W., Rapp, M., Vandepeer, B., Renkwitz, T.,
Zecha, M., and Stober, G.: MAARSY: The new MST radar on Andøya-System description and first results, Radio Sci., 47, RS1006, doi:10.1029/2011RS004775, 2012.
Palmer, R. D., Gopalam, S., Yu, T. Y., and Fukao, S.: Coherent radar imaging using Capon’s method, Radio Sci., 33, 1585–1598, 1998.
Rapp, M. and Lübken, F.-J.: Polar mesosphere summer echoes (PMSE): Review of observations and current understanding, At-mos. Chem. Phys., 4, 2601–2633, doi:10.5194/acp-4-2601-2004, 2004.
Röttger, J. and Vincent, R. A.: VHF radar studies of tropospheric ve-locities and irregularities using spaced antenna techniques, Geo-phys. Res. Lett., 5, 917–920, 1978.
Sommer, S., Stober, G., Schult, C., Zecha, M., and Latteck, R.: In-vestigation of horizontal structures at mesospheric altitudes using coherent radar imaging, Advances in Radio Science, 11, 319– 325, doi:10.5194/ars-11-319-2013, 2013.
Ad-vances in Radio Science, 10, 291–298, doi:10.5194/ars-10-291-2012, 2012.
Stober, G., Sommer, S., Rapp, M., and Latteck, R.: Investigation of gravity waves using horizontally resolved radial velocity mea-surements, Atmos. Meas. Tech., 6, 2893–2905, doi:10.5194/amt-6-2893-2013, 2013.
Sureshbabu, V. N., Anandan, V. K., Tsuda, T., Furumoto, J., and Rao, S.: Performance Analysis of Optimum Tilt An-gle and Beam Configuration to Derive Horizontal Wind Ve-locities by Postset Beam Steering Technique, Geoscience and Remote Sensing, IEEE Transactions, 51, 520–526, doi:10.1109/TGRS.2012.2200256, 2013.
Woodman, R. F.: Coherent radar imaging: Signal processing and statistical properties, Radio Sci., 32, 2373–2391, 1997.
Woodman, R. F. and Chu, Y.-H.: Aspect sensitivity measurements of VHF backscatter made with the Chung-Li radar: Plausible mechanisms, Radio Sci., 24, 113–125, 1989.
Yu, T. Y., Palmer, R. D., and Hysell, D. L.: A simulation study of coherent radar imaging, Radio Sci., 35, 1129–1141, 2000. Yu, T.-Y., Palmer, R. D., and Chilson, P. B.: An investigation of