TCD
9, 5943–5955, 2015Brief Communication: Twelve-year cyclic surging episode at
Donjek Glacier
T. Abe et al.
Title Page
Abstract Introduction
Conclusions References
Tables Figures
◭ ◮
◭ ◮
Back Close
Full Screen / Esc
Printer-friendly Version
Interactive Discussion
Discussion
P
a
per
|
Discussion
P
a
per
|
Discussion
P
a
per
|
Discussion
P
a
per
|
The Cryosphere Discuss., 9, 5943–5955, 2015 www.the-cryosphere-discuss.net/9/5943/2015/ doi:10.5194/tcd-9-5943-2015
© Author(s) 2015. CC Attribution 3.0 License.
This discussion paper is/has been under review for the journal The Cryosphere (TC). Please refer to the corresponding final paper in TC if available.
Brief Communication: Twelve-year cyclic
surging episode at Donjek Glacier in
Yukon, Canada
T. Abe1, M. Furuya1, and D. Sakakibara2,3
1
Graduate School of Science, Hokkaido University, Sapporo, Japan
2
Graduate School of Environmental Science, Hokkaido University, Sapporo, Japan
3
Institute of Low Temperature Science, Hokkaido University, Sapporo, Japan
Received: 9 October 2015 – Accepted: 16 October 2015 – Published: 2 November 2015 Correspondence to: T. Abe ([email protected])
TCD
9, 5943–5955, 2015Brief Communication: Twelve-year cyclic surging episode at
Donjek Glacier
T. Abe et al.
Title Page
Abstract Introduction
Conclusions References
Tables Figures
◭ ◮
◭ ◮
Back Close
Full Screen / Esc
Printer-friendly Version
Interactive Discussion
Discussion
P
a
per
|
Discussion
P
a
per
|
Discussion
P
a
per
|
Discussion
P
a
per
|
Abstract
Surge-type glaciers repeat their short active phase and much longer quiescent phase usually every several decades or longer, but detailed observations of the evolution cycles have been limited to a few glaciers. Here we report three surging episodes in 1989, 2001, and 2013 at Donjek Glacier in the Yukon, indicating remarkably regular
5
and short repeat cycles of 12 years. The surging area is limited within the ∼20 km
section from the terminus, where the flow width significantly narrows than upstream, suggesting a strong control of the valley constriction on the surge dynamics.
1 Introduction
Surge-type glaciers exhibit several-fold to orders-of-magnitude speed-up during the
10
short (1–15 years) active phase, resulting in significant thickness changes and km-scale terminus advance (Meier and Post, 1969; Raymond, 1987; Harrison and Post, 2003). In the quiescent phases (tens to hundreds of years), they flow slowly or become stagnant in the downstream. Meanwhile, ice mass is accumulated in the upstream area for the next active phase and the imbalanced flow causes retreating and thinning in the
15
downstream area, which develops a steeper glacier surface in the upstream. The lat-ter quiescent phase is sometimes called as build-up phase (Dolgoushin and Osipova, 1975; Jiskoot, 2011). Near the border of Alaska and the Yukon, Canada, there are many surge-type glaciers (Meier and Post, 1969; Raymond, 1987; Harrison and Post, 2003). Nevertheless, detailed observations of the repeating surge cycles have been
20
extremely limited (e.g. Frappé and Clarke, 2007; Burgess et al., 2012), which prevents from better understanding the dynamics of surge-type glacier (Raymond, 1987; Harri-son and Post, 2003; Cuffey and Paterson, 2010).
Recent advances in spaceborne remote sensing techniques have revealed spatial and temporal changes in ice velocity at surge-type glaciers in Alaska and the Yukon,
25
TCD
9, 5943–5955, 2015Brief Communication: Twelve-year cyclic surging episode at
Donjek Glacier
T. Abe et al.
Title Page
Abstract Introduction
Conclusions References
Tables Figures
◭ ◮
◭ ◮
Back Close
Full Screen / Esc
Printer-friendly Version
Interactive Discussion
Discussion
P
a
per
|
Discussion
P
a
per
|
Discussion
P
a
per
|
Discussion
P
a
per
|
2015). However, the temporal coverage of spaceborne SAR data is still too short to in-vestigate long-term evolutions in ice speed although SAR allowed us to image remote areas regardless of weather conditions and acquisition time. Landsat optical images distributed by the United States Geological Survey (USGS) have been available since 1972. While optical images have their limitations in local weather conditions, they
re-5
vealed the long-term changes in terminus positions and velocities of mountain glaciers in the world (e.g. McNabb and Hock, 2014). To reveal the long-term evolution of surge-type glaciers, we use Landsat optical images acquired between 1973 and 2014 to derive the spatial–temporal changes in both the velocity field and the terminus areas. Here we report our findings of three surging events of Donjek Glacier.
10
2 Donjek Glacier
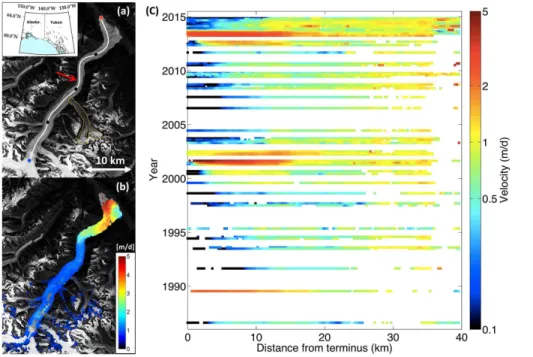
Donjek Glacier is located in the Donjek River Valley System in northern Yukon (Fig. 1a), which consists of Steele, Spring, Donjek, and Kluane Glaciers; all these are surge-type (Clarke and Holdsworth, 2002). The entire length and area are 55 km and 448 km2, respectively. Donjek Glacier is located at an elevation of 1000–3000 m. As shown in the
15
result, however, the surging area is limited to the lowermost 20 km, where the flow width becomes significantly narrower than upstream. The terminus spreads out as it flows into the river valley to form a small piedmont lobe. Former surges have caused this lobe to expand to the east against the Donjek Ranges, which blocked the flow in the river. The recent airborne laser altimerty revealed that the mass balance of Donjek Glacier
20
was−0.29 m w.e. yr−1(Larsen et al., 2015). Although a previous study reported a surge
event in 1970s (Clarke and Holdsworth, 2002), there is no report about the recent surges, and the long-term evolution remains uncertain. The last tributary (Fig. 1a) is also known as surge-type that was active in 1974 (Clarke and Holdsworth, 2002) and 2010 as shown in Fig. 3.
TCD
9, 5943–5955, 2015Brief Communication: Twelve-year cyclic surging episode at
Donjek Glacier
T. Abe et al.
Title Page
Abstract Introduction
Conclusions References
Tables Figures
◭ ◮
◭ ◮
Back Close
Full Screen / Esc
Printer-friendly Version
Interactive Discussion
Discussion
P
a
per
|
Discussion
P
a
per
|
Discussion
P
a
per
|
Discussion
P
a
per
|
3 Data and method
Landsat optical images from 1973 to 2014 were used in order to examine the flow speed evolution and the terminus fluctuation. These images were acquired by the Landsat 1–5 Multi-Spectral Scanner (MSS), the Landsat 5 Thematic Mapper (TM), the Landsat 7 Enhanced Thematic Mapper Plus (ETM+) and the Landsat 8 Operational
5
Land Imager (OLI), which are distributed by the USGS (http://landsat.usgs.gov/). While there are a variety of image matching methods (i.e. feature tracking) to derive glacier surface speed (e.g. Heid and Kääb, 2012), we used the Cross-Correlation in Frequency domain on Orientation images (CCF-O) algorithm (Fitch et al., 2002) to derive surface velocity in this study, because for Alaskan glaciers, the CCF-O algorithm
10
is the best performance of all the other methods (Heid and Kääb, 2012). The details of our processing method are described in Supplement .
We also examined the terminus area fluctuation associated with the surging events using the false color composite images (see the Supplement). The spatial resolution of the composite image is 60 m for the MSS and 30 m for the others, respectively. We
15
calculated the terminus area changes derived from setting a polygon formed by the terminus lobe and the reference line set in an upstream area.
4 Results
Figure 1a shows the location of Donjek Glacier and the flow line used in our measure-ment of the velocity distributions. Figure 1b shows the ice speed map for the 2001
20
surge as an example; the velocity map is derived from two images acquired between August and September 2001, and the ice speed is shown in linear scale. Figure 1c indicates the spatial–temporal velocity evolution along the flow line shown in Fig. 1a from 1986 to 2014; the ice speed is now shown in logarithmic scale. Because of the lower spatial resolution of the images prior to 1986, we could not derive the velocities
25
termi-TCD
9, 5943–5955, 2015Brief Communication: Twelve-year cyclic surging episode at
Donjek Glacier
T. Abe et al.
Title Page
Abstract Introduction
Conclusions References
Tables Figures
◭ ◮
◭ ◮
Back Close
Full Screen / Esc
Printer-friendly Version
Interactive Discussion
Discussion
P
a
per
|
Discussion
P
a
per
|
Discussion
P
a
per
|
Discussion
P
a
per
|
nus changes even in 1970s. In 1989, 2001 and 2013, the speed near the terminus is apparently much greater than those in other years, whose velocity reaches up to 2, 4.5, and 3 m day−1
, respectively. In contrast, the speed during the quiescent phase is about 0.5 m day−1
or less at the terminus. During the three active phases, the speed-up regions are mostly limited to the∼20 km section from the terminus (see also Fig. 1b),
5
which we associate below with the geometry of the glacier. Meanwhile, the velocities in the further upstream do not indicate any significant temporal changes throughout the analysed period, whose speed is about 1.0 m day−1. We also notice that the
veloc-ity front of∼0.5 m day−1 propagates toward downstream over the more than 5 years
prior to the 2001 and 2013 active phases. In addition, the velocities behind the front
10
clearly indicate gradual acceleration toward the peak active phases. We do not iden-tify any clear timings of surge initiation and termination season, which could be due to both/either the multi-year precursory acceleration and/or the lack of temporal resolution in the available data.
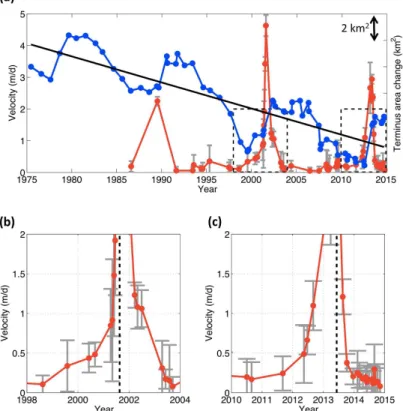
The red line in Fig. 2a shows the temporal changes of the ice speed averaged over
15
the section between 0 and 5 km from the terminus. The three significant peaks in the red line correspond to the active phases in 1989, 2001, and 2013 (Fig. 1c). While the measured maximum speeds are different from each other, we do not consider the differences to be significant, because it could be due to the coarse temporal sampling of velocities.
20
Figure 2b and c show the enlarged views for the 2001 and the 2013 events. In the 2001 event, the speed started to gradually increase in the late 1998–1999, rapidly increase in the late 2000–2001, and rapidly decrease in 2003. The evolution of the speed for the 2013 event is similar to that for the 2001 event. Namely, the speed initi-ated to gradually increase in the late 2011–2012, rapidly increase in the late 2012 and
25
terminated in the late 2013. Regarding the rapid acceleration as the surge, the surge duration is about 1 year.
TCD
9, 5943–5955, 2015Brief Communication: Twelve-year cyclic surging episode at
Donjek Glacier
T. Abe et al.
Title Page
Abstract Introduction
Conclusions References
Tables Figures
◭ ◮
◭ ◮
Back Close
Full Screen / Esc
Printer-friendly Version
Interactive Discussion
Discussion
P
a
per
|
Discussion
P
a
per
|
Discussion
P
a
per
|
Discussion
P
a
per
|
secular decrease in the terminus areas, we can identify decadal fluctuations. The black line indicates the secular rate of decrease (−0.2 km2yr−1), which presumably indicates
the trend due to the recent global warming. Moreover, the decadal fluctuations show their peaks around 1980, 1991, 2002, and 2014. Comparing with the speed changes in red, the last three peaks in blue correspond to those in the speed data in 1989,
5
2001, and 2013 with a few time lags (Fig. 2a). The decadal fluctuations are presumably attributable to the wax and wane of the terminus area associated with the surge cycle. Although we cannot derive the speed data before 1985, the temporal increase of the terminus area around 1980 is highly likely due to the surge in late 1970s.
Remarkably, the surging area is limited to the ∼20 km section from the terminus
10
instead of the entire glacier (Fig. 1b and c). It is also clear that the surging area is significantly narrower than upstream (red arrow in Fig. 1a), which is also S-shaped valley; the width of the∼20 km section is at least 35 % narrower than upstream. In the
three events, the surge seems to have initiated at this constricted area.
5 Discussion and conclusion
15
The recurrent intervals between 1989 and 2001 events and between 2001 and 2013 events are 12 years (Figs. 1c and 2a). Although we cannot derive the velocity data be-fore 1985, the repeated terminus area fluctuations every 12 years strongly suggest that the previous surging occurred in the late 1970s, which is consistent with the previous report of the surge at Donjek Glacier (Clarke and Holdsworth, 2002). The 12 year
re-20
current interval is the shortest among the surge-type glaciers in Alaska and the Yukon, and as short as those (10–15 years) of Medvezhiy Glacier in the West Pamir Moun-tains, Tajikistan (Dolgoushin and Osipova, 1975). Although we have only three solid evidences for the 1989, 2001, and 2013 episodes, the recurrent interval seems to be fairly regular with few variabilities. The short and probably regular recurrence will have
25
TCD
9, 5943–5955, 2015Brief Communication: Twelve-year cyclic surging episode at
Donjek Glacier
T. Abe et al.
Title Page
Abstract Introduction
Conclusions References
Tables Figures
◭ ◮
◭ ◮
Back Close
Full Screen / Esc
Printer-friendly Version
Interactive Discussion
Discussion
P
a
per
|
Discussion
P
a
per
|
Discussion
P
a
per
|
Discussion
P
a
per
|
We compare our observations at Donjek Glacier with those at other glaciers. In terms of the shorter interval and the narrower width of surging region, Donjek Glacier may be similar to Medvezhiy Glacier whose evolution was extensively monitored in the 1960– 1970s (Dolgoushin and Osipova, 1975). Medvezhiy Glacier has a wider accumulation area at an elevation of 4600 to 5500 m, but the surges are confined to the 8 km long
5
ice tongue in the narrow valley, separated by a steep ice fall that drops by 800 m 1 km−1
(Dolgoushin and Osipova, 1975). Although there are no large slope changes at Donjek Glacier, the significant valley constriction may generate a steep surface slope around the narrowing zone by the mass tranport from upstream in the quiescent phase. At Variegated Glacier, the recurrent interval is about 15 years (e.g. Eisen et al., 2001).
10
Eisen et al. (2001) estimated the cumulative mass balance in the upstream on Var-iegated Glacier, and showed that the surges were initiated when cumulative annual mass balance reached some critical value. The variabilities in the recurrence interval could be explained by the variable annual mass balance. The apparent regularity of the recurrent interval at Donjek Glacier may be due to the rather steady flow speed in the
15
upstream.
At Medvezhiy Glacier, the observed maximum speed is greater than 100 m day−1,
and the active phase initiates in winter, lasting about 3 months (Cuffey and Paterson, 2010). At Variegated Glacier, the surge also initiates from fall to winter and the max-imun speed is up to 50 m day−1 during the 1982–1983 surge (Kamb et al., 1985). In 20
Bering Glacier, the similar behavior (higher speed more than 10 m day−1
, and winter initiation) is observed in the 2008–2011 surge (Burgess et al., 2012). The reccurent interval is about 18 years. These sudden speed-up in fall to winter and rapid slow down in early summer are interpreted by hydrological regulation mechanism, which is a de-struction of tunnel-like channel and subsequent change into linked-cavity system and
25
TCD
9, 5943–5955, 2015Brief Communication: Twelve-year cyclic surging episode at
Donjek Glacier
T. Abe et al.
Title Page
Abstract Introduction
Conclusions References
Tables Figures
◭ ◮
◭ ◮
Back Close
Full Screen / Esc
Printer-friendly Version
Interactive Discussion
Discussion
P
a
per
|
Discussion
P
a
per
|
Discussion
P
a
per
|
Discussion
P
a
per
|
be no clear initiation seasons. It is likely, however, that we have missed much higher speeds and winter initiation due to the coarse temporal resolution in our velocity data. The 12 year recurrent interval is apparently shorter than that in Svalbard-type surge, whose cycle is thought to be 50 years or much longer (Murray et al., 2003; Jiskoot, 2011). Moreover, the active duration is much shorter than that in Svalbard-type, and
5
the flow speed seems to have rapidly slowed down after the active phase. The ob-served multi-year acceleration may include small acceleration events or mini-surges that redistribute thicknening and thinning (Raymond and Harrison, 1988; Harrison and Post, 2003) during the build-up phase. Thus, we consider that the surge phase of the two event is about 1 year, and that Donjek Glacier will probably belong to Alaskan-type.
10
We speculate the following scenario for the cyclic surging episode. In the quiescent phase, ice delivered from the upstream area is stored at the significantly narrowed area (Fig. 1a), and the ice locally thickens. The ice thickening generates a steeper geometry with higher driving stress. When the ice thickness reaches a critical value, the glacier initiates to speed-up. We do not claim, however, that the driving stress itself
15
is high enough to initiate the surging. As the ice thickness increases, the volume of englacial water storage will also increase, which will assist the higher speed during the surging (Lingle and Fatland, 2003; Abe and Furuya, 2015). During the surge, the inefficient drainage system and the enough englacial water volume can keep higher velocity. After the mass re-distribution terminates, the thickness in the reservoir zone
20
will again increase for the next event.
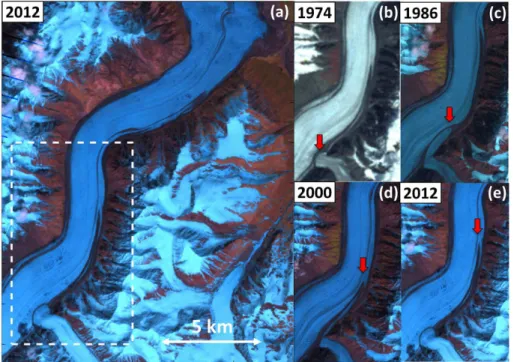
The last tributary at Donjek Glacier (Fig. 1a) is also known as surge-type, and the previous surge occurred in 1974 (Clarke and Holdsworth, 2002). We examined the in-teraction of the tributary to the main stream, using Landsat images. There are many looped moraines on the main stream induced by the tributary’s surge (Fig. 3a).
Al-25
TCD
9, 5943–5955, 2015Brief Communication: Twelve-year cyclic surging episode at
Donjek Glacier
T. Abe et al.
Title Page
Abstract Introduction
Conclusions References
Tables Figures
◭ ◮
◭ ◮
Back Close
Full Screen / Esc
Printer-friendly Version
Interactive Discussion
Discussion
P
a
per
|
Discussion
P
a
per
|
Discussion
P
a
per
|
Discussion
P
a
per
|
The next event of Donjek Glacier is highly likely to occur around 2025. In order to better understand the surge dynamics, we propose to perform detailed observations of not only velocities but also geometric and hydrological changes for the next event.
The Supplement related to this article is available online at doi:10.5194/tcd-9-5943-2015-supplement.
5
Acknowledgements. Landsat images were downloaded from http://earthexplorer.usgs.gov. Glacier outlines were downloaded from the Randolph Glacier Inventory version 4.0 http:// www.glims.org/RGI/rgi40_dl.html. We acknowledge JSPS-KAKENHI grand number 24 651 001 (M. Furuya) and Grant-in-Aid for JSPS Fellows (T. Abe: 15J01952 and D. Sakakibara: 14J02632) for supporting this study.
10
References
Abe, T. and Furuya, M.: Winter speed-up of quiescent surge-type glaciers in Yukon, Canada, The Cryosphere, 9, 1183–1190, doi:10.5194/tc-9-1183-2015, 2015.
Burgess, E. W., Forster, R. R., Larsen, C. F., and Braun, M.: Surge dynamics on Bering Glacier, Alaska, in 2008–2011, The Cryosphere, 6, 1251–1262, doi:10.5194/tc-6-1251-2012, 2012. 15
Burgess, E. W., Foster, R. R., and Larson, C. F.: Flow velocities of Alaskan glaciers, Nat. Com-mun., 4, 2146, doi:10.1038/ncomms3146, 2013.
Clarke, G. K. C. and Holdsworth, G.: Glaciers of the St. Elias Mountains, in: Satellite Image Atlas of Glaciers of the World, edited by: Williams Jr., R. S. and Ferrigno, J. G., USGS Professional Paper 1386-J, USGS, Denver, Colorado, USA, J301–J327, 2002.
20
Cuffey, K. M. and Paterson, W. S. B.: The Physics of Glaciers, 4th Edn., Elsevier, Oxford, UK, 2010.
Dolgoushin, L. D. and Osipova, G. B.: Glacier surges and the problem of their forecasting, Int. Assoc. Hydrol. Sci. Pub., 104, 292–304, 1975.
Eisen, O., Harrison, W. D., and Raymond, C. F.: The surges of Variegated Glacier, Alaska, USA, 25
TCD
9, 5943–5955, 2015Brief Communication: Twelve-year cyclic surging episode at
Donjek Glacier
T. Abe et al.
Title Page
Abstract Introduction
Conclusions References
Tables Figures
◭ ◮
◭ ◮
Back Close
Full Screen / Esc
Printer-friendly Version
Interactive Discussion
Discussion
P
a
per
|
Discussion
P
a
per
|
Discussion
P
a
per
|
Discussion
P
a
per
|
Fitch, A. J., Kadyrov, A., Christmas, W. J., and Kittler, J.: Orientation correlation, in: British Machine Vision Conference, Cardiff, UK, 133–142, 2002.
Frappé, T.-P. and Clarke, G. K. C.: Slow surge of Trapridge Glacier, Yukon Territory, Canada, J. Geophys. Res., 112, F03S32, doi:10.1029/2006JF000607, 2007.
Harrison, W. D. and Post, A. S.: How much do we really know about glacier surging?, Ann. 5
Glaciol., 36, 1–6, 2003.
Heid, T. and Kääb, A.: Evaluation of existing image matching methods for deriving glacier sur-face displacements globally from optical satellite imagery, Remote Sens. Environ., 118, 339– 355, doi:10.1016/j.rse.2011.11.024, 2012.
Jiskoot, H.: Glacier surging, in: Encyclopedia of Snow, Ice and Glaciers, Springer, Dordrecht, 10
the Netherlands, 2011.
Kamb, B., Raymond, C. F., Harrison, W. D., Engelhardt, H., Echelmeyer, K. A., Humphrey, N., Brugman, M. M., and Pfeffer, T.: Glacier surge mechanism: 1982–1983 surge of Variegated Glacier, Alaska, Science, 227, 469–477, 1985.
Larsen, C. F., Burgess, E., Arendt, A. A., O’Neel, S., Johnson, A. J., and Kienholz, C.: Sur-15
face melt dominates Alaska glacier mass balance, Geophys. Res. Lett., 42, 5902–5908, doi:10.1002/2015GL064349, 2015.
Lingle, C. S. and Fatland, D. R.: Does englacial water storage drive temperate glacier surge?, Ann. Glaciol., 36, 14–20, 2003.
McNabb, R. W. and Hock, R.: Alaska tidewater glacier terminus positions, 1948–2012, J. Geo-20
phys. Res.-Earth Surf., 119, 153–167, 2014.
Meier, M. F. and Post, A.: What are glacier surges?, Can. J. Earth Sci., 6, 807–817, 1969. Murray, T., Strozzi, T., Luckman, A., Jiskoot, H., and Christakos, P.: Is there a single surge
mechanism?, Contrasts in dynamics between glacier surges in Svalbard and other regions, J. Geophys. Res., 108, 2237, doi:10.1029/2002JB001906, 2003.
25
Raymond, C. F.: How do glaciers surge?, a review, J. Geophys. Res., 92, 9121–9134, 1987. Raymond, C. F. and Harrison, W. D.: Evolution of Variegated Glacier, Alaska, USA, prior to its
TCD
9, 5943–5955, 2015Brief Communication: Twelve-year cyclic surging episode at
Donjek Glacier
T. Abe et al.
Title Page
Abstract Introduction
Conclusions References
Tables Figures
◭ ◮
◭ ◮
Back Close
Full Screen / Esc
Printer-friendly Version
Interactive Discussion
Discussion
P
a
per
|
Discussion
P
a
per
|
Discussion
P
a
per
|
Discussion
P
a
per
|