www.the-cryosphere.net/10/1427/2016/ doi:10.5194/tc-10-1427-2016
© Author(s) 2016. CC Attribution 3.0 License.
Brief Communication: Twelve-year cyclic surging episodes at
Donjek Glacier in Yukon, Canada
Takahiro Abe1, Masato Furuya1, and Daiki Sakakibara2,3 1Graduate School of Science, Hokkaido University, Sapporo, Japan
2Graduate School of Environmental Science, Hokkaido University, Sapporo, Japan 3Institute of Low Temperature Science, Hokkaido University, Sapporo, Japan
Correspondence to:Takahiro Abe ([email protected])
Received: 9 October 2015 – Published in The Cryosphere Discuss.: 2 November 2015 Revised: 7 June 2016 – Accepted: 13 June 2016 – Published: 11 July 2016
Abstract.Surge-type glaciers repeat their short active phase and their much longer quiescent phase usually every several decades or longer, but detailed observations of the evolution cycles have been limited to only a few glaciers. Here we re-port three surging episodes in 1989, 2001, and 2013 at Don-jek Glacier in the Yukon, Canada, indicating remarkably reg-ular and short repeat cycles of 12 years. The surging area is limited within the ∼20 km section from the terminus,
origi-nating in an area where the flow width significantly narrows downstream, suggesting a strong control of the valley con-striction on the surge dynamics.
1 Introduction
During their short (1–15 years) active phase, surge-type glaciers typically speed up severalfold to over an order of magnitude, resulting in significant thickness changes and kilometre-scale terminus advance (Meier and Post, 1969; Raymond, 1987; Harrison and Post, 2003). In their quiescent phase (tens to hundreds of years), they flow slowly or become stagnant. Meanwhile, ice accumulates in the upstream area and the imbalanced flow causes retreating and thinning in the downstream area, which produces a steeper glacier surface in the upstream. This part of the quiescent phase is sometimes called the build-up phase (Dolgoushin and Osipova, 1975; Jiskoot, 2011). As to the cause of the surge, two generation mechanisms have been proposed: the Alaskan-type and the Svalbard-type (e.g. Murray et al., 2003).
In Alaskan temperate glaciers, the active phase is rela-tively short, lasting a few months to years, and can have a
rapid speed-up and slow-down. The Alaskan-type surge of-ten initiates in winter (Raymond, 1987; Harrison and Post, 2003). The initiation mechanism is thought to be a hydrologi-cal transition from efficient tunnel-like drainage to inefficient linked-cavity drainage with a corresponding increase in wa-ter pressure (Kamb et al., 1985; Harrison and Post, 2003). In contrast, in Svalbard polythermal glaciers, the speed-up is gradual, leading to years-long active surging. For these glaciers, the active-phase duration and the recurrence interval are much longer than those in the temperate Alaskan-type. Moreover, for Svalbard polythermal glaciers, the surge gen-eration mechanism has been considered to be thermal reg-ulation (e.g. Murray et al., 2003). However, recent observa-tions have shown seasonal modulation in ice speed during the years-long active surging, which indicates the importance of the hydrological process, originating from the surface melt-water, for maintaining a multi-year active phase (Yasuda and Furuya, 2015).
Near the border of Alaska and the Yukon, Canada, there are many surge-type glaciers (Meier and Post, 1969; Ray-mond, 1987; Harrison and Post, 2003). The surge cycles in this area have been examined (e.g. Eisen et al., 2001, 2005; Frappé and Clarke, 2007; Burgess et al., 2012; Bevington and Copland, 2014), but many questions remain about the de-tailed surging dynamics (Raymond, 1987; Harrison and Post, 2003; Cuffey and Paterson, 2010).
1428 T. Abe et al.: Twelve-year cyclic surging episodes at Donjek Glacier 2015). The temporal coverage of spaceborne SAR data is still
too short to investigate long-term evolution in ice speed, al-though SAR allows us to image remote areas regardless of weather conditions and acquisition time (i.e. SAR data ac-quisition can be done both daytime and nighttime). Landsat optical images distributed by the United States Geological Survey (USGS) have been available since 1972. While opti-cal images have their limitations in loopti-cal weather conditions, they have revealed the long-term changes in terminus posi-tions and velocities of mountain glaciers around the world (e.g. McNabb and Hock, 2014; Sakakibara and Sugiyama, 2014).
To reveal the long-term evolution of Donjek Glacier, we use Landsat optical images acquired between 1973 and 2014 to derive the spatial–temporal changes in ice speed (1986– 2014) and the terminus areas (1973–2014). As a conse-quence, here we report our findings of three surging events as well as a likely surging event pre-1985.
2 Donjek Glacier
Donjek Glacier is located in southwest Yukon (Fig. 1a). Steele, Spring, and Kluane glaciers are major surge-type glaciers located around Donjek (Clarke and Holdsworth, 2002). The entire length and area of Donjek Glacier are 55 km and 448 km2, respectively. Donjek Glacier lies at an elevation of 1000–3000 m, and the valley width significantly constricts 20 km downstream of the terminus. The terminus spreads out as it flows into the river valley to form a small piedmont lobe. Former surges have caused this lobe to ex-pand to the east against the Donjek Range, which blocked the flow in the river (e.g. Clarke and Mathews, 1981). Recent air-borne laser altimetry revealed that the mass balance of Don-jek Glacier was−0.29 m w.e.yr
−1(Larsen et al., 2015). Pre-vious studies mentioned past surging events in 1935, 1961, 1969, and 1978 (Johnson, 1972a, b; Clarke and Holdsworth, 2002). The earliest three events were recognized using aerial photogrammetry and morphological features. However, the details of the observations (e.g. data source and the obser-vation frequency) and even the duration of the active phase are unclear. Moreover, surges since the 1980s have been unreported, and the long-term evolution remains uncertain. Donjek’s last tributary (Fig. 1a) is also known as a surge-type glacier that was active in 1974 (Clarke and Holdsworth, 2002), but there is no recent report of this tributary’s surge.
3 Data and method
We used Landsat optical images to examine terminus changes from 1973 to 2014 and flow-speed evolution from 1986 to 2014. Because of the lower spatial resolution of the images prior to 1986, we could not derive the velocities be-tween 1973 and 1985, but the images were helpful to exam-ine the terminus changes even in the 1970s. These images
were acquired by the Landsat 1–5 Multi-Spectral Scanner (MSS), the Landsat 4–5 Thematic Mapper (TM), the Land-sat 7 Enhanced Thematic Mapper Plus (ETM+), and the Landsat 8 Operational Land Imager (OLI), all of which are distributed by the USGS (http://landsat.usgs.gov/).
While there are a variety of image matching (i.e. fea-ture tracking) methods to derive glacier surface speed (e.g. Heid and Kääb, 2012), we used the Cross-Correlation in Fre-quency domain on Orientation images (CCF-O) algorithm (Fitch et al., 2002) to derive surface velocity in this study because for Alaskan glaciers, the CCF-O algorithm performs better than the other methods (Heid and Kääb, 2012). For details of how we applied this method, see the Supplement.
We also examined the fluctuation of the terminus area as-sociated with the surging events using the false colour com-posite images (see the Supplement). The spatial resolution of a composite image is 60 m for the MSS images and 30 m for the others. We calculated the terminus area changes using a reference line set about 5 km upstream to create a polygon representing the edge of the terminus. Moreover, we investi-gated the behaviour of the tributary and examined the inter-action of it to the main stream by the composite images.
4 Results
Figure 1b shows the ice speed map for the 2001 surge as an example, and Fig. 1c indicates the spatial–temporal ve-locity evolution along the flow line shown in Fig. 1a from 1986 to 2014. In 1989, 2001, and 2013, the speed near the terminus appears much greater, by up to 2, 4.5, and 3 m d−1, respectively, than that during the other years (i.e. quiescent phases), which is about 0.5 m d−1or less. During the three active phases, the speed-up regions are mostly limited to the
∼20 km section from the terminus (see also Fig. 1b), which we associate below with the shape of the glacier.
ac-Figure 1.Glacier flow speeds and glacier extent.(a)Location of Donjek Glacier. The background is a Landsat 8 image acquired on 22 July 2014. The white line is the flow line used in(c)and(d). The red and blue dots show the start and end points, whereas the black dots mark 10 km intervals. The red arrow indicates a significantly narrower area of the valley and the dotted orange curves outline the last tributary.
(b)A sample ice-speed map derived from two images acquired in August and September 2001. The colour scale (logarithmic) is the same as that in(c).(c)Spatial-temporal velocity evolution along the flow line in(a)from 1986 to 2014. The red arrows indicate the propagation of the velocity front.(d)The black line shows the change in the valley width between 8 and 30 km along the flow line. The blue, red, and green lines show the ice velocity associated with surging episodes in 1989, 2001, and 2003, respectively. The pink line is the averaged velocity between 2003 and 2011 (i.e. the quiescent phase).
celeration or a lack of temporal resolution in the available data.
The red curve in Fig. 2a shows the temporal changes of the ice speed averaged over the section between 0 and 5 km from the terminus. This curve has three significant peaks, which correspond to the active phases in 1989, 2001, and 2013 (Fig. 1c, d). The peak magnitudes all differ, but the differ-ences are likely due mainly to the coarse temporal sampling of the velocities. In the 2001 event (Fig. 2b), the speed starts to gradually increase in late 1998–1999, rapidly increasing in late 2000–2001, and rapidly decreasing in 2003. The evolu-tion of the speed for the 2013 event (Fig. 2c) is similar to that for the 2001 event; namely, the speed starts to gradually in-crease in late 2011–2012, rapidly increasing in late 2012 and then terminates in late 2013. Although the data do not resolve the exact month or season of the initiation, the duration of the active phase is about 1 year.
The terminus area also changes from 1973 to 2014, with decadal fluctuations superimposed on a gradual decrease. The black line in Fig. 2a indicates a long-term rate of de-crease of −0.2 km2yr−1, which presumably indicates the negative mass balance trend from recent climate warming (e.g. Luthcke et al., 2013; Larsen et al., 2015). The decadal fluctuations in blue show peaks around 1980, 1991, 2002,
and 2014. Comparing those peaks with the speed changes in red, the last three peaks in blue coincide with the last three peaks in the speed data, with a 0- to 2-year time lag (Fig. 2a). These correspondences indicate that the decadal fluctuations in terminus area are attributable to the sudden speed-up of a surge event. During a surge, a significant volume of ice must be rapidly transported to the terminus area, and thus the wax and wane of the terminus area occur with the surge cycle. Although our speed measurements do not go back to before 1985, such a surge is likely the reason for the temporal in-crease of the terminus area around 1980 as well.
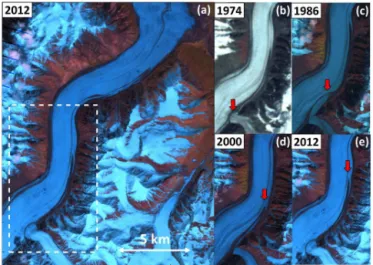
There are many looped moraines on the main stream in-duced by the tributary’s surge (Fig. 3a). During the period between 1973 and 2014, we observed the two surge events, in 1973–1974 (Fig. 3b) and 2009–2010 (Fig. 3e), and could not identify any surges between 1974 and 2009.
5 Discussion and conclusion
1430 T. Abe et al.: Twelve-year cyclic surging episodes at Donjek Glacier
Figure 2.Ice speeds and area near the terminus.(a)Temporal changes of the ice speed (red) and the terminus area (blue). The ice speed data are averaged over the section between 0 and 5 km along the flow line shown in Fig. 1a. The error bars indicate the mean speed in the non-glacial region. The black line indicates the long-term change of the terminus area. The dotted line boxes mark the areas shown in(b)
and(c).(b)Temporal change of the ice speed associated with the 2001 event.(c)Same as(b)except for the 2013 event. The black dotted line marks the peak in ice speed during each event.
Figure 3.Spatial patterns of the looped moraines induced by the tributary surges shown in the Landsat images.(a)The near-terminus region of Donjek Glacier shown in Landsat 7 ETM+false colour composite image acquired on 6 June 2012. The white dotted box shows the enlarged areas shown in(b–e).(b)Snapshot on 19 July 1974 of the moraine movements (red arrow) generated by the 1973–1974 tributary’s surge.(c)Same as(b)except 25 July 1986.
(d)Same as(b)except 7 July 2000.(e)Same as(b)except 6 June 2012.
its 1961 surge. However, the timing of past surging events at Donjek Glacier from previous studies includes large un-certainties. Those data sources have very different spatial and temporal coverages than ours, and the active surging was largely judged from morphological observations. For in-stance, we could not find any descriptions of the activity of the surge at Donjek Glacier in the 1960s. Regarding the 1969 surge, Johnson (1972b) noted that the terminus advance was less than 500 m, which was much smaller than about 1 km advances of the earlier surges in 1935, 1961, and the recent three surges in 1989, 2001, and 2013. However, given the recent observations, we may argue that a mini-surge-like ac-celeration (so-called pulse) could cause the slight advance of the terminus in 1969, a mini event like the pulse-like events in 1995 and 2009 (Fig. 1c). In addition, according to John-son (1972a), there were no observations before 1935. Thus, we cannot say the surge initiated in 1935. Therefore, we do not merge these past events with our findings.
and Holdsworth, 2002). The 12-year recurrence interval is as short as the latest interval at Lowell Glacier (Bevington and Copland, 2014). Lowell Glacier experienced five surges between 1948 and 2013, and the surge-cycle recurrence in-terval (12–20 years) has been shortening over time, which is interpreted as being due to a strongly negative mass balance since the 1970s or earlier (Bevington and Copland, 2014). Variegated Glacier is one of the most famous surge-type glaciers in Alaska, and its surge cycle has been well stud-ied (Eisen et al., 2001, 2005). Eisen et al. (2001) attributed the variability in the recurrence intervals to the variable an-nual mass balance. However, in contrast to the Lowell and Variegated glaciers, whose average recurrence intervals are 15.25 (Bevington and Copland, 2014) and 15 years (Eisen et al., 2005), respectively, the recurrence interval at Donjek Glacier is not only shorter but also apparently less variable over time, which we consider as significant differences de-spite the three surge-type glaciers sharing a similar climate.
The behaviour of Donjek Glacier is similar to Medvezhiy Glacier in Tajikistan (Dolgoushin and Osipova, 1975; Cuf-fey and Paterson, 2010), in that both have a short recurrence interval (10–14 years) and both have apparent geometrical control of the surging area. Medvezhiy Glacier lies in the west Pamir Mountains, and its surging activity was exten-sively monitored in the 1960s–1970s (Dolgoushin and Os-ipova, 1975). Medvezhiy Glacier has a wider accumulation area at an elevation of 4600–5500 m, but the surges are con-fined to the 8 km long ice tongue in the narrow valley, sepa-rated by a steep ice fall that drops by 800 m per 1 km (Dol-goushin and Osipova, 1975). Although the slope changes on Donjek Glacier are smaller, the significant valley constriction may generate a steep surface slope in the quiescent phase around the narrowing zone due to the mass transport from upstream (see the Supplement). As such, the apparent reg-ularity of the recurrence interval may be due to the rather steady flow speed upstream. Moreover, we consider that the surge is independent from the tributary’s surge. This is be-cause the interval of the tributary’s surge is 36 years, which is much longer than that of the main stream’s.
At Medvezhiy Glacier, the observed maximum speed ex-ceeds 100 m d−1, and the active phase initiates in winter, last-ing about 3 months (Cuffey and Paterson, 2010). At Varie-gated Glacier, the surge also initiates from autumn to win-ter and the maximum speed is 50 m d−1 during the 1982– 1983 surge (Kamb et al., 1985). At Bering Glacier, a sim-ilar behaviour (speed exceeding 10 m d−1, and winter ini-tiation) is observed in the 2008–2011 surge (Burgess et al., 2012). The recurrence interval is about 18 years. Sim-ilar behaviour has also been confirmed at Lowell Glacier (Bevington and Copland, 2014). These sudden speed-ups in autumn–winter and rapid slow-downs in early summer are thought to arise from the hydrological regulation mechanism. The mechanism, which involves a destruction of tunnel-like channels and subsequent change into a linked-cavity sys-tem that increases the water pressure, has been proposed
based on detailed observations of the 1982–1983 surge at Variegated Glacier (Kamb et al., 1985). Thus, such surges are often termed an Alaskan-type surge. Meanwhile, our ob-served maximum speed reached∼5 m d−1at most, and we could not determine the initiation season. It is likely, how-ever, that we have missed much higher speeds and winter initiation due to the coarse temporal resolution in our veloc-ity data and difficulties for optical image matching caused by the lack of identifiable surface features when the glacier is snow-covered. The 12-year recurrence interval is appar-ently shorter than that in a Svalbard-type surge, whose cy-cle is thought to be 50 years or much longer (Murray et al., 2003; Jiskoot, 2011). Moreover, the active duration is much shorter than that of Svalbard-type, and the flow speed seems to have rapidly slowed down after the active phase. The observed multi-year acceleration may include small ac-celeration events or mini-surges that redistribute thickening and thinning (Raymond and Harrison, 1988; Harrison and Post, 2003) during the build-up phase. Thus, we consider that the surge phase of the two events is about 1 year, and that Donjek Glacier presumably has the Alaskan-type surge.
Based on these findings, we argue that the cyclic surging at Donjek Glacier occurs as follows. In the quiescent phase, ice delivered from the upstream area stores up at the highly nar-rowed area (Fig. 1a), causing local thickening. The ice thick-ening generates a steeper slope (Fig. S3 in the Supplement) with a corresponding higher driving stress. When the ice thickness reaches a critical value, the glacier starts to speed up. We do not claim, however, that this driving stress itself is high enough to initiate the surging; that is, the thickening of ice and steeper slope are not the direct cause of surging. Rather, thickened ice upstream is just a pre-condition prior to surging. However, as the ice thickness increases, the vol-ume of englacial water storage will also increase, which can supply a greater basal water flux and increase its pressure, thereby allowing the higher speed during the surging event (Lingle and Fatland, 2003; Abe and Furuya, 2015). During the surge, the inefficient subglacial drainage system and the sufficient englacial water volume can maintain higher veloc-ity. After the mass redistribution terminates, the thickness in the reservoir zone will again increase for the next event.
The next event of Donjek Glacier is likely to occur around 2025. To test the model proposed here, we need detailed ob-servations of not only ice velocities but also the associated geometric and hydrological changes.
6 Data availability
1432 T. Abe et al.: Twelve-year cyclic surging episodes at Donjek Glacier The Supplement related to this article is available online
at doi:10.5194/tc-10-1427-2016-supplement.
Acknowledgements. We acknowledge JSPS-KAKENHI grant number 24651001 (Masato Furuya) and grant-in-aid for JSPS fellows (Takahiro Abe: 15J01952 and Daiki Sakakibara: 14J02632) for supporting this study. The comments from Luke Copland and Dan Shugar were helpful to improve the original manuscript.
Edited by: J. O. Hagen
References
Abe, T. and Furuya, M.: Winter speed-up of quiescent surge-type glaciers in Yukon, Canada, The Cryosphere, 9, 1183–1190, doi:10.5194/tc-9-1183-2015, 2015.
Bevington, A. and Copland, L.: Characteristics of the last five surges of Lowell Glacier, Yukon, Canada, since 1948, J. Glaciol, 60, 113–123, 2014.
Burgess, E. W., Forster, R. R., Larsen, C. F., and Braun, M.: Surge dynamics on Bering Glacier, Alaska, in 2008–2011, The Cryosphere, 6, 1251–1262, doi:10.5194/tc-6-1251-2012, 2012. Burgess, E. W., Foster, R. R., and Larsen C. F.: Flow
veloc-ities of Alaskan glaciers, Nature Communications, 4, 2146, doi:10.1038/ncomms3146, 2013.
Clarke, G. K. C. and Holdsworth, G.: Glaciers of the St. Elias Mountains, in: Satellite Image Atlas of Glaciers of the World, edited by: Williams Jr., R. S. and Ferrigno, J. G., USGS, Denver, Colorado, USA, USGS Professional Paper 1386-J, J301-J327, 2002.
Clarke, G. K. C., and Matthews, W. H.: Estimates of the magnitude of glacier outburst floods from Lake Donjek, Yukon Territory, Canada, Can. J. Earth Sci., 18, 1452–1463, 1981.
Cuffey, K. M. and Paterson, W. S. B.: The Physics of Glaciers, 4th Edn., Elsevier, Oxford, UK, 2010.
Dolgoushin, L. D. and Osipova, G. B.: Glacier surges and the prob-lem of their forecasting, IAHS-AISH Publ. No. 104, 292–304, 1975.
Eisen, O., Harrison, W. D., and Raymond, C. F.: The surges of Var-iegated Glacier, Alaska, U.S.A., and their connection to climate and mass balance, J. Glaciol., 47, 351–358, 2001.
Eisen, O., Harrison, W. D., Raymond, C. F., Echelmeyer, K. A., Bender, G. A., and Gorda, J. L. D.: Variegated Glacier, Alaska, USA: a century of surges, J. Glaciol., 51, 399–406, 2005. Fitch, A. J., Kadyrov, A., Christmas, W. J., and Kittler, J.:
Orienta-tion CorrelaOrienta-tion. in British Machine Vision Conference, Cardiff, UK, 133–142, 2002.
Frappé, T.-P. and Clarke, G. K. C.: Slow surge of Trapridge Glacier, Yukon Territory, Canada, J. Geophys. Res., 112, F03S32, doi:10.1029/2006JF000607, 2007.
Harrison, W. D., and Post, A. S.: How much do we really know about glacier surging?, Ann. Glaciol., 36, 1-6, 2003.
Heid, T. and Kääb, A.: Evaluation of existing image matching meth-ods for deriving glacier surface displacements globally from op-tical satellite imagery, Remote Sens. Environ., 118, 339–355, doi:10.1016/j.rse.2011.11.024, 2012.
Jiskoot, H.: Glacier surging, in: Encyclopedia of snow, ice and glaciers, edited by: Singh, V. P., Singh, P., and Haritashya, U. K., Springer, Dordrecht, The Netherlands, 2011.
Johnson, P. G.: A possible advanced hypsithermal position of the Donjek Glacier, Arctic, 25, 302–305, 1972a.
Johnson, P. G.: The morphological effects of surges of the Donjek Glacier, St. Elias Moutains, Yukon Territory, Canada, J. Glaciol., 11, 227–234, 1972b.
Kamb, B., Raymond, C. F., Harrison, W. D., Engelhardt, H., Echelmeyer, K. A., Humphrey, N., Brugman, M. M., and Pfeffer, T.: Glacier Surge Mechanism: 1982–1983 Surge of Variegated Glacier, Alaska, Science, 227, 469–479, 1985.
Larsen, C. F., Burgess, E., Arendt, A. A., O’Neel, S., John-son, A. J., and Kienholz, C.: Surface melt dominates Alaska glacier mass balance, Geophys. Res. Lett., 42, 5902–5908, doi:10.1002/2015GL064349, 2015.
Lingle, C. S. and Fatland, D. R.: Does englacial water storage drive temperate glacier surge?, Ann. Glaciol., 36, 14–20, 2003. Luthcke, S. B., Sabaka, T. J., Loomis, B. D., Arendt, A. A.,
Mc-Carthy, J. J., and Camp, J.: Antarctica, Greenland and Gulf of Alaska land-ice evolution from an iterated GRACE global mas-con solution, J. Glaciol., 59, 613–631, 2013.
McNabb, R. W. and Hock, R.: Alaska tidewater glacier terminus po-sitions, 1948–2012, J. Geophys. Res.-Earth, 119, 153–167, 2014. Meier, M. F. and Post, A.: What are glacier surges?, Can. J. Earth
Sci., 6, 807–817, 1969.
Murray, T., Strozzi, T., Luckman, A., Jiskoot, H., and Christakos, P.: Is there a single surge mechanism? Contrasts in dynamics be-tween glacier surges in Svalbard and other regions, J. Geophys. Res., 108, 2237, doi:10.1029/2002JB001906, 2003.
NSIDC (National Snow and Ice Data Center): The Randolph Glacier Inventory version 4.0, available at: http://www.glims.org/ RGI/rgi40_dl.html, last access: July 2016.
Pfeffer, W. T., Arendt, A. A., Bliss, A., Bolch, T., Cogley, J. G., Gardner, A. S., Hagen, J.-O., Hock, R., Kaser, G., Kienholz, C., Miles, E. S., Moholdt, G., Mölg, N., Paul, F., Radi´c, V., Rastner, P., Raup, B. H., Rich, J., Sharp, M. J., and the Ran-dolph consortium: The RanRan-dolph Glacier Inventory: a glob-ally complete inventory of glaciers, J. Glaciol., 60, 537–552, doi:10.3189/2014JoG13J176, 2014.
Post, A.: Distribution of surging glaciers in western North America, J. Glaciol., 8, 229–240, 1969.
Raymond, C. F.: How do glaciers surge? A review, J. Geophys. Res., 92, 9121–9134, 1987.
Raymond, C. F. and Harrison, W. D.: Evolution of Variegated Glacier, Alaska, U.S.A., prior to its surge, J. Glaciol., 34, 154– 169, 1988.
Sakakibara, D. and Sugiyama, S.: Ice-front variations and speed changes of calving glaciers in the Southern Patagonia Icefield from 1984 to 2011, J. Geophys. Res.-Earth, 119, 2541–2554, 2014.
USGS (U.S. Geological Survey) EarthExplorer: Landsat images, available at: http://earthexplorer.usgs.gov, last access: 5 June 2016.