M A J O R A R T I C L E
Transcriptional Changes That Characterize the
Immune Reactions of Leprosy
Kathryn M. Dupnik,1Thomas B. Bair,2Andressa O. Maia,4Francianne M. Amorim,4Marcos R. Costa,5
Tatjana S. L. Keesen,4,aJoanna G. Valverde,4Maria do Carmo A. P. Queiroz,6Lúcio L. Medeiros,10Nelly L. de Lucena,8 Mary E. Wilson,3Mauricio L. Nobre,9,7,11,12Warren D. Johnson Jr,1and Selma M. B. Jeronimo4,7,12
1Division of Infectious Diseases and Center for Global Health, Weill Cornell Medical College, New York, New York;2Iowa Institute for Human Genetics,
University of Iowa, and3Departments of Internal Medicine and Microbiology, University of Iowa and the VA Medical Center, Iowa City;4Department of Biochemistry,5Brain Institute,6Hospital Onofre Lopes, and7Institute of Tropical Medicine of Rio Grande do Norte, Universidade Federal do Rio Grande do Norte;8Laboratório Luchiari,9Hospital Giselda Trigueiro, Natal,10Secretaria da Saúde, Mossoró, Rio Grande do Norte,11Post-graduate Program in Tropical Medicine, Oswaldo Cruz Institute, Fiocruz, Rio de Janeiro, and12National Institute of Science and Technology of Tropical Diseases, Salvador, Bahia, Brazil
Background. Leprosy morbidity is increased by 2 pathologic immune reactions, reversal reaction (RR) and
er-ythema nodosum leprosum (ENL).
Methods. To discover host factors related to immune reactions, global transcriptional profiles of peripheral
blood mononuclear cells were compared between 11 RR, 11 ENL, and 19 matched control patients, with confi rma-tion by quantitative polymerase chain reacrma-tion. Encoded proteins were investigated in skin biopsy specimens by means of immunohistochemistry.
Results. There were 275 genes differentially expressed in RR and 517 differentially expressed in ENL on the
mi-croarray. Pathway analysis showed immunity-related pathways represented in RR and ENL transcriptional profiles, with the“complement and coagulation”pathway common to both. Interferonγwas identified as a significant up-stream regulator of the expression changes for RR and ENL. Immunohistochemical staining of skin lesions showed increased C1q in both RR and ENL.
Conclusions. These data suggest a previously underrecognized role for complement in the pathogenesis of both
RR and ENL, and we propose new hypotheses for reaction pathogenesis.
Keywords. leprosy; reversal reaction; erythema nodosum leprosum; complement.
Leprosy, or Hansen’s disease, remains a significant chal-lenge to global health despite the availability of antibi-otic therapy. A total of 232 857 cases were reported in 2012, including 33 303 new cases in Brazil [1]. Infection withMycobacterium leprae,the causative agent of lep-rosy, manifests as a spectrum of clinical presentations. These range from the tuberculoid form, with few skin
lesions and strong cell-mediated immune response, to the lepromatous form (LL), with disseminated disease and predominant humoral response [2]. Individuals with intermediate immune response toM. leprae devel-op“borderline”clinical forms: borderline tuberculoid (BT), borderline-borderline, and borderline leproma-tous (BL) [2]. About 30% of persons with leprosy will develop a pathologic immune reaction of leprosy, either reversal reaction (RR) or erythema nodosum leprosum (ENL) [3]. These reactions are common during thefirst 3 months of antileprosy therapy but can occur before, during, or after treatment of leprosy.
Thefirst common reaction, RR, results in swelling and inflammation of existing skin lesions with increas-ing neuritis and nerve damage. It is thought to be relat-ed to an augmentrelat-ed cell-mrelat-ediatrelat-ed immune response to
M. lepraeantigens in the skin and nerves in persons with borderline forms of leprosy [4,5]. Clinical risk fac-tors for RR include increased age, >5 skin lesions, and
Received 22 May 2014; accepted 4 October 2014.
Presented in part: 18th International Leprosy Congress, Brussels, Belgium, 19 September 2013, Abstract O-201.
aPresent affiliation: Centro de Biotecnologia, Universidade Federal da Paraíba,
João Pessoa, Paraíba, Brazil.
Correspondence: Kathryn M. Dupnik, MD, Weill Cornell Medical College Center for Global Health, 402 E 67th St, 2nd Floor, New York, NY 10021 (kad9040@med. cornell.edu).
The Journal of Infectious Diseases®
© The Author 2014. Published by Oxford University Press on behalf of the Infectious Diseases Society of America. All rights reserved. For Permissions, please e-mail: [email protected].
DOI: 10.1093/infdis/jiu612
Journal of Infectious Diseases Advance Access published December 18, 2014
at Karolinska Institutet on January 20, 2015
http://jid.oxfordjournals.org/
highM. lepraebacterial load [6]. A pronounced T-helper (Th) 1–type response toM. lepraeantigens has been documented in the skin of patients with RR [7]. Persons with history of RR can maintain an altered response to M. lepraeantigen that differs from patients with nonreaction leprosy for years after resolution of RR [8]. The other common reaction, ENL, occurs in leproma-tous (BL or LL) leprosy with painful subcutaneous nodules and systemicfindings, such as fever, arthritis, nephritis, and panni-culitis [9]. Its pathogenesis seems to be related to formation and deposition of immune complexes in skin and organs [9]. Risk factors for ENL include LL clinical form and high bacterial load [10].
The immune reactions of leprosy are typically chronic and re-current and can require years of treatment with corticosteroids or other immunomodulatory medications [10]. Neurologic se-quelae from leprosy reactions can be irreversible even with ap-propriate therapy, significantly increasing the morbidity and disability due to leprosy [11]. Potential biomarkers have been proposed for RR and ENL but have not been validated for predicting reactions [12,13]. Transcriptional profiling of skin le-sions has shown differences between tuberculoid and leproma-tous skin lesions [14], although these were not studied in relation to systemic immune profiles in blood leukocytes. In-creased interferon (IFN)αpathway transcripts in RR lesions suggest its involvement in pathogenesis [15], and a recent study showed that persons with history of RR had a unique gene expression profile in response to M. lepraeantigen in vitro [8]. Studies of the transcriptional profiles of immune cells from subjects with active RR and ENL are needed to un-derstand the systemic immune response during reactions. We hypothesized that RR and ENL are caused by distinctly different immune responses. To test this hypothesis, we generated tran-scriptional profiles of peripheral blood mononuclear cells (PBMCs) of carefully characterized subjects with symptomatic leprosy immune reactions and matched controls with validation studies including quantitative polymerase chain reaction (qPCR),flow cytometry, and immunohistochemistry.
MATERIALS AND METHODS
Human Subjects
Adult patients with leprosy were enrolled from Hansen’s disease treatment centers in Rio Grande do Norte, Brazil. Leprosy clinical forms were assigned by a trained dermatologist (M. d. C. A. P. Q., L. L. M., or M. L. N.) based on Ridley-Jopling criteria [2]. Diagnoses of RR or ENL were based on clinicalfi nd-ings [16,17]. Excluded from this study were persons with known immunodeficiency or who had received corticosteroids within 7 days or thalidomide within 28 days of enrollment.
Transcript microarrays were obtained from 22 patients with leprosy with immune reaction (11 RR and 11 ENL) and 19 con-trols without reactions matched to cases for age, sex, leprosy
clinical form, and stage of treatment. PBMCs for reverse-transcription qPCR validation were derived from a subset of these participants and an additional 28 persons (11 RR, 6 ENL, and 11 controls). Monocyte populations were compared in the different leprosy clinical groups usingflow cytometry of PBMCs. Skin biopsy immunohistochemical studies were completed for 16 patients with leprosy (3 RR, 3 ENL, 7 BT con-trols, and 3 BL/LL controls).
PBMC Isolation and RNA Extraction
PBMCs were isolated from heparinized peripheral blood using a Ficoll-Paque PLUS gradient (GE Healthcare Life Sciences). RNA was isolated using Trizol (Life Technologies) and purified with a RNeasy MinElute Cleanup Kit (Qiagen) with on-column DNase treatment.
Microarray and Analysis
Preparation of RNA for hybridization to Illumina BeadChips (Ambion) was performed at the University of Iowa DNA Core Facility using the manufacturer’s protocol. After hybridi-zation, the arrays were washed, blocked, and stained according to the Illumina Whole-Genome Gene Expression Direct Hy-bridization Assay protocol. BeadChips were scanned with the Illumina iScan System and data collected using GenomeStudio software (Illumina, version 2011). Data sets were compared using Rank Products Analysis (Bioconductor utilities;www. bioconductor.org, last accessed December 1, 2014) to optimize comparison of array groups of small sample size and with var-iability inherent in human clinical samples [18,19]. Quantile normalizedfluorescence results were analyzed with the Rank-Prod library using RPadvance software in R package (v2.36.0, http://www.r-project.org, last accessed December 1, 2014), con-sidering arrays run on separate days as different origins. The re-sultant orders were compared with topGene software, with a percentage false-positive (FPR) cutoff of 0.05. Reported fold changes for the array are given as log2fold change.
Transcripts with a FPR cutoff≤0.05 and fold change ≥1.5 were used for pathway analyses. Kyoto Encyclopedia of Genes and Genomes (KEGG) and Gene Ontology (GO) Biological Process pathways were generated with Webgestalt (2014, Vanderbilt University) [20] with Bonferroni correction. Inge-nuity Pathway Analysis (IPA) (Qiagen) was completed using experimentally observed direct and indirect relationships for humans.
qPCR With Taqman Low Density Arrays
Significantly changed microarray transcripts were selected for validation with Taqman Low Density Arrays. PBMC-derived complementary DNA was applied in duplicate to custom Taq-man Low Density Arrays (Life Technologies). Fluorescence was normalized to the array baseline in Expression Suite software (version 1.0; Life Technologies) and mean cycle threshold
at Karolinska Institutet on January 20, 2015
http://jid.oxfordjournals.org/
(Ct) values were compared using 2-tailed ttests.Delta-delta cycle threshold (ΔΔCt) values were converted to fold changes using this calculation: fold change = 2(−ΔΔCt)
.
Immunohistochemistry of Skin Biopsy Specimens
Skin biopsy specimens were collected in formalin andfixed in paraffin. After sectioning, slides were deparaffinized and sub-jected to antigen retrieval. Sections were stained with rabbit anti-human C1q (clone 9A7; Abcam) and mouse anti-human CD21 (clone EP3093; Abcam) with secondary staining with goat anti-rabbit AlexaFluor488 and goat anti-mouse-Alexa-Fluor546 (Life Technologies). Stained tissue sections were im-aged using a Zeiss Examiner.Z1 AX10 confocal (LSN 7100) microscope and recorded using Zen 2010BSP1 software (Zeiss). Intensity, laser range, and gain were constant. For each biopsy specimen, 2 adjacent 15-section micrographs were obtained 1 mm from the edge of the specimen at the der-mal-epidermal border with an additional 2 dermal photographs just internal to the initial photographs. Mean intensities of fluorescence were normalized to the BT group for each day of staining and compared using analysis of variance with Tukey posttest. Imaging and analysis were completed by authors (F. M. A. and M. R. C.) blinded to the group assignment.
Flow Cytometry
A total of 250 000 PBMCs were stained with anti– CD14-allophycocyanin–cyanine 7 (Ebioscience), and 50 000 events were counted using a FACS-Canto IIflow cytometer (Becton Dickinson) and recorded with FACSDiva software (Becton Dickinson). Data were analyzed using FlowJo software (v 9.5.3, TreeStar) with monocyte gate and CD14 positivity as-signed as inSupplementary Figure 1A. Monocyte populations were compared using analysis of variance with Tukey multiple-comparison tests for normally distributed data, and Kruskal– Wallis test with Dunn multiple comparison for non-normally distributed data.
Ethical Considerations
The study was reviewed and approved by the institutional review boards of the Universidade Federal do Rio Grande do Norte, Bra-zil’s National Ethical Review Board, and Weill Cornell Medical College. The Brazilian institutional review board is registered with the US National Institutes of Health. All participants provid-ed written informprovid-ed consent for participation in the study.
RESULTS
Study Population
The study population for the transcript microarray included 22 patients with leprosy with immune reaction (11 RR and 11 ENL) matched 1:1 for age, sex, leprosy clinical form, and stage of treatment with a control patient without reaction
(Table1). PBMCs used for qPCR were from a subset of these subjects and another 28 patients with leprosy. Additional sam-ples included in the RR qPCR validation were RR (n = 11) and non-RR controls (n = 7). Age (mean, 50 vs 51 years;P= .89), sex (59.1% vs 55.6% male;P= .82), and clinical form of leprosy (P= .96) did not differ significantly between RR and non-RR groups. Additional samples included in the ENL qPCR valida-tion were ENL (n = 6) and non-ENL controls (n = 4). Age (45 vs 51 years;P= .33), sex (82.4% vs 60% male;P= .24), and clinical
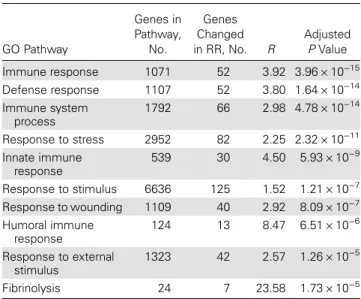
Table 2. Top 10 GO Biological Process Pathways Among the Set of Differentially Expressed Genes in RR
GO Pathway
Genes in Pathway,
No.
Genes Changed in RR, No. R
Adjusted
PValue
Immune response 1071 52 3.92 3.96 × 10⁻¹⁵
Defense response 1107 52 3.80 1.64 × 10⁻¹⁴
Immune system process
1792 66 2.98 4.78 × 10⁻¹⁴
Response to stress 2952 82 2.25 2.32 × 10⁻¹¹
Innate immune response
539 30 4.50 5.93 × 10⁻⁹
Response to stimulus 6636 125 1.52 1.21 × 10⁻⁷
Response to wounding 1109 40 2.92 8.09 × 10⁻⁷
Humoral immune response
124 13 8.47 6.51 × 10⁻⁶
Response to external stimulus
1323 42 2.57 1.26 × 10⁻⁵
Fibrinolysis 24 7 23.58 1.73 × 10⁻⁵
Abbreviations: GO, Gene Ontology; RR, reversal reaction.
Table 1. Baseline Characteristics of the Patients With Leprosy Included in the Microarray Analysis
Characteristic
RR (n = 11)
Controls Without RR
(n = 11)
ENL (n = 11)
Controls Without ENL
(n = 11)
Male sex, % 54.5 54.5 81.8 81.8 Age, mean
(range), y
47.6 (22–73)
46.8 (28–65)
43.9 (23–65)
48.3 (27–69)
Leprosy treatment status, No.
Pretreatment 5 6 3 5
On treatment 5 5 2 6
Posttreatment 1 0 6 0
Ridley-Jopling clinical form of leprosy
BT 3 2 0 0
BB 3 4 0 0
BL 5 5 6 6
LL 0 0 5 5
Abbreviations: BB, borderline-borderline; BL, borderline lepromatous; BT, borderline tuberculoid; ENL, erythema nodosum leprosum; LL, lepromatous leprosy; RR, reversal reaction.
at Karolinska Institutet on January 20, 2015
http://jid.oxfordjournals.org/
form of leprosy (P= .47) did not differ significantly different be-tween ENL and non-ENL groups.
Pathway Analysis of Transcriptomes
Thefirst aim of this study was to characterize the transcriptome profiles associated with the transition of leprosy to either RR or ENL. Comparing RR with non-RR controls, there were 275 dif-ferentially expressed genes (n = 203 increased and n = 72 de-creased in RR). Comparing ENL with non-ENL controls, there were 517 differentially expressed genes (n = 300 increased and n = 217 decreased in ENL). Differentially expressed genes are listed inSupplementary Table 1.
Considering all differentially expressed genes in RR, the top GO Biological Process pathways were related to the immune re-sponse: immune response, defense response, immune system process, response to stress, and innate immune response (Table 2). Consistently, the top 3 KEGG pathways were Table 3. Significant KEGG Pathways With Pathway Transcripts
Differentially Transcribed in RR
KEGG Pathway (Adjusted
PValue) Transcriptsa(Fold Change;PValue)
Staphylococcus aureus
infection (2.56 × 10⁻¹³
)
HLA-DRB1 (−1.59; <.0001), C1QB (2.21; <.0001), C1QA (1.64; .0004), HLA-DQA1 (1.61; .0001), FCGR1A (2.78; <.0001), FPR1 (1.80; .0001), C1QC (1.77; <.0001), C2 (2.31; <.0001), FCGR3B (2.12; <.0001), HLA-DOB (−1.50; .0001), FPR2 (2.28;
<.0001) Complement and coagulation
cascades (4.85 × 10⁻⁹
)
C1QB (2.21; <.0001), SERPING1 (2.17; <.0001), C1QA (1.64; .0004), PLAU (2.52; <.0001), PLAUR (1.84; .0002), C1QC (1.77; <.0001), PROS1 (1.50; .0003), C2 (2.31; <.0001), THBD (1.78; .0001)
Systemic lupus erythematosus (7.32 × 10⁻⁹)
HLA-DRB1 (−1.59; <.0001), C1QB (2.21; <.0001), C1QA (1.64; .0004), HIST2H2AA4 (1.72; <.0001), HLA-DQA1 (1.61; .0001), FCGR1A (2.78; <.0001), C1QC (1.77; <.0001),
HIST2H2AA3 (1.77; <.0001), C2 (2.31; <.0001), FCGR3B (2.12; <.0001),HLA-DOB (−1.50; .0001)
Hematopoietic cell lineage (4.50 × 10⁻⁸
)
HLA-DRB1 (−1.59; <.0001),FCER2 (−1.5; <.0001), FCGR1A (2.78;
<.0001),CD19 (−1.76; <.0001), ITGB3 (1.63; .0001), ILI1R2 (2.12; <.0001), MME (1.59; .0003), ITGA2B (2.04; <.0001), ANPEP (1.82; <.0001)
Cytokine-cytokine receptor interaction (7.38 × 10⁻⁸
)
CCL7 (3.03; <.0001), PF4V1 (1.81; <.0001),CXCR5 (−1.65; <.0001),
CXCL10 (2.02; <.0001),CCR7 (−1.73; <.0001), CCL2 (2.90;
<.0001), ILIR2 (2.12; <.0001), CXCL1 (1.64; .0001), TNFRSF12A (1.94; <.0001), CCL3 (1.67; .0002),CD27 (−1.60; <.0001),
CXCR1 (1.61; <.0001), CCL3L1 (1.61; .0001)
Phagosome (4.13 × 10⁻⁷
) MARCO (1.77; <.0001), CTSL1 (2.11; <.0001),HLA-DRB1 (−1.59; <.0001), CLEC7A (1.71;
.0002), TUBB2A (1.52; .0002), HLA-DQA1 (1.61; .0001), FCGR1A (2.78; <.0001), ITGB3 (1.63; .0001), FCGR3B (2.12; <.0001),HLA-DOB (−1.50; .0001)
Rheumatoid arthritis (1.35 × 10⁻⁶
)
CTSL1 (2.11; <.0001),HLA-DRB1 (−1.59; <.0001), HLA-DQA1
(1.61; .0001), CCL2 (2.90; <.0001), CXCL1 (1.64; .0001), CCL3 (1.67; .0002), CCL3L1 (1.61; .0001),HLA-DOB (−1.5; .0001)
Chemokine signaling pathway (3.09 × 10⁻⁶
)
CCL7 (3.03; <.0001), PF4V1 (1.81; <.0001),CXCR5 (−1.65; <.0001),
CXCL10 (2.02; <.0001),CCR7 (−1.73; <.0001), CCL2 (2.90;
<.0001), CXCL1 (1.64; .0001), CCL3 (1.67; .0002), CXCR1 (1.61; <.0001), CCL3L1 (1.61; .0001)
Table 3 continued.
KEGG Pathway (Adjusted
PValue) Transcriptsa(Fold Change;PValue)
Chagas disease (.001) C1QB (2.21; <.0001), CCL3 (1.67; .0002), C1QA (1.64; .0004), CCL2 (2.90; <.0001), CCL3L1 (1.61; .0001), C1QC (1.77; <.0001) Leishmaniasis (.002) HLA-DRB1 (−1.59; <.0001),
HLA-DQA1 (1.61; .0001), FCGR3B (2.12; <.0001), FCGR1A (2.78; <.0001),HLA-DOB (−1.5; .0003)
ECM receptor interaction (.004)
SV2A (1.68; .0001),LAMA5 (−1.57; .0001), ITGA2B (2.04; <.0001), SDC4 (1.58; .0002), ITGB3 (1.63; .0001)
Osteoclast differentiation (.03) FOSL1 (1.79; <.0001), FCGR3B (2.12; <.0001), FCGR1A (2.78; <.0001), FOSB (1.68; .0001), ITGB3 (1.63; .0001)
Asthma (.03) HLA-DRB1 (−1.59; <.0001),
HLA-DQA1 (1.61; .0001),HLA-DOB (−1.5; .0001)
Toxoplasmosis (.04) HLA-DRB1 (−1.59; <.0001),
BCL2L1 (1.61; <.0001), HLA-DQA1 (1.61; .0001),HLA-DOB (−1.5; .0001),LAMA5 (−1.57; .0001)
Cell adhesion molecules (.04) HLA-DRB1 (−1.59; <.0001), CNTNAP2 (−2.03; <.0001), HLA-DQA1 (1.61; .0001), HLA-DOB (−1.5; .0001), SDC4 (1.58; .0002) Antigen processing and
presentation (.04)
CTSL1 (2.11; <.0001),HLA-DRB1 (−1.59; <.0001), HLA-DQA1
(1.61; .0001),HLA-DOB (−1.5; .0001)
Prion diseases (.04) C1QB (2.21; <.0001), C1QA (1.64; .0004), C1QC (1.77; <.0001)
Abbreviations: ECM, extracellular matrix; KEGG, Kyoto Encyclopedia of Genes and Genomes; RR, reversal reaction.
aDownregulated transcripts with negative fold-changes are in italics.
at Karolinska Institutet on January 20, 2015
http://jid.oxfordjournals.org/
Staphylococcus aureus infection (adjustedP= 2.56 × 10⁻¹³ ), complement and coagulation cascades (adjusted P= 4.85 × 10⁻⁹
), and systemic lupus erythematosus (adjustedP= 7.32 × 10⁻⁹
) (Table3). HLA genes (HLA-DRB1 and HLA-DOB),
C1Q, C1 esterase inhibitor (SERPING1), FPR 1, Fc fragment of IgG receptor (FcγR), and histone (HIST2H2AA3 and HIST2H2AA4) transcripts were represented in both sets of
pathways. The top canonical pathways for RR identified by IPA were granulocyte adhesion and diapedesis (P= 8 × 10⁻⁹
), agranulocyte adhesion and diapedesis (P= 1.35 × 10⁻⁷
), and B-cell development (P= 6.96 × 10⁻⁷
). IPA identified IFN-γas the most significant upstream regulator of the expression changes seen in the array (P= 1.44 × 10⁻¹³
), followed by immu-noglobulin (1.22 × 10⁻¹²
). The top associated IPA-identified Figure 1. Networks generated by Ingenuity Pathway Analysis for reversal reaction (RR) (A) and erythema nodosum leprosum (ENL) (B). Red indicates genes upregulated in reaction; green, genes downregulated in reaction; darker shades, greater magnitude of fold change; broken lines, for indirect inter-actions; solid lines, direct interinter-actions; arrows, activation; bars, inhibition.
at Karolinska Institutet on January 20, 2015
http://jid.oxfordjournals.org/
network for RR is shown in Figure1Aand includes pathogen receptors, chemokines and chemokine receptors, and molecules that interact with immunoglobulin.
Similar to RR, the top GO Biological Process pathways changed in ENL were related to the immune response: defense response, immune system process, response to bacterium, re-sponse to wounding, and immune rere-sponse (Table 4). The top 3 KEGG pathways wereS. aureusinfection (adjustedP= 1.9 × 10⁻¹⁶
), systemic lupus erythematosus (adjustedP= 7.37 × 10⁻¹⁴
), and cytokine-cytokine receptor interaction (adjusted
P= 8.48 × 10⁻¹⁰
) (Table5). The complement and coagulation pathway (adjustedP= 3.78 × 10⁻⁹
) was also associated with ENL. These pathways include components of the classic com-plement pathway, histones, cytokine receptors, and infl amma-tory response regulators. The top canonical pathways for ENL
identified by IPA were granulocyte adhesion and diapedesis (P= 1.46 × 10⁻¹²
), agranulocyte adhesion and diapedesis (P= 3.64 × 10⁻¹¹
), and interleukin 8 signaling (P= 2.68 × 10⁻⁶
). IPA identified CCL5 as the most significant upstream regulator of the expression changes in the array (P= 9.78 × 10⁻¹⁶
), followed by IFN-γ(P= 8.88 × 10⁻¹⁵
). The top associated IPA-generated network for ENL is shown in Figure1Band in-cludes immunoglobulin receptors, pathogen recognition recep-tors, and chemokines.
Comparison of RR and ENL Transcriptomes
Another aim of this study was to describe the similarities and differences in gene expression in RR and ENL (compared with their respective controls). Considering all differentially ex-pressed genes, there were 379 transcripts unique to ENL, 137 Figure 1 continued.
at Karolinska Institutet on January 20, 2015
http://jid.oxfordjournals.org/
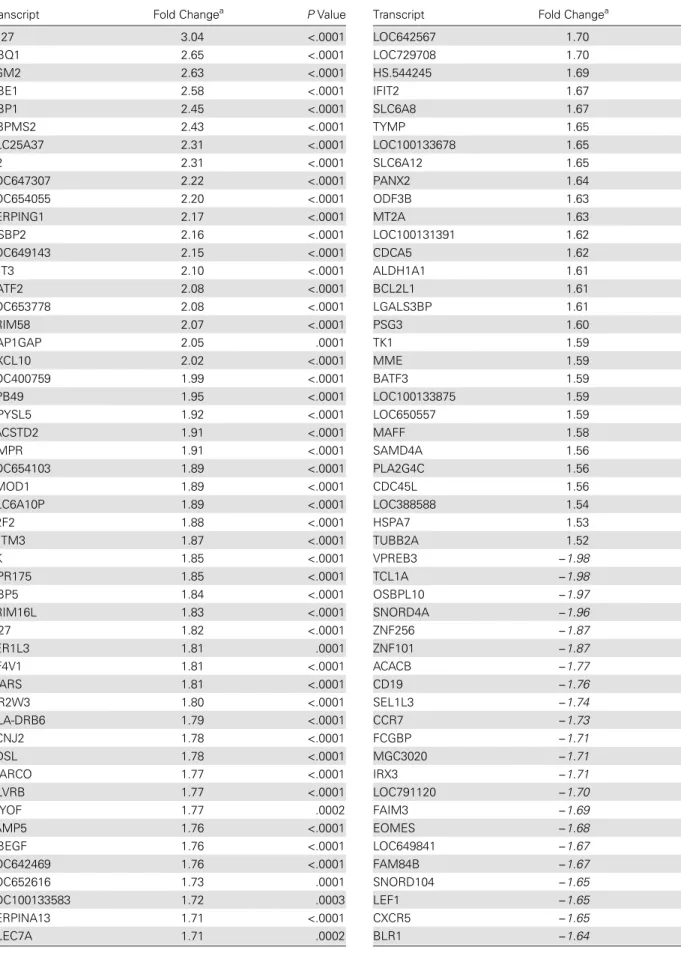
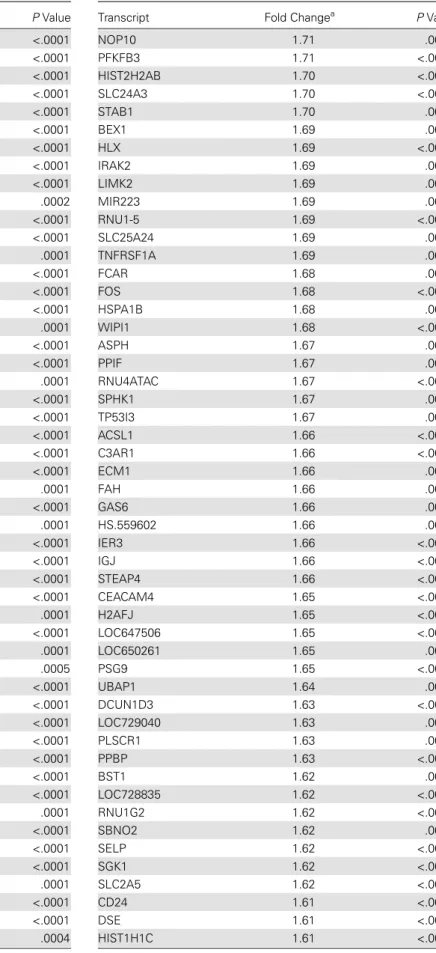
unique to RR, and 138 that had differential expression in both RR and ENL groups (Tables6–8). Of those genes with increased expression, 104 were unique to RR, 201 unique to ENL, and 99 with increased expression in both RR and ENL groups. Among genes with decreased expression during an immune reaction, 57 were unique to RR, 202 unique to ENL, and 15 with decreased expression in both groups.
A transcript uniquely increased in RR was CXCL10, which has previously been studied in association with RR [12]. Also increased in RR was transglutaminase 2 (TGM2), which is in-creased in autoimmune disease and may be related to antigen modification [21]. In the RR group, there were increased tran-script levels of pattern recognition receptor C-type lectin do-main family 7, member A (CLEC7A [dectin-1]), and a scavenger receptor, the macrophage receptor with collagenous structure (MARCO) [22]. There were decreased transcripts of B-cell-associated molecules CD79, CD19, and CD27 and T-cell signaling modulator CCR7. IPA biomarkers analysis identified chemokine (C-X-C motif ) ligand 10 (CXCL10) and Fc fragment of IgE, low affinity II (FCER2) as transcripts with differential levels unique to RR.
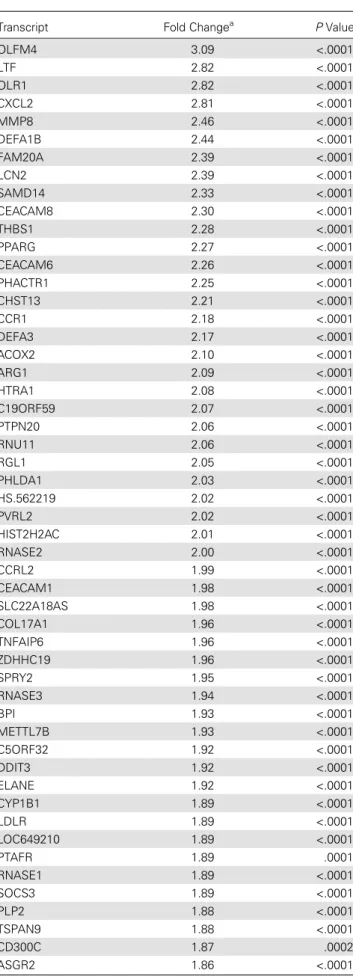
Transcripts uniquely increased in ENL included the comple-ment receptors C3AR1 and C5AR1 and 3 ribonucleases; RNASE1, RNASE2, and RNASE3. Uniquely decreased tran-scripts in ENL included interleukin 10 and cytotoxic t-lymphocyte associated protein 4 (CTLA4), modulators of T-cell responses. Decreased CTLA4 and interleukin 10 in ENL could either contribute to the inflammatory cascade ob-served clinically during ENL or reflect a relatively high level of the inhibitory protein in PBMCs of patients with leproma-tous leprosy without ENL. IPA biomarkers analysis identified 20 genes as uniquely differentially expressed in ENL compared with RR including the chemokine ligands CCL3L3 and CXCL8. Table 4. Top 10 GO Biological Process Pathways Among the Set of Differentially Expressed Genes in ENL
GO Pathway
Genes in Pathway,
No.
Genes Changed
in ENL,
No. R
Adjusted
PValue
Defense response 1107 83 3.39 1.55 × 10⁻²⁰
Immune system process 1792 101 2.54 1.55 × 10⁻¹⁶
Response to bacterium 349 42 5.43 4.23 × 10⁻¹⁶
Response to wounding 1109 75 3.05 1.67 × 10⁻¹⁵
Immune response 1071 73 3.08 3.54 × 10⁻¹⁵
Response to stress 2952 133 2.03 7.38 × 10⁻¹⁵
Inflammatory response 484 45 4.20 4.86 × 10⁻¹³
Response to biotic stimulus
613 50 3.68 1.89 × 10⁻¹²
Response to other organism
583 48 3.72 5.33 × 10⁻¹²
Abbreviations: ENL, erythema nodosum leprosum; GO, Gene Ontology.
Table 5. Significant KEGG Pathways With Pathway Transcripts Differentially Transcribed in ENL
KEGG Pathway (Adjusted
PValue) Transcriptsa
Staphylococcus aureus
infection (1.90 × 10⁻¹⁶
)
C1QB (3.27; <.0001), PTAFR (1.89; .0001), C1QA (1.82; <.0001), HLA-DQA1 (1.50; .0003), FCGR1A (2.55; <.0001), SELP (1.62; <.0001), FPR1 (2.10P< .0001), C1QC (2.61; <.0001), C5AR1 (1.83; <.0001),IL10 (−1.57; .0001), FCGR3B (1.61; .0002),
HLA-DRB5 (−2.22; <.0001), FPR2 (2.15; <.0001), C3AR1 (1.66; <.0001), FCAR (1.68; .0003) Systemic lupus
erythematosus (7.37 × 10⁻¹⁴)
HIST1H3F (1.52; .0001), HIST2H3C (1.54; .0002), HIST2H2AA4 (2.09; <.0001), HLA-DQA1 (1.50; .0003), H2AFJ (1.65; <.0001),
HIST2H2BE (1.77; <.0001), ELANE (1.92; <.0001),IL10 (−1.57; .0001), HIST1H3H (1.59; .0001), FCGR3B (1.61; .0002), HIST2H2AB (1.70; <.0001), C1QB (3.27; <.0001), C1QA (1.82; <.0001), FCGR1A (2.55; <.0001), C1QC (2.61; <.0001),
HIST2H2AA3 (1.98; <.0001), HIST2H2AC (2.00; <.0001), HLA-DRB5 (−2.22; <.0001)
Cytokine-cytokine receptor interaction (8.48 × 10⁻¹⁰
)
CCL7 (3.40; <.0001),IL11RA (−1.6; <.0001), CCL2 (2.70; <.0001), CXCL2 (2.81; <.0001),IL10 (−1.57; .0001), MPL (1.50; .0003),
CCR1 (2.18; <.0001), CCL4L2 (1.72; <.0001), IL8 (1.84; <.0001),
CCR3 (−1.63; <.0001), TNFRSF1A (1.69; .0005), IL1R2 (2.53; <.0001), CCL3L3 (1.72; <.0001), CXCL1 (2.63; <.0001),
TNFRSF12A (1.94; <.0001), CCL3 (2.0; <.0001), CXCR1 (1.67; <.0001), CCL3L1 (2.0; <.0001), PPBP (1.63; <.0001)
Chagas disease (1.54 × 10⁻⁹
) C1QB (3.27; <.0001), JUN (1.84; <.0001), C1QA (1.82; <.0001), CCL2 (2.70; <.0001), GNA15 (1.82; <.0001), IL8 (1.84; <.0001), C1QC (2.61; <.0001), TNFRSF1A (1.69; .0005), CCL3L3 (1.72; <.0001), CCL3 (2.0; <.0001),IL10 (−1.57; .0001), FOS (1.68; <.0001), CCL3L1 (2.0; <.0001) Complement and coagulation
cascade (3.67 × 10⁻⁹) C1QB (3.27; <.0001), C1QA (1.82;<.0001), PLAU (2.45; <.0001),
PLAUR (1.71; <.0001), C1QC (2.61; <.0001), F13A1 (1.51; .0001), C5AR1 (1.83; <.0001), VWF (1.82; <.0001), PROS1 (1.57; <.0001), THBD (2.83; <.0001), C3AR1 (1.66; <.0001) Rheumatoid arthritis
(4.85 × 10⁻⁹
)
CTSL1 (1.85; .0002), JUN (1.84; <.0001),CTLA4 (−1.77; .0004),
HLA-DQA1 (1.50; .0003), CCL2 (2.70; <.0001), IL8 (1.84; <.0001), CCL3L3 (1.72; <.0001), CXCL1 (2.63; <.0001), CCL3 (2.0; <.0001), FOS (1.68; <.0001), HLA-DRB5 (−2.22; <.0001), CCL3L1
(2.0; <.0001)
at Karolinska Institutet on January 20, 2015
http://jid.oxfordjournals.org/
Components of the innate immune response were increased in both RR and ENL, including C1q (C1QA, C1QB, and C1QC). Interestingly, both RR and ENL had increased expres-sion of hepcidin (HAMP) and cathelicidin (CAMP) antimicro-bial peptides. Defensins were increased in ENL (DEFA1, DEFA1B, DEFA3, and DEFA4) and in RR (DEFA4). Fc receptor-like 3 and Fc receptor-like A were both decreased in RR and ENL groups. IPA biomarkers analysis identified 12 Table 5 continued.
KEGG Pathway (Adjusted
PValue) Transcriptsa
Chemokine signaling pathway
(2.93 × 10⁻⁷) CCL7 (3.40; <.0001), CCR1 (2.18;<.0001), CCL4L2 (1.72; <.0001),
CCL2 (2.70; <.0001), GNG10 (1.59; .0005),CCR3 (−1.63; <.0001), IL8 (1.84; <.0001), CCL3L3 (1.72; <.0001), CXCL1 (2.63; <.0001), CCL3 (2.0; <.0001), CXCL2 (2.81; <.0001), CXCR1 (1.67; <.0001), CCL3L1 (2.0; <.0001), PPBP (1.63; <.0001) Cell adhesion molecules
(4.15 × 10⁻⁷
)
CD8A (−1.55; <.0001), ESAM (1.6; <.0001),CTLA4 (−1.77; .0004),
HLA-DQA1 (1.50; .0003), PVRL2 (2.02; <.0001), SELP (1.62; <.0001), SDC4 (1.88; .0001),CD6 (−1.68; .0001),CNTNAP2 (−1.78; <.0001), HLA-C (1.85; <.0001),
HLA-DRB5 (−2.22; <.0001), JAM3
(1.55; <.0001) Hematopoietic cell lineage
(8.40 × 10⁻⁷
)
CD8A (−1.55; <.0001), CD24 (1.61; <.0001),IL11RA (−1.61; <.0001),
FCGR1A (2.55; <.0001), ITGB3 (2.12; <.0001), IL1R2 (2.53; <.0001), GP9 (1.53; <.0001), HLA-DRB5 (−2.22; <.0001), ITGA2B
(2.36; <.0001), ANPEP (2.14; <.0001)
Osteoclast differentiation
(2.99 × 10⁻⁶) JUN (1.84; <.0001),.0003), FCGR1A (2.55; <.0001),CYLD (−1.56;
PPARG (2.27; <.0001), ITGB3 (2.12; <.0001), FOSB (1.96; <.0001), TNFRSF1A (1.69; .0005), FOS (1.68; <.0001), FCGR3B (1.61; .0002), FOSL1 (1.86; <.0001), SOCS3 (1.89; <.0001) Phagosome (1.86 × 10⁻⁵) CTSL1 (1.85; .0002), OLR1 (2.82;
<.0001), HLA-DQA1 (1.50; .0003), FCGR1A (2.55; <.0001), ITGB3 (2.12; <.0001), HLA-C (1.85; <.0001), FCGR3B (1.61; .0002), ITGB5 (1.57; .0001),HLA-DRB5 (−2.22; <.0001), FCAR (1.68; .0003), THBS1 (2.28; <.0001) Asthma (2.43 × 10⁻⁵
) FCER1A (−2.72; <.0001),IL10 (−1.57; .0001), RNASE3 (1.94; <.0001), HLA-DQA1 (1.50; .0003),
HLA-DRB5 (−2.22; <.0001),
MS4A2 (−1.90; <.0001)
Malaria (3.72 × 10⁻⁵
) IL10 (−1.57; .0001), SELP (1.62;
<.0001), CCL2 (2.70; <.0001),
GYPB (−2.45; <.0001), SDC4
(1.88; .0001), IL8 (1.84; <.0001), THBS1 (2.28; <.0001)
ECM receptor interaction (.0001)
GP9 (1.53; <.0001), VWF (1.82; <.0001), ITGB5 (1.57; .0001), SV2A (1.65; .0005), ITGA2B (2.36; <.0001), SDC4 (1.88; .0001), ITGB3 (2.12; <.0001), THBS1 (2.28; <.0001)
Leishmaniasis (.0004) JUN (1.84; <.0001),IL10 (−1.57; .0001), FOS (1.68; <.0001), HLA-DQA1 (1.50; .0003), FCGR3B (1.61; .0002), FCGR1A (2.55; <.0001),HLA-DRB5 (−2.22; <.0001)
Table 5 continued.
KEGG Pathway (Adjusted
PValue) Transcriptsa
Toxoplasmosis (.003) PPIF (1.67; .0005),BIRC3 (−1.59; .0002), HLA-DQA1 (1.50; .0003), LDLR (1.89; <.0001), TNFRSF1A (1.69; .0005),IL10 (−1.57; .0001),
HLA-DRB5 (−2.22; <.0001),
HSPA1B (1.68; .0001)
Amebiasis (.005) CXCL1 (2.63; <.0001),IL10 (−1.57; .0001), ARG1 (2.10; <.0001), GNA15 (1.82; <.0001), SERPINB2 (4.82; <.0001), IL8 (1.84; <.0001), IL1R2 (2.53; <.0001)
T-cell receptor signaling pathway (.006)
JUN (1.84; <.0001),CD8A (−1.55; <.0001),IL10 (−1.57; .0001),
CTLA4 (−1.77; .0004), NFKBIE (1.50; .0003), FOS (1.68; <.0001),
RASGRP1 (−1.64; .0003)
Antigen processing and presentation (.006)
CTSL1 (1.85; .0002),CD8A (−1.55; <.0001), HLA-C (1.85; <.0001), HLA-DQA1 (1.50; .0003), HLA-DRB5 (−2.22; <.0001), HSPA1B
(1.68; .0001) Autoimmune thyroid disease
(.008)
IL10 (−1.57; .0001), CTLA4 (−1.77; .0004), HLA-C (1.85; <.0001), DQA1 (1.50; .0003), HLA-DRB5 (−2.22; <.0001) NOD-like receptor signaling
pathway (.02)
CXCL1 (2.63; <.0001), CXCL2 (2.81; <.0001),BIRC3 (−1.59; .0002), CCL2 (2.70; <.0001), IL8 (1.84; <.0001)
Allograft rejection (.03) IL10 (−1.57; .0001), HLA-C (1.85; <.0001), HLA-DQA1 (1.50; .0003), HLA-DRB5 (−2.22; <.0001) P53 signaling pathway (.04) ATM (−1.92; <.0001),SESN1 (−1.59; .0001), TP53I3 (1.67;
.0004), GADD45G (1.59; .0006), THBS1 (2.28; <.0001)
Epithelial cell signaling in Helicobacter pylori infection (.04)
CXCL1 (2.63; <.0001), JUN (1.84; <.0001), CXCR1 (1.67; <.0001), JAM3 (1.56; <.0001), IL8 (1.84; <.0001)
PPAR signaling pathway (.04) GK (2.0; <.0001), ACOX2 (2.10; <.0001), ACSL1 (1.66; <.0001), OLR1 (2.82; <.0001), PPARG (2.27; .0003)
Abbreviations: ECM, extracellular matrix; ENL, erythema nodosum leprosum; KEGG, Kyoto Encyclopedia of Genes and Genomes; NOD, nucleotide-binding oligomerization domain; PPAR, peroxisome proliferator-activated receptor. aDownregulated transcripts with negative fold changes are in italics.
at Karolinska Institutet on January 20, 2015
http://jid.oxfordjournals.org/
Table 6. Differentially Expressed Transcripts Unique to RR
Transcript Fold Changea PValue
IFI27 3.04 <.0001
HBQ1 2.65 <.0001
TGM2 2.63 <.0001
HBE1 2.58 <.0001
GBP1 2.45 <.0001
RBPMS2 2.43 <.0001
SLC25A37 2.31 <.0001
C2 2.31 <.0001
LOC647307 2.22 <.0001
LOC654055 2.20 <.0001
SERPING1 2.17 <.0001
OSBP2 2.16 <.0001
LOC649143 2.15 <.0001
IFIT3 2.10 <.0001
BATF2 2.08 <.0001
LOC653778 2.08 <.0001
TRIM58 2.07 <.0001
RAP1GAP 2.05 .0001
CXCL10 2.02 <.0001
LOC400759 1.99 <.0001
EPB49 1.95 <.0001
DPYSL5 1.92 <.0001
TACSTD2 1.91 <.0001
GMPR 1.91 <.0001
LOC654103 1.89 <.0001
TMOD1 1.89 <.0001
SLC6A10P 1.89 <.0001
E2F2 1.88 <.0001
IFITM3 1.87 <.0001
XK 1.85 <.0001
GPR175 1.85 <.0001
GBP5 1.84 <.0001
TRIM16L 1.83 <.0001
IL27 1.82 <.0001
FER1L3 1.81 .0001
PF4V1 1.81 <.0001
WARS 1.81 <.0001
OR2W3 1.80 <.0001
HLA-DRB6 1.79 <.0001
KCNJ2 1.78 <.0001
SDSL 1.78 <.0001
MARCO 1.77 <.0001
BLVRB 1.77 <.0001
MYOF 1.77 .0002
VAMP5 1.76 <.0001
HBEGF 1.76 <.0001
LOC642469 1.76 <.0001
LOC652616 1.73 .0001
LOC100133583 1.72 .0003
SERPINA13 1.71 <.0001
CLEC7A 1.71 .0002
Table 6 continued.
Transcript Fold Changea PValue
LOC642567 1.70 .0003
LOC729708 1.70 <.0001
HS.544245 1.69 .0001
IFIT2 1.67 .0001
SLC6A8 1.67 <.0001
TYMP 1.65 .0002
LOC100133678 1.65 .0001
SLC6A12 1.65 .0001
PANX2 1.64 .0002
ODF3B 1.63 .0003
MT2A 1.63 .0002
LOC100131391 1.62 .0001
CDCA5 1.62 .0002
ALDH1A1 1.61 .0001
BCL2L1 1.61 <.0001
LGALS3BP 1.61 .0001
PSG3 1.60 .0001
TK1 1.59 .0002
MME 1.59 .0003
BATF3 1.59 <.0001
LOC100133875 1.59 .0001
LOC650557 1.59 <.0001
MAFF 1.58 .0003
SAMD4A 1.56 .0003
PLA2G4C 1.56 .0002
CDC45L 1.56 .0003
LOC388588 1.54 <.0001
HSPA7 1.53 .0001
TUBB2A 1.52 .0002
VPREB3 −1.98 <.0001
TCL1A −1.98 <.0001
OSBPL10 −1.97 <.0001
SNORD4A −1.96 <.0001
ZNF256 −1.87 <.0001
ZNF101 −1.87 <.0001
ACACB −1.77 <.0001
CD19 −1.76 <.0001
SEL1L3 −1.74 <.0001
CCR7 −1.73 <.0001
FCGBP −1.71 <.0001
MGC3020 −1.71 <.0001
IRX3 −1.71 <.0001
LOC791120 −1.70 <.0001
FAIM3 −1.69 <.0001
EOMES −1.68 <.0001
LOC649841 −1.67 <.0001
FAM84B −1.67 .0001
SNORD104 −1.65 .0001
LEF1 −1.65 .0001
CXCR5 −1.65 <.0001
BLR1 −1.64 <.0001
at Karolinska Institutet on January 20, 2015
http://jid.oxfordjournals.org/
transcripts which could be potential biomarkers for RR or ENL, including CCL2, CCL3, and SOD2. Transcripts increased in PBMCs from both RR and ENL also included FcγR1 (CD64), FPR1 and FPR2, and triggering receptor on myeloid cells 1 (TREM1) and the related molecule triggering receptor ex-pressed on myeloid cells-like 1 (TREML1). FcγR1 recognizes immunoglobulin G; FPR1 and FPR2 recognize formylated pep-tides produced by bacteria and some mycobacteria [23].
Increased Monocyte-related Transcripts During RR and ENL Changes in transcripts could reflect either a change in gene ex-pression within PBMCs or a change in circulating cellular Table 6 continued.
Transcript Fold Changea PValue
CD79A −1.64 <.0001
LOC283663 −1.63 <.0001
CACNA1I −1.63 <.0001
STRBP −1.62 .0002
SNHG7 −1.62 <.0001
MAL −1.61 <.0001
LOC651751 −1.61 <.0001
C21ORF2 −1.61 <.0001
CRYBB2 −1.60 .0001
LOC100132499 −1.60 <.0001
CD27 −1.60 <.0001
LRRN3 −1.60 <.0001
CMTM8 −1.60 <.0001
HLA-DRB1 −1.60 <.0001
KLHL3 −1.59 .0001
CYORF15A −1.59 <.0001
CDR2 −1.59 .0001
CD79B −1.59 <.0001
MC1R −1.57 .0001
LAMA5 −1.57 .0001
KLRF1 −1.57 .0001
LOC653316 −1.56 .0001
LOC90925 −1.56 <.0001
PLCH2 −1.55 .0001
KIAA0114 −1.55 <.0001
D4S234E −1.55 <.0001
CCDC102A −1.55 <.0001
HS.481464 −1.54 .0001
POU2AF1 −1.54 .0001
BLK −1.53 <.0001
C16ORF74 −1.53 <.0001
BEX2 −1.53 .0001
FCER2 −1.52 <.0001
HLA-DOB −1.50 .0001
CENTG2 −1.50 .0001
Abbreviation: RR, reversal reaction. aNegative fold changes are in italic type.
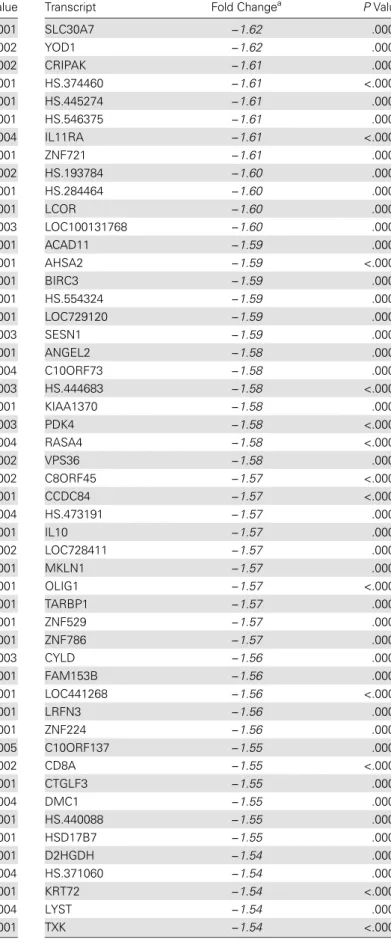
Table 7. Differentially Expressed Transcripts Unique to ENL
Transcript Fold Changea PValue
OLFM4 3.09 <.0001
LTF 2.82 <.0001
OLR1 2.82 <.0001
CXCL2 2.81 <.0001
MMP8 2.46 <.0001
DEFA1B 2.44 <.0001
FAM20A 2.39 <.0001
LCN2 2.39 <.0001
SAMD14 2.33 <.0001
CEACAM8 2.30 <.0001
THBS1 2.28 <.0001
PPARG 2.27 <.0001
CEACAM6 2.26 <.0001
PHACTR1 2.25 <.0001
CHST13 2.21 <.0001
CCR1 2.18 <.0001
DEFA3 2.17 <.0001
ACOX2 2.10 <.0001
ARG1 2.09 <.0001
HTRA1 2.08 <.0001
C19ORF59 2.07 <.0001
PTPN20 2.06 <.0001
RNU11 2.06 <.0001
RGL1 2.05 <.0001
PHLDA1 2.03 <.0001
HS.562219 2.02 <.0001
PVRL2 2.02 <.0001
HIST2H2AC 2.01 <.0001
RNASE2 2.00 <.0001
CCRL2 1.99 <.0001
CEACAM1 1.98 <.0001
SLC22A18AS 1.98 <.0001
COL17A1 1.96 <.0001
TNFAIP6 1.96 <.0001
ZDHHC19 1.96 <.0001
SPRY2 1.95 <.0001
RNASE3 1.94 <.0001
BPI 1.93 <.0001
METTL7B 1.93 <.0001
C5ORF32 1.92 <.0001
DDIT3 1.92 <.0001
ELANE 1.92 <.0001
CYP1B1 1.89 <.0001
LDLR 1.89 <.0001
LOC649210 1.89 <.0001
PTAFR 1.89 .0001
RNASE1 1.89 <.0001
SOCS3 1.89 <.0001
PLP2 1.88 <.0001
TSPAN9 1.88 <.0001
CD300C 1.87 .0002
ASGR2 1.86 <.0001
at Karolinska Institutet on January 20, 2015
http://jid.oxfordjournals.org/
Table 7 continued.
Transcript Fold Changea PValue
GSN 1.86 <.0001
MAFB 1.86 <.0001
S100A12 1.86 <.0001
CETP 1.85 <.0001
HLA-C 1.85 <.0001
RNU4-1 1.85 <.0001
IL8 1.84 <.0001
JUN 1.84 <.0001
MGC29506 1.84 <.0001
SIGLEC9 1.84 .0002
AQP9 1.83 <.0001
C5AR1 1.83 <.0001
DOK3 1.83 .0001
LOC650263 1.83 <.0001
CEBPE 1.82 <.0001
GNA15 1.82 <.0001
LOC100133477 1.82 .0001
VWF 1.82 <.0001
DEFA1 1.81 <.0001
FBXL2 1.81 .0001
MIR1974 1.80 <.0001
RNU1-3 1.80 <.0001
RNU4-2 1.79 <.0001
SLC2A14 1.79 <.0001
C13ORF15 1.78 <.0001
LHFPL2 1.78 .0001
LOC100134331 1.78 <.0001
SERPINB8 1.78 .0001
ST14 1.78 <.0001
TMEM88 1.78 <.0001
HIST2H2BE 1.77 <.0001
BASP1 1.76 <.0001
FLVCR2 1.76 .0001
PPP1R15A 1.76 <.0001
TLE3 1.76 .0001
FAM129B 1.75 .0005
RGL4 1.75 <.0001
KIFC3 1.74 <.0001
LOC653061 1.74 <.0001
NAB2 1.74 <.0001
NRIP3 1.74 <.0001
ABCA1 1.73 <.0001
IGFBP2 1.73 <.0001
LOC441481 1.73 .0001
ABLIM3 1.72 <.0001
CCL3L3 1.72 <.0001
CCL4L2 1.72 <.0001
LOC728744 1.72 .0001
PLIN2 1.72 <.0001
CTDSPL 1.71 <.0001
MIR302C 1.71 .0004
Table 7 continued.
Transcript Fold Changea PValue
NOP10 1.71 .0005
PFKFB3 1.71 <.0001
HIST2H2AB 1.70 <.0001
SLC24A3 1.70 <.0001
STAB1 1.70 .0002
BEX1 1.69 .0001
HLX 1.69 <.0001
IRAK2 1.69 .0001
LIMK2 1.69 .0001
MIR223 1.69 .0001
RNU1-5 1.69 <.0001
SLC25A24 1.69 .0003
TNFRSF1A 1.69 .0005
FCAR 1.68 .0003
FOS 1.68 <.0001
HSPA1B 1.68 .0001
WIPI1 1.68 <.0001
ASPH 1.67 .0005
PPIF 1.67 .0005
RNU4ATAC 1.67 <.0001
SPHK1 1.67 .0004
TP53I3 1.67 .0004
ACSL1 1.66 <.0001
C3AR1 1.66 <.0001
ECM1 1.66 .0003
FAH 1.66 .0002
GAS6 1.66 .0001
HS.559602 1.66 .0002
IER3 1.66 <.0001
IGJ 1.66 <.0001
STEAP4 1.66 <.0001
CEACAM4 1.65 <.0001
H2AFJ 1.65 <.0001
LOC647506 1.65 <.0001
LOC650261 1.65 .0006
PSG9 1.65 <.0001
UBAP1 1.64 .0001
DCUN1D3 1.63 <.0001
LOC729040 1.63 .0004
PLSCR1 1.63 .0005
PPBP 1.63 <.0001
BST1 1.62 .0004
LOC728835 1.62 <.0001
RNU1G2 1.62 <.0001
SBNO2 1.62 .0004
SELP 1.62 <.0001
SGK1 1.62 <.0001
SLC2A5 1.62 <.0001
CD24 1.61 <.0001
DSE 1.61 <.0001
HIST1H1C 1.61 <.0001
at Karolinska Institutet on January 20, 2015
http://jid.oxfordjournals.org/
Table 7 continued.
Transcript Fold Changea PValue
LOC440731 1.61 .0003
ESAM 1.60 <.0001
PDLIM7 1.60 .0005
CD63 1.59 .0002
CDA 1.59 <.0001
GNG10 1.59 .0005
GPER 1.59 .0001
HIST1H3H 1.59 .0001
IGFBPL1 1.59 .0004
LOC100134728 1.59 <.0001
TRIB1 1.59 <.0001
AZU1 1.58 <.0001
H1F0 1.58 .0005
HS.521338 1.58 .0006
METRNL 1.58 <.0001
TNNT1 1.58 <.0001
ITGB5 1.57 .0001
RNU5A 1.57 .0001
UBTD1 1.57 .0005
40425 1.56 <.0001
JAM3 1.56 <.0001
SH3BGRL2 1.56 <.0001
SLC6A6 1.56 .0006
HIST2H3C 1.54 .0002
LOC100134379 1.54 <.0001
LOC649923 1.54 <.0001
NR1I2 1.54 .0005
TREML2 1.54 .0006
FLJ22662 1.53 .0002
GP9 1.53 <.0001
HOMER2 1.53 .0002
HS.557039 1.53 <.0001
IGLL1 1.53 <.0001
LOC554223 1.53 .0001
LOC647450 1.53 <.0001
NACC2 1.53 .0003
RAB13 1.53 .0001
SGK 1.53 <.0001
C5ORF62 1.52 .0003
HIST1H3F 1.52 .0001
HS.276854 1.52 .0002
LOC653506 1.52 .0001
ADORA2A 1.51 .0006
F13A1 1.51 .0001
LOC652493 1.50 <.0001
MPL 1.50 .0003
NFKBIE 1.50 .0003
FCER1A −2.72 <.0001
ERAP2 −2.48 <.0001
HDC −2.26 <.0001
HLA-DRB5 −2.22 <.0001
Table 7 continued.
Transcript Fold Changea PValue
NKTR −2.16 <.0001
MCOLN2 −2.05 <.0001
IFI44L −2.01 <.0001
OGT −1.98 <.0001
SAMD9L −1.95 <.0001
FAM46C −1.94 <.0001
HS.560343 −1.93 <.0001
ATM −1.92 <.0001
C7ORF54 −1.91 <.0001
PNN −1.91 <.0001
MS4A2 −1.90 <.0001
ZBTB20 −1.90 <.0001
HS.193767 −1.85 <.0001
C14ORF106 −1.84 <.0001
CD96 −1.84 <.0001
SFRS18 −1.84 <.0001
MTX3 −1.83 <.0001
TMEM181 −1.83 <.0001
HS.553301 −1.82 <.0001
C6ORF111 −1.81 <.0001
GVIN1 −1.80 <.0001
HS.22689 −1.80 <.0001
HS.556018 −1.80 <.0001
PHIP −1.80 <.0001
CCNJ −1.79 <.0001
TMX3 −1.79 <.0001
USPL1 −1.78 <.0001
CTLA4 −1.77 .0004
HS.356079 −1.77 <.0001
MYBL1 −1.77 <.0001
CEP350 −1.76 <.0001
FAM190B −1.76 <.0001
KIAA0528 −1.76 <.0001
LOC642333 −1.76 .0001
MGEA5 −1.76 <.0001
PTAR1 −1.76 <.0001
TTC3 −1.76 <.0001
ZNF518A −1.76 <.0001
C15ORF28 −1.75 <.0001
C6ORF190 −1.75 .0002
CROP −1.75 <.0001
TC2N −1.75 <.0001
C10ORF6 −1.74 <.0001
HS.481659 −1.74 <.0001
TTC14 −1.74 <.0001
TTC37 −1.74 <.0001
KNTC1 −1.73 .0002
ANKRD12 −1.72 <.0001
LOC100132247 −1.72 <.0001
ZFC3H1 −1.72 <.0001
DMTF1 −1.71 <.0001
at Karolinska Institutet on January 20, 2015
http://jid.oxfordjournals.org/
Table 7 continued.
Transcript Fold Changea PValue
HS.143018 −1.70 <.0001
MTM1 −1.70 .0002
PSME4 −1.70 .0002
RASGRP3 −1.70 <.0001
SAMD9 −1.70 <.0001
KIAA0907 −1.69 <.0001
PDS5A −1.69 .0004
CD6 −1.68 .0001
HEMGN −1.68 .0002
HS.202577 −1.68 <.0001
LOC729645 −1.68 <.0001
SAMD3 −1.68 .0003
ZNF33B −1.68 <.0001
EML4 −1.67 <.0001
HS.549989 −1.67 <.0001
HS.570988 −1.67 <.0001
LOC729978 −1.67 <.0001
OPTN −1.67 .0003
RBM33 −1.67 <.0001
ZNF512 −1.67 .0004
KIAA1128 −1.66 .0003
LOC613037 −1.66 .0001
RAX2 −1.66 .0003
SLC38A1 −1.66 .0004
CEP135 −1.65 .0002
HS.154336 −1.65 .0002
HS.535028 −1.65 <.0001
HS.571887 −1.65 .0004
PTGDR −1.65 <.0001
SLTM −1.65 .0002
STAT4 −1.65 .0001
TGFBR3 −1.65 .0001
LOC100134241 −1.64 <.0001
LOC23117 −1.64 <.0001
MIR142 −1.64 <.0001
RASGRP1 −1.64 .0003
TBC1D4 −1.64 .0001
CCDC66 −1.63 <.0001
CCR3 −1.63 <.0001
FLJ44342 −1.63 .0001
KIAA1641 −1.63 .0005
RBM25 −1.63 .0002
ZRANB2 −1.63 <.0001
ANAPC4 −1.62 .0004
CCDC14 −1.62 .0001
DKFZP586I1420 −1.62 <.0001
DPYSL4 −1.62 <.0001
FAM111A −1.62 .0004
HS.574671 −1.62 <.0001
MBNL1 −1.62 .0004
PFAAP5 −1.62 .0001
Table 7 continued.
Transcript Fold Changea PValue
SLC30A7 −1.62 .0002
YOD1 −1.62 .0002
CRIPAK −1.61 .0003
HS.374460 −1.61 <.0001
HS.445274 −1.61 .0001
HS.546375 −1.61 .0003
IL11RA −1.61 <.0001
ZNF721 −1.61 .0003
HS.193784 −1.60 .0002
HS.284464 −1.60 .0004
LCOR −1.60 .0004
LOC100131768 −1.60 .0001
ACAD11 −1.59 .0001
AHSA2 −1.59 <.0001
BIRC3 −1.59 .0002
HS.554324 −1.59 .0002
LOC729120 −1.59 .0002
SESN1 −1.59 .0001
ANGEL2 −1.58 .0001
C10ORF73 −1.58 .0004
HS.444683 −1.58 <.0001
KIAA1370 −1.58 .0003
PDK4 −1.58 <.0001
RASA4 −1.58 <.0001
VPS36 −1.58 .0001
C8ORF45 −1.57 <.0001
CCDC84 −1.57 <.0001
HS.473191 −1.57 .0002
IL10 −1.57 .0001
LOC728411 −1.57 .0002
MKLN1 −1.57 .0003
OLIG1 −1.57 <.0001
TARBP1 −1.57 .0005
ZNF529 −1.57 .0002
ZNF786 −1.57 .0002
CYLD −1.56 .0003
FAM153B −1.56 .0004
LOC441268 −1.56 <.0001
LRFN3 −1.56 .0001
ZNF224 −1.56 .0002
C10ORF137 −1.55 .0002
CD8A −1.55 <.0001
CTGLF3 −1.55 .0002
DMC1 −1.55 .0002
HS.440088 −1.55 .0004
HSD17B7 −1.55 .0005
D2HGDH −1.54 .0004
HS.371060 −1.54 .0002
KRT72 −1.54 <.0001
LYST −1.54 .0003
TXK −1.54 <.0001
at Karolinska Institutet on January 20, 2015
http://jid.oxfordjournals.org/
composition. To assess whether monocytosis was a potential contributor to differential expression, we quantified the mono-cyte population in PBMCs by gating and staining for CD14 (Supplementary Figure 1A) in patients with leprosy with RR (n = 7), ENL (n = 8), or leprosy without reaction (n = 16). Monocytes comprised 13.79%, 19.01%, or 15.77% of PBMCs in RR, ENL, or no reaction, respectively (P= .45) ( Supplemen-tary Figure 1B). Furthermore, the majority of gated monocytes were CD14+in all groups (mean, 92.78%, 87.76%, or 92.28% in RR, ENL, or no reaction, respectively;P= .54) (Supplementary Figure 1C). Side scatter/forward scatter and CD14+measures of monocytes do not confirm a significant difference in the pro-portion of circulating monocytes between reaction and nonre-action PBMCs.
Confirmation of Differential Gene Expression: Complement Components
Given the current theory of augmented Th1 response to antigen as the etiology of RR,findings of innate immune response as a top GO pathway and complement and coagulation cascade as a top KEGG pathway were interesting and suggestive of potential overlap in immunologic response during RR and ENL. The blue-pink o’gram representation of the array heat map for the complement pathway components of the array is shown in Supplementary Figure 2. Several components of the classic Table 7 continued.
Transcript Fold Changea PValue
C2ORF69 −1.53 .0002
LOC202781 −1.53 .0002
RAB12 −1.53 <.0001
ZNF91 −1.53 .0001
FLJ12078 −1.52 <.0001
LOC100133950 −1.52 .0001
LOC440353 −1.52 .0005
LOC727908 −1.52 .0003
TBL1XR1 −1.52 .0004
BTAF1 −1.51 <.0001
C2ORF89 −1.51 .0005
CCDC45 −1.51 .0003
DTWD2 −1.51 .0003
LOC644297 −1.51 .0004
RPS23 −1.51 <.0001
SMCR5 −1.51 .0004
ZNF700 −1.51 .0002
INO80D −1.50 .0003
KIAA1333 −1.50 .0002
LOC645452 −1.50 .0002
PARP15 −1.50 .0005
Abbreviation: ENL, erythema nodosum leprosum. aNegative fold changes are in italic type.
Table 8. Differentially Expressed Transcripts in Both RR and ENL Groups
Transcript
RR ENL
Fold Changea PValue Fold Changea PValue
ADM 1.86 .0001 2.15 <.0001
ADORA2B 1.90 <.0001 2.09 <.0001 AHSP 2.74 <.0001 −2.52 <.0001 ALAS2 2.51 <.0001 −2.67 <.0001 ALPL 2.53 <.0001 3.65 <.0001 ANKRD22 3.15 <.0001 1.75 <.0001 ANPEP 1.82 <.0001 2.14 <.0001 ANXA3 1.97 <.0001 2.68 <.0001
AQP10 1.83 .0001 1.54 <.0001
AXIN2 −1.81 <.0001 −1.85 <.0001 BCL11B −1.58 .0002 −1.71 .0001
BPGM 1.53 .0002 −1.69 .0004
C15ORF48 2.60 <.0001 2.38 <.0001
C1QA 1.64 .0004 1.82 <.0001
C1QB 2.21 <.0001 3.27 <.0001 C1QC 1.77 <.0001 2.61 <.0001 C9ORF45 −1.76 <.0001 −1.63 <.0001 CA1 2.22 <.0001 −3.30 <.0001 CA4 2.26 <.0001 1.91 <.0001 CAMP 1.67 <.0001 2.16 <.0001 CCL2 2.90 <.0001 2.70 <.0001
CCL3 1.67 .0002 2.00 <.0001
CCL3L1 1.61 .0001 2.00 <.0001 CCL7 3.03 <.0001 3.40 <.0001 CEACAM3 1.74 <.0001 2.12 <.0001 CLEC5A 2.12 .0001 1.90 <.0001 CMTM2 1.73 <.0001 1.93 <.0001
CMTM5 1.59 .0001 1.97 <.0001
CNTNAP2 −2.03 <.0001 −1.78 <.0001
CTSL1 2.11 <.0001 1.85 .0002
CXCL1 1.64 .0001 2.63 <.0001
CXCR1 1.61 <.0001 1.67 <.0001 DEFA4 1.68 <.0001 2.60 <.0001
DHRS9 2.34 <.0001 1.83 .0002
DYSF 2.18 <.0001 1.86 <.0001
EDN1 1.62 .0001 1.71 .0003
EGR2 1.76 <.0001 1.58 <.0001
EMP1 1.92 .0002 1.82 <.0001
EPB42 2.20 <.0001 −2.85 <.0001 FCGR1A 2.78 <.0001 2.55 <.0001 FCGR1B 2.59 <.0001 2.38 <.0001 FCGR1C 2.87 <.0001 2.49 <.0001 FCGR3B 2.12 <.0001 1.61 .0002 FCRL3 −1.86 <.0001 −1.71 <.0001 FCRLA −2.32 <.0001 −1.65 <.0001 FFAR2 2.45 <.0001 2.02 <.0001
FOSB 1.68 .0001 1.96 <.0001
FOSL1 1.79 <.0001 1.86 <.0001
FPR1 1.80 .0001 2.10 <.0001
FPR2 2.28 <.0001 2.15 <.0001
at Karolinska Institutet on January 20, 2015
http://jid.oxfordjournals.org/
complement pathway had increased expression in PBMCs from persons with RR or ENL (Table9). C1qA, B, and C, comple-ment component 2 (C2); and C1 esterase inhibitor (SERPING1) were increased in RR. C1qA, B, and C and the complement re-ceptors C3AR1 and C5AR1 were increased in ENL. Changes in C1QB, C2, C1 esterase inhibitor, and C5AR1 expression in PBMCs were validated with qPCR (Table9).
The skin is a primary site of RR and ENL signs and symp-toms, so we hypothesized that increased expression of C1q in Table 8 continued.
Transcript
RR ENL
Fold Changea PValue Fold Changea PValue
G0S2 1.86 <.0001 1.60 <.0001
GADD45G 1.63 .0001 1.58 .0006
GAPDHL6 2.01 <.0001 1.51 <.0001 GK 2.05 <.0001 2.00 <.0001 GOLGA8B −1.52 <.0001 −2.13 <.0001
GPR109A 2.11 <.0001 2.93 <.0001 GPR109B 1.74 .0001 2.24 <.0001
GPR84 1.82 .0001 2.47 <.0001
GPR97 1.85 <.0001 1.90 <.0001 GYPB 2.25 <.0001 −2.45 <.0001
GYPE 1.62 .0001 −1.51 .0003
GZMK −1.83 <.0001 −1.52 <.0001
HAMP 1.74 .0003 1.89 .0004
HBD 2.53 <.0001 −2.48 <.0001
HBG1 1.76 <.0001 −2.14 <.0001
HBG2 1.67 <.0001 −2.06 <.0001
HBM 2.84 <.0001 −2.85 <.0001
HIST2H2AA3 1.77 <.0001 1.98 <.0001 HIST2H2AA4 1.72 <.0001 2.09 <.0001 HLA-A29.1 16.26 <.0001 −3.05 <.0001
HLA-DQA1 1.61 .0001 1.50 .0003
HP 1.58 .0001 2.55 <.0001
HS.572649 −1.71 <.0001 −1.62 <.0001
IFIT1L 1.92 <.0001 −3.03 <.0001
IL1R2 2.12 <.0001 2.53 <.0001 IL1RN 1.87 <.0001 1.97 <.0001
IL8RB 1.69 <.0001 1.51 .0004
ITGA2B 2.04 <.0001 2.36 <.0001
ITGB3 1.63 .0001 2.12 <.0001
KRT1 2.32 <.0001 −2.18 <.0001
LOC100131164 2.43 <.0001 −2.05 <.0001
LOC100133923 −1.55 <.0001 −1.90 <.0001
LOC100190986 −1.52 .0001 −2.01 <.0001
LOC389599 1.79 <.0001 −1.72 .0001
LOC440313 2.09 <.0001 −1.62 .0001
LOC642103 1.57 .0002 1.58 .0001
LOC643332 1.68 .0002 1.90 <.0001 LOC651309 −1.65 <.0001 −1.56 <.0001
LOC651524 2.04 <.0001 2.47 <.0001 LOC653600 1.61 <.0001 3.17 <.0001 LOC653610 2.12 <.0001 2.21 <.0001 LOC728499 −1.66 <.0001 −2.43 <.0001
LOC728715 1.55 .0002 1.71 .0001
LOC731682 1.93 <.0001 1.78 <.0001
LRG1 1.54 .0001 2.39 <.0001
LY6G6F 1.66 .0001 1.74 <.0001
MAP1A 1.59 .0002 1.83 <.0001
MIAT −1.60 <.0001 −2.30 <.0001
MMP9 2.39 <.0001 1.97 <.0001 MYL4 1.52 .0001 −1.74 <.0001
MYL9 2.14 <.0001 2.60 <.0001
Table 8 continued.
Transcript
RR ENL
Fold Changea PValue Fold Changea PValue
NAMPT 1.87 <.0001 1.68 <.0001 NFKBID 1.66 .0001 1.70 <.0001
NP 1.80 .0001 1.77 <.0001
ORM1 1.91 .0001 1.95 <.0001
PGLYRP1 1.92 <.0001 3.29 <.0001 PI3 2.30 <.0001 2.41 <.0001 PLAU 2.52 <.0001 2.45 <.0001
PLAUR 1.84 .0002 1.71 <.0001
PROK2 1.98 <.0001 1.98 <.0001
PROS1 1.50 .0003 1.57 <.0001
PVALB 1.91 <.0001 2.46 <.0001 RAB20 1.90 <.0001 1.93 <.0001 RETN 1.72 <.0001 2.97 <.0001 S100P 1.90 <.0001 2.59 <.0001
SDC4 1.58 .0002 1.88 .0001
SELENBP1 1.97 <.0001 −2.19 <.0001
SERPINB2 1.96 .0003 4.82 <.0001 SERTAD1 1.68 .0001 1.68 <.0001
SIGLEC16 1.58 .0003 1.64 .0002
SLC4A1 2.39 <.0001 −2.62 <.0001
SLPI 2.04 <.0001 3.72 <.0001 SNCA 2.06 <.0001 −1.54 .0003
SOD2 1.79 .0001 1.82 <.0001
STMN3 −1.63 <.0001 −1.51 .0003
STRADB 1.62 .0001 −1.92 <.0001
SV2A 1.68 .0001 1.65 .0005
TCN2 2.05 <.0001 1.86 <.0001
TGM3 1.92 <.0001 1.64 .0005
THBD 1.78 .0001 2.83 <.0001
TMEM158 1.57 .0001 2.63 <.0001 TNFRSF12A 1.94 <.0001 1.94 <.0001
TNNI2 1.53 .0001 1.72 .0002
TNS1 1.61 <.0001 −1.60 .0001
TP53INP2 1.70 .0001 1.76 <.0001
TREM1 1.78 .0002 1.88 <.0001
TREML1 1.64 .0001 2.40 <.0001 WDR40A 1.76 <.0001 −1.76 <.0001
Abbreviations: ENL, erythema nodosum leprosum; RR, reversal reaction. aNegative fold changes are in italic type.
at Karolinska Institutet on January 20, 2015
http://jid.oxfordjournals.org/
PBMCs during RR or ENL could reflect increased deposition of C1q in skin. Skin biopsy specimens from patients with leprosy obtained as part of diagnostic workup for RR (n = 3), ENL (n = 3), and borderline leprosy without reaction (n = 7 BT and n = 3 BL/LL) were studied with immunohistochemistry. The fluorescent intensity of C1q staining was significantly higher in both RR and ENL compared with nonreaction leprosy (P≤.01) (Figure2), indicating increased deposition of C1q in reactional compared with nonreactional leprosy skin lesions.
DISCUSSION
Analysis of RR and ENL transcriptomes demonstrates distinct pathways associated with the immune response. No validated biomarker or effective prophylaxis is currently available for RR and ENL [7,8,12,24–26], and gene expression studies are a crucial exploratory method to better understand reaction pathogenesis. Somefindings support previously published re-sults on leprosy immunology. Of particular interest was the in-creased expression of CXCL10 in the RR group, and its identification as a potential RR biomarker by IPA biomarkers analysis, as CXCL10 has previously been proposed as a bio-marker for RR [12]. The nucleotide-binding oligomerization domain (NOD)-like receptor signaling pathway (KEGG) was associated with ENL, an interestingfinding given the associa-tion of NOD2 with leprosy in a genome wide associaassocia-tion study [27]. IFN-γwas identified as an upstream regulator of dif-ferential transcription in PBMCs of RR and ENL, which may be a stimulus for immune cascade of reactions.
Pathway analysis showed a significant involvement of the in-nate immune system with RR and ENL. HAMP and CAMP antimicrobial peptide transcripts were increased in RR and ENL. CAMP expression is increased by a Toll-like receptor 1/ 2–mediated process, and Toll-like receptor 2 polymorphisms have been associated with increased risk of RR [28]. The com-plement and coagulation pathway was an unexpected pathway tofind enriched in the RR group, given the Th1 augmentation theory of RR pathology, but our results support a potential role in RR pathogenesis. We demonstrated increased deposition of C1q in skin lesions of patients with leprosy with RR or ENL, suggesting that complement is involved in both reaction types systemically and in skin lesions. Interestingly, we did notfind a significantly different level of C1q deposition in tuberculoid and lepromatous leprosy lesions, despite the different bacterial burden and immune cell composition in the 2 leprosy poles. That BT and BL/LL controls without immune reaction have similar degree of C1q deposition in tissues supports association of complement deposition with reactions rather than leprosy per se. The increased complement deposition during reactions, compared with baseline pathology due to leprosy, suggests that complement deposition is part of the immune response in RR and ENL.
The frequent association of reactions with recent initiation of anti–M. lepraetherapy parallels the pathologic immune activa-tion that can occur when treatment is started for other infec-tious diseases, such as human immunodeficiency virus and
Mycobacterium tuberculosisinfection. Patients with tuberculo-sis who go on to develop immune reconstitution inflammatory Table 9. Selected Complement Components and Monocyte Receptor Transcript Expression in RR and ENL, as Measured With Microarray and qPCR Validation of a Subset of Transcripts
Complement Components and Monocyte Receptors
RR ENL
Fold Increase in Array (PValue)
Fold Increase in qPCR (PValue)
Fold Increase in Array (PValue)
Fold Increase in qPCR (PValue)
Complement pathway component
C1Q (subunit A) 1.64 (.0004) NA 1.82 (<.0001) NA
C1Q (subunit B) 2.21 (<.0001) 1.72 (.005) 3.27 (<.0001) 2.63 (.07) C1Q (subunit C) 1.77 (<.0001) NA 2.61 (<.0001) 3.45 (.03)
C2 2.31 (<.0001) 1.94 (.01) Not significant NA
C1 esterase inhibitor 2.17 (<.0001) 2.18 (.001) Not significant NA
C5AR1 Not significant NA 1.83 (<.0001) 1.60 (.005)
Monocyte receptor
FcγRI (CD64) 2.78 (<.0001) 2.22 (.0002) 2.55 (<.0001) 2.39 (.005)
FPR-1 1.80 (.0001) 1.81 (.0002) 2.10 (<.0001) 1.84 (.006)
FPR-2 2.3 (<.0001) 2.05 (<.0001) 2.15 (<.0001) 1.87 (.01)
MARCO 1.77 (<.0001) 1.91 (.001) Not significant NA
CLEC7A or dectin-1 1.71 (.0002) 1.67 (.004) Not significant NA
Abbreviations: CLEC7A, C-type lectin domain family 7, member A; ENL, erythema nodosum leprosum; FcγRI, Fc fragment of IgG receptor-1; FPR, percentage false-positive; MARCO, macrophage receptor with collagenous structure; NA, not available; qPCR, quantitative polymerase chain reaction; RR, reversal reaction.
at Karolinska Institutet on January 20, 2015
http://jid.oxfordjournals.org/
syndrome (IRIS) have increased C1q expression at initiation and after 2 weeks of antiretroviral treatment [29,30]. Patients with tuberculosis and IRIS have increased C1 inhibitor at base-line without further increase in C1 inhibitor 2 weeks after start-ing antiretroviral therapy, as was seen in controls. Tran et al [30] hypothesized that mycobacterial antigen load may drive the complement activation they observed during tuberculosis with IRIS. PBMCs from patients with leprosy with a history of RR have, in response to stimulation withM. lepraeantigen, an in-creased expression of genes associated with monocyte recruitment and the innate immune response [8].“Antigen processing and presentation”KEGG pathways were associated with RR and ENL in this microarray analysis, which supports contribution of antigen to RR and ENL pathogenesis. HLA associations have been made with leprosy [31,32], although the contribution
of HLA expression to antigen presentation and immune re-sponse during RR and ENL needs to be described. Ourfindings of transcriptional differences of HLA genes could inform future studies of HLA types and risk of immune reactions.
A major strength of this study is the description of PBMC gene expression from persons with active, untreated immune reactions compared with controls matched for age, sex, and clinical form of leprosy. Matching for stage of leprosy treatment in the array was a control for effects of antileprosy therapy and stage of leprosy disease on gene expression. Furthermore, samples were collected and processed before initiation of immu-nomodulatory therapies. We were also able to investigate corre-lation of gene expression differences of C1q in PBMCs to presence in skin during reactions. We minimized potential type 2 errors associated with large-scale array comparisons by Figure 2. Intensity offluorescent staining for C1q (A) with representative photographs (B) in skin lesions of reversal reaction (RR; n = 3), erythema no-dosum leprosum (ENL; n = 3), borderline tuberculoid (BT) controls (n = 7), and borderline lepromatous (BL)/ lepromatous leprosy (LL) (n = 3) controls. Differ-ences in groups were determined with analysis of variance and Tukey multiple-comparison test. *P≤.05;†P≤.01;‡P≤.001. Error bars denote standard error of the mean.
at Karolinska Institutet on January 20, 2015
http://jid.oxfordjournals.org/
applying stringent criteria (FPR,≤0.05;P≤.05; fold change ≥1.5 or≤−1.5) for transcripts used for functional and biologic
pathway analyses. Study limitations include analysis of gene ex-pression in PBMCs rather than whole blood, because conclu-sions are relevant for the isolated monocyte and lymphocyte populations. The PBMC and biopsy specimens used were not from the same patients, which needs to be considered when as-sessing experimental conclusions.
We hypothesize that both RR and ENL may have disordered recognition responses toM. lepraeantigen with increased pro-duction of antibodies or heightened responsiveness to antibodies, with pathology mediated by complement and other components of innate immunity. Differences in the clinical presentation of RR and ENL may be related to several factors, includingM. leprae
burden and the balance between humoral and cell-mediated im-mune responses toM. lepraeand other antigens. Genetic factors have also been proposed as risk factors for immune reactions [28]. Further investigations of the involvement of innate immu-nity, including complement and antimicrobial peptides, and IFN-γ–mediated processes are indicated to fully elucidate the pathophysiology of leprosy immune reactions.
Supplementary Data
Supplementary materialsare available atThe Journal of Infectious Diseases
online (http://jid.oxfordjournals.org). Supplementary materials consist of data provided by the author that are published to benefit the reader. The posted materials are not copyedited. The contents of all supplementary data are the sole responsibility of the authors. Questions or messages regard-ing errors should be addressed to the author.
Notes
Acknowledgments. We acknowledge the patient volunteers and care teams at Giselda Trigueiro Hospital, Onofre Lopes Hospital, and Mossoró Hansen’s disease clinics in Rio Grande do Norte, Brazil. We thank our col-leagues from the Immunogenetics laboratory at Universidade Federal do Rio Grande do Norte, the Centro de Patologia Getúlio Sales, and the Confocal Microscopy core facility at the Brain Institute in Natal, Rio Grande do Norte, Brazil, and the DNA and Bioinformatics core facilities at the University of Iowa in Iowa City for their collaboration.
Financial support. This work was supported by the National Institutes of Health (grants T32-AI007613 and R25-TW009337-02 to K. M. D.), Bur-roughs Wellcome Fund and the American Society of Tropical Medicine and Hygiene (Postdoctoral Fellowship in Tropical Infectious Diseases to K. M. D.), and the Brazil National Institute of Science and Technology (trop-ical diseases grant CNPq 573839/2008-15).
Potential conflicts of interest. The authors have no conflicts of interest to declare. The funding agencies had no role in the study design or execu-tion. All authors: No potential conflicts of interest.
All authors have submitted the ICMJE Form for Disclosure of Potential Conflicts of Interest. Conflicts that the editors consider relevant to the con-tent of the manuscript have been disclosed.
References
1. Global leprosy: update on the 2012 situation. Wkly Epidemiol Rec2013; 88:365–79.
2. Ridley DS, Jopling WH. Classification of leprosy according to immuni-ty: afive-group system. Int J Lepr Other Mycobact Dis1966; 34:255–73.
3. Britton WJ, Lockwood DN. Leprosy. Lancet2004; 363:1209–19. 4. Walker SL, Lockwood DN. Leprosy type 1 (reversal) reactions and their
management. Lepr Rev2008; 79:372–86.
5. Lockwood D, Colston M, Khanolkar-Young S. The detection of Myco-bacterium lepraeprotein and carbohydrate antigens in skin and nerve from leprosy patients with type 1 (reversal) reactions. Am J Trop Med Hyg2002; 66:409–15.
6. Ranque B, Nguyen VT, Vu HT, et al. Age is an important risk factor for onset and sequelae of reversal reactions in Vietnamese patients with lep-rosy. Clin Infect Dis2007; 44:33–40.
7. Lockwood DN, Suneetha L, Sagili KD, et al. Cytokine and protein mark-ers of leprosy reactions in skin and nerves: baseline results for the North Indian INFIR cohort. PLoS Negl Trop Dis2011; 5:e1327.
8. Orlova M, Cobat A, Huong NT, et al. Gene set signature of reversal reaction type I in leprosy patients. PLoS Genet 2013; 9: e1003624.
9. Kahawita IP, Lockwood DN. Towards understanding the pathology of erythema nodosum leprosum. Trans R Soc Trop Med Hyg2008; 102: 329–37.
10. Pocaterra L, Jain S, Reddy R, et al. Clinical course of erythema nodosum leprosum: an 11-year cohort study in Hyderabad, India. Am J Trop Med Hyg2006; 74:868–79.
11. Lustosa AA, Nogueira LT, Pedrosa JI, Teles JB, Campelo V. The impact of leprosy on health-related quality of life. Rev Soc Bras Med Trop2011; 44:621–6.
12. Scollard DM, Chaduvula MV, Martinez A, et al. Increased CXC ligand 10 levels and gene expression in type 1 leprosy reactions. Clin Vaccine Immunol2011; 18:947–53.
13. Sousa AL, Fava VM, Sampaio LH, et al. Genetic and immunological ev-idence implicates interleukin 6 as a susceptibility gene for leprosy type 2 reaction. J Infect Dis2012; 205:1417–24.
14. Bleharski JR, Li H, Meinken C, et al. Use of genetic profiling in leprosy to discriminate clinical forms of the disease. Science2003; 301:1527–30.
15. Teles RM, Graeber TG, Krutzik SR, et al. Type I interferon suppresses type II interferon-triggered human anti-mycobacterial responses. Sci-ence2013; 339:1448–53.
16. Ministério da Saúde. Define ações de controle da hanseníase. Vol. Por-taria Conjunta No. 125. 26 March 2009.http://bvsms.saude.gov.br/bvs/ saudelegis/svs/2009/poc0125_26_03_2009.html. Accessed 29 Novem-ber 2014.
17. WHO Expert Committee on Leprosy: Eighth report. In: World Health Organization, ed. WHO Technical Report Series. Geneva, Switzerland: World Health Organization,2012.
18. Breitling R, Armengaud P, Amtmann A, Herzyk P. Rank products: a simple, yet powerful, new method to detect differentially regulated genes in replicated microarray experiments. FEBS Lett2004; 573: 83–92.
19. Jeffery IB, Higgins DG, Culhane AC. Comparison and evaluation of methods for generating differentially expressed gene lists from microar-ray data. BMC Bioinformatics2006; 7:359.
20. Wang J, Duncan D, Shi Z, Zhang B. WEB-based GEne SeT AnaLysis Toolkit (WebGestalt): update 2013. Nucleic Acids Res2013; 41:W77–83.
21. Sollid LM, Jabri B. Celiac disease and transglutaminase 2: a model for posttranslational modification of antigens and HLA association in the pathogenesis of autoimmune disorders. Curr Opin Immunol2011; 23:732–8.
22. Kraal G, van der Laan LJ, Elomaa O, Tryggvason K. The macrophage receptor MARCO. Microbes Infect2000; 2:313–6.
23. Chun T, Serbina NV, Nolt D, et al. Induction of M3-restricted cytotoxic T lymphocyte responses by N-formylated peptides derived from Myco-bacterium tuberculosis. J Exp Med2001; 193:1213–20.
24. Balagon M, Saunderson PR, Gelber RH. Does clofazimine prevent ery-thema nodosum leprosum (ENL) in leprosy? a retrospective study, com-paring the experience of multibacillary patients receiving either 12 or 24 months WHO-MDT. Lepr Rev2011; 82:213–21.
at Karolinska Institutet on January 20, 2015
http://jid.oxfordjournals.org/