FUNDAÇÃO GETÚLIO VARGAS
ESCOLA DE ADMINISTRAÇÃO DE EMPRESAS DE SÃO PAULO
CHARLES DANIEL HELY MARIE LA CLAVIERE
ENTRY ON THE BRAZILIAN RENEWABLE POWER MARKET: A CASE STUDY
CHARLES DANIEL HELY MARIE LA CLAVIERE
ENTRY ON THE BRAZILIAN RENEWABLE POWER MARKET: A CASE STUDY
Tese apresentada à Escola de Administração de Empresas de São Paulo da Fundação Getulio Vargas, como requisito para obtenção do título de Mestre Profissional em Gestão Internacional (MPGI)
Campo de conhecimento: Finanças e Estratégia
Orientador: Prof. Dr. Mario Aquino Alves
LA CLAVIERE, Charles.
Entry on the Brazilian renewable power market: A case study / Charles LA CLAVIERE. - 2016.
83 f.
Orientador: Mario Alves
Dissertação (MPGI) - Escola de Administração de Empresas de São Paulo.
1. Energia renovável - Brasil. 2. Energia – Fontes alternativas. 3. Aquecimento global. 4. Política energética. I. Alves, Mario. II. Dissertação (MPGI) - Escola de Administração de Empresas de São Paulo. III. Título.
CHARLES LA CLAVIERE
ENTRY ON THE BRAZILIAN RENEWABLE POWER MARKET: A CASE STUDY
Thesis presented to Escola de Administração de Empresas de São Paulo of Fundação Getulio Vargas, as a requirement to obtain the title of Master in International Management (MPGI).
Knowledge Field: Strategy
Approval Date 27/01/2016
Committee members:
“Il faut cultiver notre jardin”
Acknowledgment
I would like to thank Professor Mario Aquino Alves from the FGV-EAESP. His kindness and patience were key assets in the preparation of this Master’s thesis.
I would like to thank Ms Joisa Campanher Dutra for her availability and advice.
ABSTRACT
International climate conferences as well as growing awareness over sustainability issues have shed light on the key role renewable energies would play in the energy transition. As opposed to fossil fuels, they can be regenerated on a short period of time and therefore are expected to be part of the solution to limit global warming. For decades, Brazil has had a strong hydroelectric sector, but it is now also a leader in all other alternative energy sources such as wind power, biomass or solar energy. These industries are promised a thriving future, thanks to the country’s natural potential as well as a supportive legislation, and are attracting many local and international players. This study aims to fill a void in literature analyzing the example of a foreign firm entering on the Brazilian renewable power market. Relying on literature as a conceptual background, a single case study has been conducted to outline all the aspects of the entry process. In this development, causal relationships between strategic orientations and the evolution of the business have been identified. This research brings a contribution to the academic discussions over entry dynamics in the renewable power industry through evidences from the Brazilian market.
RESUMO
Conferências internacionais sobre o clima, bem como crescente conscientização sobre as questões de sustentabilidade lançaram luz sobre o papel fundamental que as energias renováveis poderiam desempenhar na transição energética. Ao contrário de combustíveis fósseis, elas podem ser regeneradas em um curto período de tempo e, por conseguinte, espera-se que espera-sejam uma parte da solução para reduzir o aquecimento global. O Brasil espera-sempre teve um forte setor hidrelétrico, mas agora está na vanguarda em relação a todas as outras fontes de energias alternativas, como energia eólica, biomassa o energia solar. Estas indústrias são uma promessa para um futuro próspero, graças ao potencial natural do país, bem como uma legislação de apoio, e estão atraindo muitas empresas locais e internacionais. Este estudo tem como objetivo preencher uma lacuna na literatura analisando o exemplo de uma empresa estrangeira que entra no mercado da energia renovável no Brasil. Baseando-se na literatura como um fundo conceptual, um único estudo de caso têm sido realizados para delinear todos os aspectos do processo de entrada. Neste desenvolvimento, relações causais entre as orientações estratégicas e a evolução do negócio foram identificadas. Esta pesquisa traz uma contribuição para as discussões acadêmicas sobre as dinâmicas de entrada no setor de energia renovável através de evidências do mercado brasileiro.
TABLE OF FIGURES
Figure 1 Electricity value chain (Associação Brasileira de Distribuidores de Energia Eléctrica, 2015)
... 18
Figure 2 Installed capacity in Brazil from 1883 to 2014 in GW (Ministério de Minas e Energia, 2015) ... 25
Figure 3 Installed capacity evolution and distribution of the generating complex ... 26
Figure 4 Hydro plants ranking by capacity (Ministério de Minas e Energia, 2015 ... 27
Figure 5 Thermal plants ranking by capacity (Ministério de Minas e Energia, 2015 ... 28
Figure 6 Nuclear plants ranking by capacity (Ministério de Minas e Energia, 2015) ... 29
Figure 7 Wind farms ranking by capacity (Ministério de Minas e Energia, 2015) ... 29
Figure 8 Distribution of electric generation installed capacities between 2015 and 2024 (EPE, 2015)31 Figure 9 Electricity generation capacity increase by source between 2015 and 2024 in MW ... 32
Figure 10 Green competitiveness strategies chart (Orsato, 2006) ... 40
Figure 11 Methodological components table (author) ... 48
Figure 12 Market-entry matrix (Author) ... 50
Figure 13 Analytical tools grid (Author) ... 52
Figure 14 Sources table (Author) ... 54
Figure 15 Distribution of electricity generation capacity in Brazil in 2015 ... 57
Figure 16 Installed and expected capacity for electricity generation In Brazil ... 58
Figure 17 Tractebel Energia generating complex (corporate website, 2015) ... 59
Figure 18 Tractebel’s generating complex geographical distribution (corporate website, 2015) ... 60
Figure 19 Employee turnover in % between 2000 and 2010 ... 64
Figure 20 Tractebel Energia generation mix evolution from 1999 to 2015 ... 65
TABLE OF CONTENTS
1. INTRODUCTION ... 12
1.1 General introduction ... 12
1.2 Personal motivations ... 13
1.3 Research question ... 13
2 OBJECTIVE ... 14
3 LITERATURE BACKGROUND ... 15
3.1 Power market definition ... 16
3.1.1 General framework ... 16
3.1.1.1 From production to retail ... 16
3.1.1.2 Electricity market fundamentals ... 18
3.1.2 Power in Brazil... 21
3.1.2.1 Regulation model evolution ... 22
3.1.2.2 Electricity mix in Brazil ... 25
3.1.2.3 Energy policy ... 30
3.2 Renewable energies fundamentals ... 32
3.2.1 General aspects ... 32
3.2.2 Hydro power ... 32
3.2.3 Wind power ... 33
3.2.4 Biomass ... 33
3.2.5 Solar power ... 33
3.2.6 Others ... 34
3.3 Sustainability in Brazil ... 34
3.3.1 Greenhouse gases targets ... 34
3.3.2 International commitments ... 35
3.3.3 Green energies development capability ... 35
3.3.3.1 Natural potential ... 35
3.3.3.2 Renewable energy social support ... 36
3.4 Corporate growth strategies ... 36
3.4.1 Foundings of corporate growth ... 37
3.4.2 Corporate growth strategies ... 38
3.4.3 Sustainable initiatives to corporate growth ... 39
3.5 Business internationalization ... 40
3.5.2 Barriers to foreign entry strategies ... 42
3.5.2.1 Informal barriers ... 42
3.5.2.2 Formal barriers ... 43
3.5.3 Entry mode selection ... 44
4 METHODOLOGY ... 46
4.1 Introduction ... 46
4.2 Research methodology ... 47
4.3 Analytical framework ... 49
4.3.1 Framework definition ... 49
4.3.2 Results analysis ... 51
4.4 Case selection ... 52
4.5 Data collection and analysis ... 53
5. ANALYSIS ... 54
5.1 Company presentation... 54
5.1.1 General aspects ... 54
5.1.2 Business model and clients in Brazil ... 55
5.1.3 Direct competitors ... 56
5.1.4 Energy mix in 2015 ... 58
5.2 Entry strategy ... 60
5.2.1 Entry process ... 60
5.2.2 Strategical approach identification ... 61
5.2.3 Strategic impacts of the acquisition ... 62
5.2.3.1 Workforce ... 62
5.2.2.2 Production capacities ... 64
5.2.2.3 Operational synergies ... 66
5.2.2.4 Financial aspects ... 68
6. CONCLUSION ... 70
12
1. INTRODUCTION
1.1 General introduction
Since the discovery of Brazil, both economists and historians have been amazed by the numerous cycles that have shaped the Brazilian economy. First, timber (brazilwood) at the beginning of colonization, then precious metals in the 16th and 17th centuries, and eventually coffee during the 19th century. Each of them was considered in its time as a lasting source of prosperity, but all of them came to an end for diverse reasons ranging from international competition to demand scarcity.
In the past decade, a discreet sector has been experimenting a tremendous growth in Brazil: renewable energies. One figure may help to understand the scope of this silent economic success of green energies: between 2013 and 2014 solar power capacities experienced a 122.2% growth (Empresa de Pesquisa Energética, 2015). Analyst’s reports now consider Brazil as the new Eldorado for alternative energies and national and foreign companies are actively investing to position on this promising market, despite of the escalating economic crisis. There is no doubt that with over 7000km of coastline, 12% of the world surface water resources and favorable winds, the country can boast of huge renewable power potential. To top it all Brazil energy consumption is expected to rise by 71% by 2035 (BP Energy Outlook, 2014). All these factors (power consumption growth, a renewable-friendly natural environment and a supportive legislation) are coming together to create a potentially very profitable market As of today, the Brazilian power market is still dominated by federal and state utilities companies; still the privatization of the sector is gaining ground and a large part of the new investments are coming from private investors. Capacity expansion will take place on this market at an accelerated pace and foreign companies are expected to keep entering this market to provide both financing of new projects and technological knowledge. Many leading players in the renewable power have already set foot in Brazil and often have numerous projects in construction.
13 foreign company that has been active on this market for several years already, and also to assess the benefits derived from its Brazilian experience in order to draw insightful conclusions for both academic and professional purposes.
1.2 Personal motivations
Before entering the subject, I believe it is important to describe the motivations that have led me to pick this particular issue for my thesis. The decision to select a topic focused on renewables in Brazil has been influenced by at least three factors.
First of all, I have had a deep interest for sustainability questions and how some sectors can grow while reducing the human footprint on Earth. I believe renewables are one of the most impressive industry of our time since they are expected to help billions of men and women to live a modern life while dramatically reducing their fossil fuels use.
While writing this thesis, environmental issues were on top of the political agenda. Be it Pope Francis successful encyclical Laudato Si calling to more wise in our use of resources, or the crucial COP 21 conference in December 2015 which has set carbon reduction objectives that should shape our life and the life of our children. Therefore it was a very inspiring time frame to write this thesis.
Finally, I picked Brazil as the scope of this research first because it is clearly on of the most promising market for green energy with a huge untapped potential. It is also a country where I have lived for over a year and to which I keep a very deep and special relation.
1.3 Research question
My research question for this master thesis is: How do foreign companies enter the Brazilian renewable power generation market?
14
15 The main objective is to understand how foreign firms can penetrate the Brazilian market for renewable power generation, and this implies studying the strategic aspects of this market entry and assessing the consequences on the firm’s performance.
Some specific objectives shall be reached as steps towards the main objective.
- To give an understanding of the Brazilian power market in order to thoroughly grasp the challenges faced by the entering firm. National energy markets are complex realities with numerous players and strict regulations. Therefore, it is essential to give insights on this market regulation, size, stakeholders should ease comprehension of the firm’s situation in Brazil.
- To enlighten the key steps of this operation and their strategic aspects for the management. Giving an overview both the history of this entry in Brazil and a description of the key directions taken by the company in the country.
- Draw up a panorama of the company’s performance indicators in Brazil from several
perspectives (financial, operational…).
This research and its objective seem particularly relevant in the current context of renewable energy expansion in Brazil. For decision makers in the business world, it is always precious to benefit from the experience feedback from other companies. The Brazilian energy market has not reached maturity and many managers, especially from foreign firms, remain unsure on whether to invest in this country or not. This work should allow them to better understand the sector’s challenges and give them key elements for their decision making.
In an academic perspective, several parts of this topic have been explored such as market-entry strategies or green competitiveness. Nevertheless the study of renewable energy firms from a corporate strategy and market entry perspective is still quite new, and this is especially true in emerging markets such as Brazil where, though there are improvements, large voids remain to be filled in various areas of academic research.
16 3.1 Power market definition
3.1.1 General framework
3.1.1.1 From production to retail
To thoroughly understand this thesis, it is essential to give a detailed view of electricity as a product and as a market.
Electricity is a commodity, that is to say a good that can be bought or sold in order to satisfy a specific need. As opposed to other product or services, it has no qualitative differentiation across markets, which implies it is fungible: the essential properties of the product remain the same no matter who produces it (United Global Asset, 2015). Electricity is however a very specific type of commodity as it possesses several specific features. First of all, electricity has a global demand since every individual or economic agent across the world is likely to use electricity to a greater or lesser extent. Electricity storage is possible through options such as pumped-storage hydroelectricity or batteries, but remains costly and with very limited use. Electricity also needs to be accessible on demand as end-users will not wait to consume it. Therefore, to balance supply and demand, in most grid systems power plants need to respond to consumption spikes straight away. Finally, electricity is key to a country’s development, as energy access allows for a better satisfaction of basic human needs such as healthcare and education. In the world, 1.2 billion people still do not have access to electricity and nearly 3 million are without clean cooking and heating facilities (mainly wood and charcoal) as of 2015 (United Nations Foundations, 2015). Therefore it is highly understandable that electricity is “already well established in the framework of human rights” (Tully, 2006).
Electricity is produced through the generation of electric power from primary energy sources. These can be non-renewable sources (coal, natural gas, uranium) or renewable sources (wind, solar, hydro, tidal, biomass…), and this work will focus on the latter. On the scientific level, there are several fundamental methods to generate electrical energy, mostly using a turbine which drives an electric generator.
17 The first step corresponds to activity of generating electricity from primary energy sources. The process is carried out by various types of facilities (dams, nuclear power plants…) whose production cost highly depend on the energy source. Still, these technologies can be sorted into two groups: conventional electricity generation, which includes thermal (production through the chemical characteristics of a fuel), and hydro (production through the energy of stored water). Non-conventional such as solar PV or windfarms rely on the energy flow. On an economic level this sector is referred to as the electricity generation industry.
After being generated electricity is transferred from plants to high voltage substations through transmission lines. This network is referred as the power grid and corresponds to the electricity transmission industry. In many countries deregulation has led to the separation of the transmission and the distribution industries. The transmission step is all the more essential as most power plants are located far away (hundreds to thousands of kilometers) from end-users locations.
Electricity distribution industry is considered the final step for power to reach end-users. Distribution substations transform the voltage of electric current coming from transmission lines to match the utilization voltage of end-users (domestic appliances for homes).
18 Figure 1 Electricity value chain (Associação Brasileira de Distribuidores de Energia Eléctrica, 2015)
3.1.1.2 Electricity market fundamentals
As mentioned above, electricity is vital for most human activities, ranging from the economy to basic human needs such as heating or cooking. Therefore, governments tend to keep a close eye on this strategic sector through various methods. In the vast majority of countries, the electricity market is subject to tight public regulation, with some liberalization waves in the recent years. Though power industries remain country-specific and regulation may vary a lot from country to country, there are some general trends and patterns across the globe.
In economics, a market is a place where supply and demand operate to exchange items and where prices are set and communicated (Business Dictionary, 2015). This is the case for electricity, a commodity which end users are looking to buy from production capacities. Electricity markets have very specific features (complex storage, supply should match demand at all time…) that make them necessarily designed and regulated by authorities.
19 as generating firms are only involved on this one. Wholesale electricity markets have two timing horizons: short term (spot market) and long term (forward market).
Transmission and distribution usually fall into the category of natural monopolies. First of all, distribution implies very high initial investments to cover the whole territory with substations and transformers. Therefore, once these infrastructures are built, the marginal cost of every new customer to connect to the grid is very low and competition hard to achieve. Regarding transmission lines, it would also be an economic nonsense to try to create competition as it would mean replicating expensive high voltage transmission lines on the same route. Therefore, these two activities often have remained highly regulated. Nevertheless, their framework changed as generating activities were liberalized. In several countries, transmission and distribution now follow a new scheme called Performance Based Regulation (PBR) which replicates some competitive markets incentives (such as price caps on given costs) to these sectors to have them improve service while limiting expenses (Mandel, 2014).
True wholesale market only exists when the electricity sector has been at least partly deregulated (as it was the case for Brazil, cf infra.). Since electricity generation and retail have been considered for a long time a natural monopoly operated by large integrated utilities, for nearly a century there was no such thing as a competitive wholesale electricity market. Continued improvements in transmission technology across the 20th century and the
20 development of more efficient generating technologies” (Joskow, 2008). Deregulated generators were therefore expected to provide increased efficiency, improved service and reduced costs as they were to offer their production close to marginal cost to face competition (Posner, 2015). The history of liberalization of the electricity industry started in South America, with Chile in 1987 being the first country to launch the deregulation wave. Then followed just after England, Wales and several developed countries, including the US with the 1992 Energy Policy Act (Fares, 2014). The key idea of this movement was the dismantling of historic vertically integrated electricity companies in order to separate generating activities from transmission, distribution and retail sale. This marked the birth of large centralized wholesale electricity markets where generators sale their electricity to other parties. The general framework on these markets is that generation companies bid every day for the volume and price of electricity production they are willing to offer and a regulation agency is responsible for efficiently dispatching next day production across power plants through complex algorithms. This way only plants with the lowest marginal cost structure will be used to match the forecasted demand on the next day, thus optimizing resource allocation. In the end, this new institutional framework was expected to provide long term benefits to end users: they would pay a price closer to the efficient cost of their electricity supply and experience a better service thanks to competition. On a sector level, innovation was expected to be fostered and generating capacity expansion incentivized as private suppliers would compete on the market (Joskow, 2008).
21 failure. Though this state followed some the basic features of typical electricity market deregulation (unbundling of vertically integrated utilities, introduction of competition…), things did not go as planned and the reform turned into a nightmare for the end users. In 2000, California restructured the sector and rapidly experienced a major crisis: several black-outs, insufficient capacity and price spikes. Several causes can explain this failure, but the most significant were the poor market design by authorities which allowed high market power from players and the lack of incentives to build new capacities as demand was growing (Sweeney, 2002).
Most of the issues experienced on these markets are tightly linked to the incomplete reform of their national electricity markets. A complete electricity framework reshape should take into account all the recommendations of what Joskow (2008) called the “textbook model” : “privatization of state-owned enterprises, vertical and horizontal restructuring to facilitate competition […], PBR regulation applied to the regulated transmission and distribution segments, good wholesale market designs that facilitate efficient competition among existing generators, competitive entry of new generators, and retail competition, at least for industrial customers.”. In the different countries mentioned above, where energy crises took place in the 1990’s or early 2000’s, one or several of these elements were too often missing be it by insufficient political commitment or pressure from lobbies that benefit from an uncompetitive energy market.
It is important to mention this story of deregulation and the birth of a free wholesale market in the light of this thesis subject. Indeed, this political will to liberalize the electricity market has enabled the renewable energy players to expand and grow beyond their national borders.
22 3.1.2.1 Regulation model evolution
In 1879, Emperor Dom Pedro II granted Thomas Edison the privilege of introducing the use of electric technology in Brazil. The first electricity powered permanent public lightning was inaugurated in what is now Central do Brasil station in Rio de Janeiro. Historical records points Campos (state of Rio de Janeiro) as the first Brazilian city to have access to electricity services. In 1883, Campos 52 kW thermoelectric generation plant was inaugurated by Dom Pedro II (Ministério de Minas e Energia, 2015).
From then on, the electricity sector in Brazil experienced a steady development with some landmarks to this expansion such as the creation of Elétricas Brasileiras (Eletrobras) in 1962 (Centro da Memória da Eletricidade no Brasil, 2015).
Until the 1990’s, the Brazilian electric sector remained highly government-controlled with a traditional structure of vertically integrated utilities. Eletrobrás, at the federal level, and various state operators were in charge of generation, transmission and distribution of electricity countrywide (Vagliasindi & Besant-Jones, 2013). This system was in line with the traditional model of vertically integrated electric utilities that were prominent at that time.
23 Still, these reforms did not produce sufficient effect to boost investments. Power capacity could not keep pace with demand growth: between 1990 and 1999, capacity increased by 28% while demand rose by 45% (Larrea, 2006).
This situation, together with the dramatic droughts of 2001 and 2002, was the main cause of the apagão crisis where several shortages were experienced in Brazil. Right after the crisis, the Comite de Revitalização do Modelo do Setor Elétrico designed a set of propositions to improve the structure of the sector for the future (Larrea, 2006).
After these events, a new set of reforms was implemented from 2002 called the “new model”. Its main features were an emphasis on long term contracts to secure additional capacities, improvement of the regulatory framework and implementation energy auctions to fully cover electricity needs.
As of today the Brazilian market is regulated by several main institutions created by the first and second sets of reforms. The first wave of reforms (between 1995 and 1998) gave birth to four main entities.
- The Agência Nacional de Energia Elétrica (ANEEL – Lei N° 9427), which regulates all the electricity value chain (generation, transmission, distribution and commercialization. - The Conselho Nacional de Politica Energética (CNPE – Lei N° 9427), which is responsible for suggesting national energy policies
- The Operador Nacional do Sistema Elétrico (ONS – Lei N° 9648), which controls generation and transmission activities in their use of the power system
- The Mercado Atacadista de Energia Elétrica (MAE – Lei N° 9648), which organizes wholesale electricity trade.
The second wave of market reforms referred to as the new model gave rise to:
- The Empresa de Pesquisa Energética (EPE – Lei N° 10.847), which makes projections on the energy market to support both the ANEEL and the goverment in their decision making
24 - The Câmara de Comercialização de Energia Elétrica (CCEE - Lei N° 10.848), which replaced the Mercado Atacadista de Energia Elétrica and is responsible for electrcity commercialization (Vagliasindi & Besant-Jones, 2013).
Two distinct markets stemmed from these reforms:
- The Mercado de contratação regulada (Regulated contracting market), where distributors must make sure to contract sufficient new electricity to cover their future needs. It includes power producers, distributors and electricity traders. MCR represents 70% of the electric generation in Brazil (Costa, 2009).
- The Mercado de contratação livre (Free Contracting market), where agents can negotiate freely the terms of their electricity contracts and are not subject to price regulations. It includes large consumers (mainly companies), independent power producers and electricity traders (sell energy to free consumers and distribution companies). It accounts for 30% of the electric generation in Brazil (Costa, 2009).
Once agents have selected their market framework, they purchase the electricity at a spot price which is calculated by the CCEE (Câmara de Comercialização de Energia Elétrica).
25 3.1.2.2 Electricity mix in Brazil
Brazil is the largest electricity market among South American countries (Larrea, 2006). In 2014, according to the Empresa de Pesquisa Energética (EPE) electricity generation installed capacity reached 133 914 MW (a 5.7% increase from 2013).
Installed capacity grew tremendously in Brazil since the beginning of the 20th century, keeping
pace with the country’s growth both demographically and economically. According to the Ministério de Minas e Energia, in 2014 installed capacity in MW has been multiplied by more than 100 since the 1940’s and by more than 10 since the 1970’s.
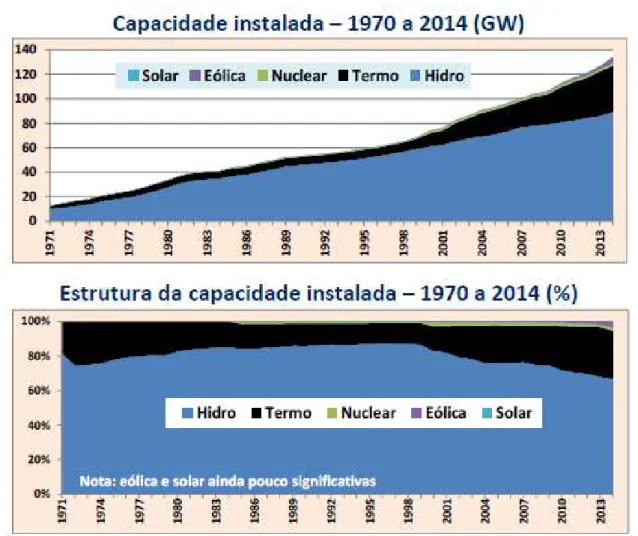
Figure 2 Installed capacity in Brazil from 1883 to 2014 in GW (Ministério de Minas e Energia, 2015)
When looking at the historical distribution of this electricity generation capacity it is very interesting to note that since the beginning both hydro and thermoelectric generating facilities have played key role. As stated above, Brazil’s first generation plant was a thermoelectric facility (inaugurated in Campos in 1883). Nevertheless, the first hydroelectric plant was built only 6 years later, in 1889, in the city of Juiz de Fora (Minas Gerais). Already in 1900, Brazil’s electric generation capacity relied more on hydraulic plants (5300 kW) than thermic plants (5100 kW).
26 Figure 3 Installed capacity evolution and distribution of the generating complex
(Ministério de Minas e Energia, 2015)
Though hydropower largely dominates the Brazilian power landscape, its share is shrinking in favour of other sources wheter traditional (thermal) or alternative (wind and solar).
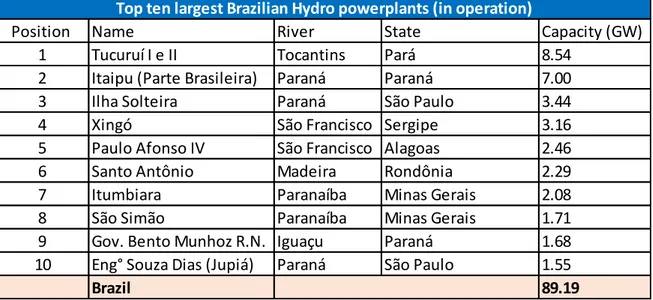
27 This period witnessed the construction of some of the world largest dams such as Tucuruí (8370 MW) and Itaipu (14 000 MW - shared with Paraguay). In 2015, Brazil had 158 hydro plants operating, 9 plants being built and another 26 projects cleared for construction (Duran, 2015). Dam building remains a sensitive issue in Brazil due to the social and environmental impact of their construction, as exemplified by the strong protests related to the Belo Monte dam construction in Amazonas (Le Monde, 2015). Two other issues are associated with dams in Brazil. First regarding geography, most of the hydro potential of Brazil is concentrated in the North of the country (especially the Amazon river basin) while most of the demand come from the industrialized cities of the South and South East. Then, dry periods have become critical in recent years, as insufficient reservoir levels have triggered temporary shutdowns of hydro plants (International Hydropower Association, 2015).
Though hydro is the top generating source in Brazil, its share has kept declining since 1996 when it represented 87.4% of the country’s installed capacity (Ministério de Minas e Energia, 2015). Record droughts in Brazil since the 2000’s and increasing environmental concerns about dams construction have led authorities to diversify the electricity matrix, increasing the share of non-hydro resources, in particular thermal facilities (Deloitte, 2010).
Figure 4 Hydro plants ranking by capacity (Ministério de Minas e Energia, 2015
- Thermal power is the second electricity generation source in Brazil in terms of capacity with 37 824 MW in 2014 (a 3.6% growth compared with 2013), and it
Position Name River State Capacity (GW)
1 Tucuruí I e II Tocantins Pará 8.54
2 Itaipu (Parte Brasileira) Paraná Paraná 7.00
3 Ilha Solteira Paraná São Paulo 3.44
4 Xingó São Francisco Sergipe 3.16
5 Paulo Afonso IV São Francisco Alagoas 2.46
6 Santo Antônio Madeira Rondônia 2.29
7 Itumbiara Paranaíba Minas Gerais 2.08
8 São Simão Paranaíba Minas Gerais 1.71
9 Gov. Bento Munhoz R.N. Iguaçu Paraná 1.68
10 Eng° Souza Dias (Jupiá) Paraná São Paulo 1.55
Brazil 89.19
28 represents 28.2% of the country’s generating capacities. Thermal generation encompasses several sources in Brazil, including gas, oil, coal and biomass. The first source of thermal generation in Brazil is natural gas. In 2014, natural gas power facilities had a total capacity of 12.6 GW (representing 33% of thermal generation in Brazil); then comes biomass generation facilities which are mostly using bagasse (what remains after sugarcanes are crushed to extract juice) with over 81% of the biomass production using this fuel. With a total capacity of 12.3 GW, biomass represented 32% of Brazil thermal generation. Ultimately, oil (7.9 GW) and coal (3.4 GW) are the last main sources of thermal generation, representing respectively 21% and 9% of the country’s thermal generation.
As mentioned above, thermal plants generation is on the rise as it benefits from the diversification strategy of Brazilian authorities that want to shift from the hydro centered model. From 1996 to 2014, thermal generation capacities increased from 7.0 GW representing 11.6% of the electricity mix) to 37.8 GW representing 28.2% (Dassie, 2011 and Ministério de Minas e Energia, 2015).
Figure 5 Thermal plants ranking by capacity (Ministério de Minas e Energia, 2015
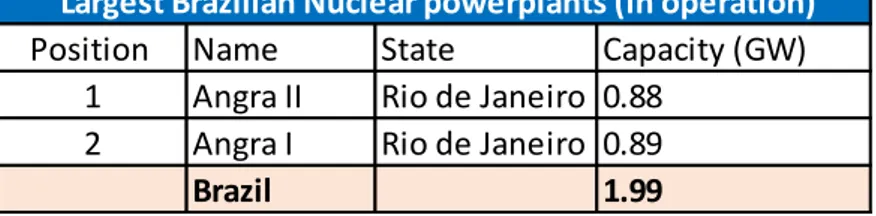
- Nuclear energy is the smallest electricity generation source in Brazil with less than 2 GW of installed capacity in 2014. There is only one nuclear power plant in Brazil whith two
Position Name Type State Capacity (GW)
1 Governador Leonel Brizola Natural gas Rio de Janeiro 1.06
2 Mário Lago Natural gas Rio de Janeiro 0.92
3 Norte Fluminense Natural gas Rio de Janeiro 0.87
4 Santa Cruz Natural gas Rio de Janeiro 0.84
5 Porto do Pecém Coal Ceará 0.72
6 Uruguaiana Natural gas Rio Grande do Sul 0.64
7 Fernando Gasparian Natural gas São Paulo 0.58
8 Mauá Oil Amazonas 0.55
9 Termopernambuco Natural gas Pernambuco 0.53
10 Cuiabá Natural gas Mato Grosso 0.53
Brazil 37.8
29 active reactors, located in Angra dos Reis (Rio de Janeiro). They have been built in 1985 and 2000 and are both operated by Eletronuclear (an Eletrobras entity). A third reactor (Angra III) in under construction but it should not enter into service before 2018 (Valor, 2014).
Figure 6 Nuclear plants ranking by capacity (Ministério de Minas e Energia, 2015)
- Renewable energy is the third largest source of power generation in Brazil. As
Biomass was already mentioned, renewables in this paragraph shall only refer to the two main sources of green energy: solar and wind power. In 2014, they represented an installed capacity of 4.9 GW. Wind energy in Brazil is booming, and the wind farm total capacity almost doubled in 2014, from 2686 MW to 4888 MW (EPE, 2015). Most of the wind energy is generated in the North and North East (with the exception of Rio Grande do Sul), where the winds are the strongest. According to Portal Brasil, in 2015, Rio Grande do Norte has the largest installed capacity (2243 MW), then comes Ceará (1233 MW), Rio Grande do Sul (1300 MW) and Bahia (959 MW).
Figure 7 Wind farms ranking by capacity (Ministério de Minas e Energia, 2015)
Position Name State Capacity (GW)
1 Angra II Rio de Janeiro 0.88 2 Angra I Rio de Janeiro 0.89
Brazil 1.99
Largest Brazilian Nuclear powerplants (in operation)
Position Name State Capacity (GW)
1 Praia Formosa Rio de Janeiro 0.11
2 Alegria II Rio de Janeiro 0.10
3 Parque Eólico Elebrás Cidreira 1 Rio de Janeiro 0.07
4 Miassaba 3 Rio de Janeiro 0.07
5 Rei dos Ventos 3 Ceará 0.06
6 Canoa Quebrada Rio Grande do Sul 0.06
7 Rei dos Ventos 1 São Paulo 0.06
8 Eólica Icaraizinho Amazonas 0.06
9 Alegria I Pernambuco 0.05
10 Parque Eólico de Osório Mato Grosso 0.05
Brazil 4.89
30 - Solar energy which, even though it is growing rapidly, remains marginal in Brazil. In 2014, installed capacity of electricity generation from solar sources reached 15 MW (compared to 5 MW in 2013).
Several other sources of renewable energy are in trial in Brazil such as tidal power, but none of them have yet reached a large generation scale.
3.1.2.3 Energy policy
Brazil’s electricity demand is expected to rise by 80% in 2035 (BP Energy Outlook, 2014) and therefore new generation capacities will have to be installed every year at a steady pace. Alternative energies such as wind and solar power are particularly well designed to meet these fast-growing power needs. For instance, in Brazil, solar plants can be built in less than a year (Spatuzza, 2015) as opposed to several years for a large dam.
On the long run, economic growth is the key driver to electricity demand. Indeed, there is a strong positive correlation between Gross Domestic Product and electricity demand, as more economic activity needs more electricity. When GDP per capita increases, energy demand is also expected to grow as households will increase their electricity consumption improving their comfort and using new appliances (OME, 2007).
In Brazil, the Empresa de Pesquisa Energética is in charge of planning the evolution of the energy demand in order to support government decisions in this area. According to their last report (Plano Decenal de Energia 2024), GDP is expected to grow by 38% between 2015 and 2024, representing a 3.2% compound annual growth rate. GDP per capita is also expected to rise by 30% by 2024 while the Brazilian population will grow from 205.3m to 217.8m (+6%). These figures have been taken into account by EPE’s calculations in order to forecast the
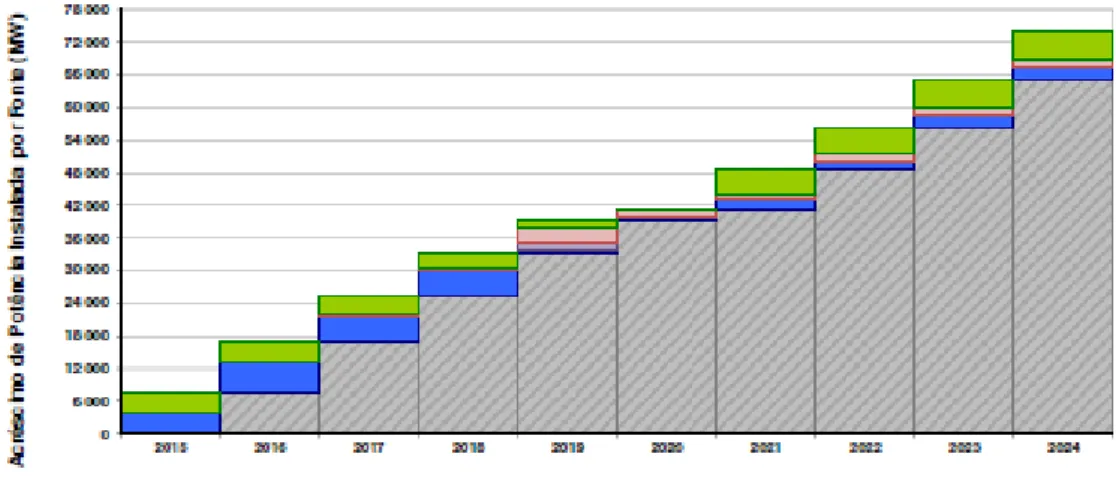
country’s need for generation capacity. Between 2015 and 2024, 74 099 MW should be added
to meet the Brazil’s energy demand. This increased capacity should be distributed as follows: - 27 183 MW increase in hydroelectric capacities
- 10 546 MW increase in thermoelectric capacities
31 - 1 405 MW increase in nuclear energy
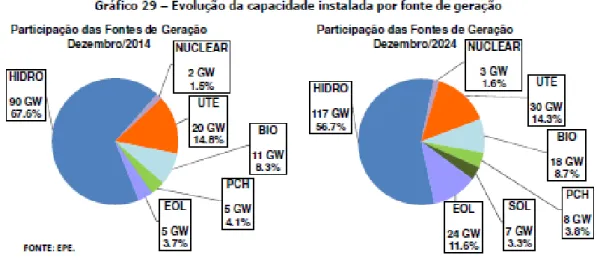
These numbers clearly show that a large shift is anticipated in the Brazilian energy matrix as traditional energies’ share will dwindle. Hydro, which represented 67.6% of the matrix in 2014, is expected to account for 56.7% in 2024 and thermoelectricity should be reduced from 14.8% to 14.3%. Alternative energies are expected to boom, and in 2024 wind is expected to represent 11.6% of the electricity distribution (vs 3.7% in 2014), solar 3.3% (vs less than 1% in 2014) and biomass 8.7% (vs 8.3% in 2015).
Figure 8 Distribution of electric generation installed capacities between 2015 and 2024 (EPE, 2015)
32 Figure 9 Electricity generation capacity increase by source between 2015 and 2024 in MW
(EPE, 2015)
3.2 Renewable energies fundamentals
3.2.1 General aspects
Renewables are usually defined as energy sources that are replenished by nature on a human timescale, deriving from the sun or from other natural movements of the environment (Ellabban, Abu-Rub and Blaabjerg, 2014).
The International Energy Agency expects renewables to account for 37% of the world electric power generation in 2040 vs 21% in 2012 (IEA, 2014).
3.2.2 Hydro power
33 growing as in emerging countries massive hydroelectric power potential remains untapped. According to the International Energy Agency, hydropower accounted for 16.5% of the world electric generation in 2013 (IEA, 2014).
In Brazil, there is a sub type in hydro power generation which is called PCH. It corresponds to Pequena Central Hidrelétrica and refers a generation plant with a capacity between 3 MW and 30 MW according to the ANEEL.
3.2.3 Wind power
Wind energy captures the power of air flows through wind turbines in order to produce electricity. It has earned its status as the second most widespread source of non-fossil electric generation in the world. Wind power has a very high growth prospect, as onshore wind farms costs have shrunk by 30% between 2000 and 2012 (Investir, 2015). Wind energy only accounts for 2.3% of the world electricity generation but installed capacities are expected to triple by 2020 (IEA, 2014).
3.2.4 Biomass
Biomass energy is obtained by the combustion of biological material. It is divided into four categories: solid biomass, biogas, solid renewable municipal waste and liquid biomass. It represents three-quarters of the global renewable energy output but only 1.4% of total electricity generation in 2012, as most of it is used for other purposes such as transport biofuels (Observ’ER, 2013). Nevertheless, it remains a promising renewable electricity generation source in many countries.
3.2.5 Solar power
34 - CSP) which concentrates sun rays to obtain high temperatures in order to produce electricity through water vapor (Observ’ER 2013). Most of the installed capacities are on-grid but many off-grid applications are rising too (for remote areas for instance). Both technologies account for 0.5% of the world electric generation mix (Observ’ER 2013).
3.2.6 Others
Renewables gather a wide array of power sources. Many of them have a promising future but have not yet reached a widespread diffusion, usually because the technology is not fully operational. Among these can be found tidal power, wave power and geothermal power (some are already at an operational stage but still marginally developed in Latin America).
3.3 Sustainability in Brazil
3.3.1 Greenhouse gases targets
35 3.3.2 International commitments
For the COP21 climate conference held in December 2015, Brazil already described its commitments. The country aims at reducing its greenhouse gases emission by 37% in 2025 (compared to 2005 historical level). The country eventually targets a 43% reduction in 2030 (compared with 2005).
Three actions will be taken to reach this goal. First, the development of investments in low-carbon agriculture, then through the end of illegal deforestation in the country and the restauration and reforesting of deteriorated land, and finally by increasing the share of renewables in the energy matrix. Brazil’s commitment specifies at least a 23% increase in the use of non-hydro renewables for electricity generation (solar, wind, biomass…). The development of renewable is a strategic priority for the Brazilian government in order to contribute to the mitigation of global warming (Valor, 2015).
3.3.3 Green energies development capability
3.3.3.1 Natural potential
Brazil has a promising future for alternative energy with untapped potential for most green energies. For hydropower, the total estimated current potential reaches 260GW (von Sperling, 2012) with only 86GW of installed capacity (Ministério de Minas e Energia & EPE). Wind power potential is even higher with over 300GW (Brazil Windpower, 2015) but only 6,3GW of installed capacity (Associação Brasileira de Energia Eólica, 2015). Solar potential also remains largely untapped as solar installed capacity is still marginal (Spatuzza, 2015).
Not only does the country boast an extraordinary future for renewable, it also has a great complementarity between green energies. Most of the country’s hydroelectric generation is based on hydropower which slowdowns its electricity generation during the drought season, while other energies can work a full power during this season such as wind (Amarante, O et
36 3.3.3.2 Renewable energy social support
Over 70% of the electricity in Brazil is already generated through renewable sources and the country has set ambitious goals to further develop green energies. Nevertheless, as Brazil is a democracy, any further shift in the energy matrix and the development of renewables will need the support of the public opinion.
First, regarding climate change, it is striking to see that Brazilians tend to be really concerned. In a 2015 poll by the Pew research center, 75% declared to be very concerned about global climate change, which is more than Argentina (57%) or Chile (62%). This figures should mean that further actions against global warming should be understood by Brazilians.
Renewable energy support also seems to be quite strong among Brazilian population. According to a 2015 poll from DataSenado in partnership with Columbia University. 85% of the respondents agreed that Brazil should invest more in renewables (wind and solar) even though they are more expensive. For 68% of them energy companies should be required to invest in renewable energies even if it drives up their electricity bill. This poll confirmed the concerns of Brazilians about the environment as 86% declared to be very worried about climate change and 88% very worried about pollution (Portal PCH, 2015).
These figures tend to demonstrate that strong public support can be expected in the development of renewables in Brazil.
37 3.4.1 Foundings of corporate growth
The common thread of this thesis is to understand how a foreign firm can enter the Brazilian renewable energy market and to give a better perspective on this topic, it is essential to go back to the core theories of corporate growth strategies.
Business growth is a particular trend in which there is an increase in the activity. In the Theory
of the Growth of the Firm (1959), Edith Penrose offered a very relevant definition of corporate growth as “the continual extension of the range and nature of the activities of an organization”.
Expanding business is a key objective for every management team which has to maximize shareholder value (i.e. increase share price and / or dividends). Shareholders are looking for maximum returns from the shares they own and therefore will support managers that will improve the firm’s performance using appropriate growth strategies.Strategies that maximize shareholder value center on targeting growth opportunities (Doyle, 2000).
Corporate growth for a firm can be defined as “a situation where an organization raises the level of its objectives from what it had achieved in its immediate past in terms of its market share, sales revenue…” (Talloo, 2007). Therefore, any firm looking to improve its past performance, be it by launching a new product or expanding to a new market, is undertaking corporate growth initiatives.
This way, it is rational for managers to act, with the support of shareholders, towards growth initiatives that expand the business.
However, beyond the maximization of shareholder value, scholars have highlighted several other strategic incentives for companies to grow.
38 growth of the firm (even across borders) in order to internalize such transactions (Kogut & Singh, 1988).
3.4.2 Corporate growth strategies
Most scholars distinguish two types of growth: internal and external growth, each of them carrying benefits and drawbacks.
First, internal growth is the most traditional form of expansion for a firm. The company is going to invest through its internal channels to expand its activity. It can happen through diversification with the launch of a new product or service (using research and development to innovate for instance), or another option is to increase the customer base. This can be achieved through the entry on new markets with geographic expansion or simply by increasing the revenue from each customer (Söllner, 2009). According to McGrath (2006), who empirically tested the number of firms growing internally, this type of expansion is a minority. Among the 931 companies tested (583 US firms and 348 non-US), internal growth only accounted for 6% of their corporate growth.
External growth corresponds to an expansion through the acquisition (or merger) of another company’s resources and capabilities. This strategy provides the same outcomes as the internal growth: diversification of the product or service or expansion of the customer base. An acquisition gives rise to one larger company (one of the company being absorbed after the purchase) whereas a merger implies a combination of two firms resource to form a new entity. External growth allows the company to scale up its operations adding new resources to the firm in a situation where growth forecast are positive (Andrade & Stafford, 2004).
39 growth is often interesting as there is no need to capture business from competitors. It also allows to overcome some entry barriers (legal, cultural, regarding intellectual property). For many energy firms in the renewable industry this expansion strategy has been a two-step move. First there has been a diversification initiative to shift from a traditional energies centered model (oil & gas, coal, nuclear...) in order to add renewable energies to their portfolio. This evolution has been guided first by business considerations. Most large energy multinationals have seen in the development of renewable energies (often financially supported by governments) an attractive business option. Then to maximize the benefits of this diversification and to increase their performance they started to enter new markets. For instance, China itself aims to reach a 15% share of renewables in its energy mix by 2020 for which the government is willing to invest more than $200 billion US (Escobar & Vredenburg, 2010), representing a strong incentive for companies to both diversify into renewables and enter developing markets.
3.4.3 Sustainable initiatives to corporate growth
Though for decades, most leaders believed that there was an opposition between competitiveness and ecology, recent trends in the economy show this is not so radical.
40 The idea that corporate performance and green strategies can go along has been widely developed by Renato Orsato (2006). He developed a diagram which encompasses the four types of green competitiveness strategies a firm may choose.
The first is Eco-efficiency where firms look for concealed opportunities of investment in their production process which would allow them to increase efficiency while reducing their costs (especially environmental cost such as waste). Beyond Compliance Leadership refers to firms that make green efforts beyond required rules and try to show them to the public. Eco branding corresponds to creating ecology-oriented products and sell them at a higher price to consumers willing to pay this premium. Finally, Environmental Cost Leadership is a strategy designed for market with high competition on prices and low differentiation. In this context firms may try to focus on radical innovation regarding their product in order to both disturb the market and reduce their ecological footprint.
As mentioned above combining ecological ambitions with corporate growth strategies is everything but incompatible and many options are available for firms willing to engage on this path.
3.5 Business internationalization
41 When implementing a corporate growth strategy, internalization is a very common option for a company to expand. Internationalization may refer to several strategic options for a firm such as: direct exports, franchising licensing and foreign direct investments as green-field, acquisition or alliances (Peng, 2009). This part will only focus on the latter which is the more relevant regarding the renewable power generation industry which is at the core of this thesis.
3.5.1 Foreign market selection
Internationalization can be described as “either an attitude of the firm towards foreign activities or to the actual carrying out of activities abroad” (Vahlne & Wiedersheim-Paul, 1973). It is one strategic option for a firm to expand.
The foreign entry process is complex and difficult (Arnold, 2013) therefore companies usually proceed step by step, entering a few countries at a time. Picking the right market(s) involves a lot of research and investigation. Each company may have specific criteria depending on its product or business model but there are external criteria that can be considered as essential for any company. These are diverse and include: market demand, level of competition, country performance, trade barriers, political risk, distribution accessibility, climate and location, infrastructure, environmental concerns, currency convertibility, cultural factor and legal environment (Manzella, 1997).
An in-depth review of these external factors is not to be considered sufficient as both external (country specific) and internal (company specific) factors impact the outcome of the country review process (Koch, 1997). Indeed it is essential that the country’s specific benefit match the strategic orientations of the firm. Pen (2009) offers a categorization firm strategic objectives to be matched with the country specific advantages: natural resource seeking, market seeking, efficiency seeking and innovation seeking. The more relevant in the scope of this thesis would be market seeking which corresponds countries that are supposed to have important demand for the firm’s products and services (i.e. green electricity generation).
42 foreign market may disturb the industry in general. By the same token, the exchange-of-threat concept argues that in a firm n°1 from country n°1 invest in country n°2. Then the competitor in country, firm n°2, will follow suit and invest in country n°1 which should balance the competition (Dubin, 1975).
3.5.2 Barriers to foreign entry strategies
3.5.2.1 Informal barriers
The screening of potential countries where a market entry is intended should put an emphasis on possible barriers.
Entering a new national market is always a very particular challenge for a firm as it means going outside of its comfort zone. Scholars have described this situation as the liability of foreignness which can be defined as “inherent disadvantage foreign firms experience in host countries because of their nonnative status” (Pen, 2009). The first aspect of this liability would be the ignorance of informal business rules which are integrated by local competitors but cannot be known until the firm actually have operations in the country. Foreign companies also may be discriminated against as clients sometimes consider foreign products as suspicious or are incentivized to buy national production (Pen, 2009).
43 idea takes roots in the contemporary institutional theory which assumes that to survive organizations must shape according to the norms and cultural system which dominates in its environment (DiMaggio & Powell, 1983). These institutional distance may increase transaction costs (see above) as a foreign player will generally face incurred cost when operating in an unknown institutional framework (Peng, 2009).
3.5.2.2 Formal barriers
As opposed to informal barriers, formal barriers are objective hurdles that prevent foreign firms to enter a national markets. They can be government driven such as tariffs or the result of a political / economic instability. They also might stem from local competitors strategies to prevent the entry of foreign firms.
Regarding government regulations several options are used of which the most common are tariff barriers which are taxes imposed on imports. Though major economists and in-depth research have proven these protections to be inefficient and costly, they tend to remain because of the political power of some industry lobbies that manage to convince government (Peng, 2009).
With the development of trade agreements around the world tariffs have become highly criticized. Therefore governments now more often resort to nontariff barriers which according to Peng (2009) “discourages imports using means other than taxes on imported goods. NTBs include subsidies, import quotas, export restraints, local content requirements, administrative policies, and antidumping duties”. These forms of protectionism account for two third of the trade-restricting measures the World Bank identifies (The Economist, 2009). The most widely used are subsidies which correspond to financial aids to local producers and quotas corresponding to trade restrictions on the quantity of products to be imported. Administrative policies are another common form of foreign market entry barrier. For instance licensing is often used to forbid foreign competitors to enter some market segments. Argentina enforced several discretionary licensing rules for some consumer goods in order to protect local producers (The Economist, 2009).
44 switching barriers (to prevent customer from changing provider). Predatory pricing is a relevant example of strategy that can be used not only to prevent entry but also to drive competitors out of the market. The first step corresponds to selling at loss (below costs) to force competitors to make losses and leave. Then the firm will benefit from a higher market share that should compensate from its previous loss (Leslie, 2013). Exclusive agreements are also a common strategy for firms to block entry. Aghion and Bolton (1987) indicate that firms who face the risk of entry of competitors with lower prices on their markets will tend to enter into longer term contracts in order to deter newcomers from entering.
3.5.3 Entry mode selection
Once a particular foreign market has been targeted, the company needs to make a choice on the entry-mode to penetrate this geography. Scholars usually distinguish two main types of entry options: acquisition and greenfield investment.
Acquisition is defined as “the purchase of stock in an already existing company in an amount sufficient to confer control”. Greenfield investment represents a “start-up investment in new facilities”. There is an alternative entry option which corresponds to an in between solution, the joint venture. It can be described as “the pooling of assets […] by firms who share joint ownership and control over the use and fruits of these assets” (Kogul & Singh, 1988). To be relevant with the scope of this thesis we will put a particular emphasis on the two most common options acquisition and greenfield investment.
These entry strategies have been thoroughly studied by academic literature which have highlighted for each of them benefits and drawbacks.
45 the value of the combined firm is greater than the sum of the values of the individual firms” (Bradley et a.l, 1988). These synergies generally correspond to an improvement of efficiency or a stronger market power through the support of the mother company (Singh & Montgomery, 1987). In an international acquisition, the transfer of knowhow is also a powerful synergy between the firms and a strong incentive (Seth, Song & Pettit, 2002). Nevertheless cross border acquisitions are a path full of pitfalls. The main risk is the cultural clash with the acquired entity as the integration of a foreign firm is always a challenge. According to Shimizu et al. (2008) “Differences in national culture, customer preferences, business practices, and institutional forces, such as government regulations, can hinder firms from fully realizing their strategic objectives”. This situation has been described as “double-layered” acculturation, describing the context when the recently integrated company must deal not only with a foreign national culture but also with a freshly imported corporate culture (Barkema, 1996). To this should be added information asymmetry which is a risk for both the realization of synergies and the ability to conduct business (Shimizu et al., 2004).
Greenfield investments starts on bare ground and the firms have to build everything. As key benefits it allows first to have a total control of the new entity which permits an efficient overview of all business operations as well as complete freedom on long term strategy (Irwin, 2012). There also allow firms to transfer their firm-specific advantage in another country, as opposed to an acquisition (Dunning, 1988). These advantages may include immaterial assets
such as “management practices or firm-embedded technological knowledge” (Szalucka, 2010).
Nevertheless high costs are to be associated to greenfield investments, in particular the conformity cost as the firms needs to adapt to the foreign framework and suffers both the liability of newness and of foreignness (Slangen & Hennart, 2008). Finally, as opposed to an acquisition, the newly formed entity needs to create everything and especially strategic assets defined as “the set of difficult to trade and imitate, scare, appropriable and specialized resources and capabilities” (Amit & Schoemaker, 1993). The process of creating strategic assets allowing to efficiently compete with other local firms is by far one of the main challenges of the liability of newness.
46 generally by the researchers from the University of Uppsala with the “psychic distance” concept. This corresponds to the level of uncertainty regarding the specificities of the foreign market (in particular language and culture). The concept was first developed by Vahlne and Wiedersheim-Paul (1973) through the study of the internationalization of four Swedish firms. They define it as “factors preventing or disturbing the flow of information between firm and market” such as “differences in language, culture, political system, level of education, level of
industrial development…”. They found that to a certain extent firms would gradually enter
countries which have a higher psychic distance. Kogut and Singh (1988) used Hofstede’s culture dimension model to outline the relation between cultural distance and uncertainty avoidance with the choice of an entry strategy.
Experience is also a key concept when looking at entry mode options. Joohanson and Vahlne (1977) explained that a company goes from exporting to wholly owned subsidiary as its experience of the market grows and its perception of risks decreases.
Davidson (1980) has gone further and highlighted significant trends regarding firms entry mode selection. Firms often adopt a follower attitude as they tend to invest more often where their direct competitors have invested. They also select countries with supposed cultural similarity for their priority investments. A firms experience in a country influences the chance of an acquisition.
The entry mode choice can also be influenced by the strategic situation of the firm in relation with its competitors. If a firm is acting on a defensive response to a competitor’s move (for instance following the industry leader in a foreign expansion), it is more likely to proceed by acquisition as it allows a quick entry (Dubin, 1975).
4 METHODOLOGY
47 For Degu & Yigzaw (2006), research is a “systematic collection, analysis and interpretation of data to generate new knowledge and answer a certain question or solve a problem”. Therefore, answering a particular academic question means going through a research process.
As mentioned above the question this thesis is looking to answer is: How do foreign firms enter the Brazilian renewable power generation market? In order to perform this exercise the case study methodology has been chosen. The next paragraphs should lay explanations on both the relevance of the methodology and the choice of a particular entity to study.
4.2 Research methodology
As research’s results are highly linked to the methodology employed (Myers, 2009), the methodological approach selection and design are essential. There is a choice to make for the research willing to undertake a new work in order to define the right “methodological option” which is a “research strategy appropriated for the problems that need to be solved, for the aims and objectives assumed through that research” (Zait, 2009).
In the context of this thesis, a case study has been chosen to explore the subject of foreign market entry in the green electricity generation sector.
48 This methodology has several strengths which explain its wide use among various fields of academic research. According to Gil (2007), the study of few selected cases allows to broaden and deepen the understanding of a particular topic. One of the case study based methodology’s main asset is the ability to examine a phenomenon within its context as opposed to other types of research framework that would tend to isolate the process from its environment (Zainal, 2007). Cases are also praised for the variety of approaches they allow to explore a single topic, as they offer “a variety of lenses which allows for multiple facets of the phenomenon to be revealed and understood” (Baxter & Jack, 2008). Case study method is also considered as dynamic and practical and proves really helpful to explore complexities of real situations that would be hard to describe in another methodological context (Zainal, 2007).
Case studies are therefore well suited to some situations when the context and the phenomenon to be explored are complex and related. Yin (2003) describes several situations where a case study is a convincing methodology. One of them is when the focus of the research is to answer the “how” and “why” questions, which is relevant with the research framework of this thesis as it is looking to explore the stakes of corporate strategies in a particular industry and geography.
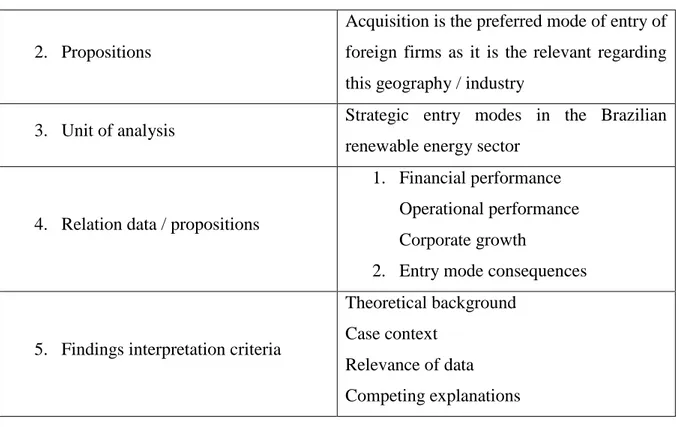
All the components of the case study methodology as defined by Yin (1994) have been integrated in this thesis in order to follow a relevant methodological approach.
Case study methodology components
49 2. Propositions
Acquisition is the preferred mode of entry of foreign firms as it is the relevant regarding this geography / industry
3. Unit of analysis Strategic entry modes in the Brazilian renewable energy sector
4. Relation data / propositions
1. Financial performance Operational performance Corporate growth
2. Entry mode consequences
5. Findings interpretation criteria
Theoretical background Case context
Relevance of data Competing explanations
In the particular context of this thesis topic, a case study approach was the most suited to encompass the ins and outs of the subject. Regarding the aim of this thesis a qualitative approach has been selected with a case study based methodology.
4.3 Analytical framework
4.3.1 Framework definition
A specific framework will be used to identify the strategy of the studied firm and analyze its performance.
Understanding the underlying factors of company’s performance is an essential consideration to build this framework. When looking at a firm’s performance, two main theoretical paths can be taken. First, the industry structure view for which the main factor are the conditions of the sector in which the company operates (Porter, 1980). The resource-based view considers that the performance results from the firms owns resources (Penrose, 1959). However, both these approaches are limited to single country analysis. Christmann, Day and Yip (1999) have extended the analysis by adding country characteristics to measure subsidiary performance.
50 Their results showed that country conditions were a determining factor to a subsidiary’s performance.
This thesis focuses on green power firms’ foreign subsidiaries and therefore a specific framework was created relevant to this particular industry. It was built to take into account both considerations on the firms’ performance factors and particular characteristics of the green power sector. This framework is based on two analytical perspectives: the entry mode and the share of green activities. Regarding the entry mode, as mentioned previously, two main strategies have been identified by academic literature: acquisition and greenfield investment. Both are essential keys of understanding to most firms’ strategies to enter and grow on a foreign market. The share of green activities relates to the proportion of renewable business in a company’s output which can be measured by turnover or the amount these activities represent in total production capacities. Estimating the degree of sustainability of a business is a highly debated topic among academic research (Stubbs & Cocklin, 2008) as it can impact many fields; environmental, social, political… In the design of this framework, “green activities” have been defined using existing frameworks (Pojasek, 2007) as “meeting the needs of the organization and its stakeholders while sustaining the environmental […] resources needed for the future”. This framework can be synthesized through a four-cell matrix representing the main strategies for companies with sustainable activities looking to enter a foreign market.
(1) Pure player & acquisition
S h ar e o f gr e e n act ivi ti e s Entry mode
Pure player & Greenfield (3) Balanced & Greenfield (4) Balanced & Acquisition (2) Pure player &
Acquisition (1)