ActaTropica142(2015)167–177
ContentslistsavailableatScienceDirect
Acta
Tropica
j ou rn a l h o m epa g e :w w w . e l s e v i e r . c o m / l o c a t e / a c t a t r o p i c a
Assessment
of
the
relationship
between
entomologic
indicators
of
Aedes
aegypti
and
the
epidemic
occurrence
of
dengue
virus
3
in
a
susceptible
population,
São
José
do
Rio
Preto,
São
Paulo,
Brazil
Francisco
Chiaravalloti-Neto
a,∗,
Mariza
Pereira
b,
Eliane
Aparecida
Fávaro
c,
Margareth
Regina
Dibo
d,
Adriano
Mondini
e,
Antonio
Luiz
Rodrigues-Junior
f,
Ana
Patrícia
Chierotti
d,
Maurício
Lacerda
Nogueira
caDepartamentodeEpidemiologia,FaculdadedeSaúdePública,UniversidadedeSãoPaulo,Av.Dr.Arnaldo,715,01246-904SãoPaulo,SP,Brazil bDiretoriadeCombateaVetores,SuperintendênciadeControledeEndemias,RuaPaulaSouza,166,01027-000SãoPaulo,SP,Brazil
cLaboratóriodeVirologia,FaculdadedeMedicinadeSãoJosédoRioPreto,Av.BrigadeiroFariaLima,5416,
15090-000SãoJosédoRioPreto,SP,Brazil
dLaboratóriodeVetoresdeSãoJosédoRioPreto,SuperintendênciadeControledeEndemias,Av.BrigadeiroFariaLima,5416,15090-000SãoJosédoRio
Preto,SP,Brazil
eFaculdadedeCiênciasFarmacêuticas,UniversidadeEstadualPaulista,RodoviaAraraquara–Jaú,Km1,14801-902Araraquara,SP,Brasil
fDepartamentodeMedicinaSocial,FaculdadedeMedicinadeRibeirãoPreto,UniversidadedeSãoPaulo,Av.Bandeirantes,3900HospitalUniversitário,
2◦andar,14049-900RibeirãoPreto,SP,Brazil
a
r
t
i
c
l
e
i
n
f
o
Articlehistory: Received28June2014 Receivedinrevisedform 24November2014 Accepted27November2014 Availableonline4December2014
Keywords: Dengue Aedesaegypti Entomologicindicator Spatialanalysis Temporalanalysis
a
b
s
t
r
a
c
t
Theaimsofthisstudyweretodescribetheoccurrenceofdengueinspaceandtimeandtoassessthe rela-tionshipsbetweendengueincidenceandentomologicindicators.Weselectedthedengueautochthonous casesthatoccurredbetweenSeptember2005andAugust2007inSãoJosédoRioPretotocalculate inci-denceratesbymonth,yearandcensustracts.Themonthlyincidenceratesofthecitywerecomparedto themonthlyBreteauindices(BI)oftheSãoJosédoRioRegion.BetweenDecember2006andFebruary 2007,anentomologicalsurveywasconductedtocollectimmatureformsofAedesaegyptiinJaguaré,a SãoJosédoRioPretoneighborhood,andtoobtainentomologicalindices.Theseindiceswererepresented usingstatisticalinterpolation.TorepresenttheoccurrenceofdengueintheJaguaréneighborhoodin2006 and2007,weusedtheKernelratioandtoevaluatetherelationshipbetweendengueandthe entomolog-icalindices,weusedageneralizedadditivemodelinaspatialcase–controldesign.BetweenSeptember 2005andAugust2007,theoccurrenceofdengueinSãoJosédoRioPretowasalmostentirelycaused byDENV3,andthemonthlyincidenceratespresentedhighcorrelationcoefficientswiththemonthlyBI. InJaguaréneighborhood,theentomologicalindicescalculatedbyhectarewerebetterpredictorsofthe spatialdistributionofdenguethantheindicescalculatedbyproperties,butthepupaequantificationdid notshowbetterpredictionqualitiesthantheindicesbasedonthecontainerpositivity,inrelationtothe riskofdengueoccurrence.Thefactthatthemunicipality’spopulationhadahighsusceptibilitytothe serotypeDENV3beforethedevelopmentofthisresearch,alongwiththealmosttotalpredominanceof theoccurrenceofthisserotypebetween2005and2007,facilitatedtheanalysisoftheepidemiological situationofthediseaseandallowedustoconnectittotheentomologicalindicators.
©2014TheAuthors.PublishedbyElsevierB.V.ThisisanopenaccessarticleundertheCCBY-NC-SA license(http://creativecommons.org/licenses/by-nc-sa/3.0/).
Abbreviations: BI,Breteau Index(cis);GIS,geographicinformationsystem; SINAN,notifiablediseasesinformationsystem.
∗Correspondingauthor.Tel.:+551130617920/982081602. E-mailaddresses:[email protected](F.Chiaravalloti-Neto),
[email protected](M.Pereira),[email protected](E.A.Fávaro), [email protected](M.R.Dibo),[email protected](A.Mondini), [email protected](A.L.Rodrigues-Junior),[email protected](A.P.Chierotti), [email protected](M.L.Nogueira).
1. Introduction
Dengue infection is caused by four antigenically distinct
serotypesofthedenguevirus(DENV1,DENV2,DENV3,andDENV4),
anditsmainvectoristheAedesaegyptimosquito.Eachserotype
infectionprovidesspecificlong-termimmunitybutonlytransient
immunitytotheotherserotypes(WHO,2010).Dengueis
consid-eredthemostsignificantarbovirusthataffectshumans.Dengue
is estimatedtoannuallycause390millioninfections, including
http://dx.doi.org/10.1016/j.actatropica.2014.11.017
96millioncasesofclassicaldengueand20,000deathscausedby
dengue(Bhattetal.,2013).
InBrazil,thenumbersofcasesanddeathsrelatedtodenguehave
beenincreasingovertimebecauseoftheintroductionor
reintro-ductionofvirusserotypesandthesimultaneouscirculationofthe
fourserotypes(Drumondetal.,2012,2013;Figueiredoetal.,2008;
Teixeiraetal.,2013,2005).InthestateofSãoPaulo,thenumber
ofdenguecaseshavefollowedthesamepattern,increasingfrom
2001(51,668cases)to2007(92,345cases),2010(189,330cases),
and2013(201,498cases)(CVE,2014).
Trackingtheviralserotypesthat arecirculatingisan
impor-tanttoolforepidemiologicalresearch,particularlyinrelationto
thespatialand temporaldynamics ofthediseaseand infection
incidence(Mondinietal.,2009).Moleculartechniquesbasedon
PCRprovidebothadvanceddiagnosticsofviralinfections,mainly
dengue and yellow fever, and quick and precise answers for
disease-surveillancesystems(Bronzonietal.,2005;Teixeiraetal.,
2005).
Regardingentomologicalindicators,many authorshave
sug-gestedthequantificationofthepupaeofAe.aegyptiasanadequate
way to evaluate the risk of dengue transmission (
Arredondo-Jimenezand Delgado-Valdez, 2006; Barrera et al.,2006; Focks, 2003;FocksandChadee,1997;NathanandFocks,2006; Romero-VivasandFalconar,2005).Incontrast,Sanchézetal.(2010,2006)
showedthatinareaswithlowinfestationlevels,theBreteauIndex
(BI)wassuitabletoindicateareasthathadahigherriskofdengue
occurrence,andMorrisonetal.(2008)statedthatotherstudies
arenecessarytovalidatethoseresultsbeforetheirapplicationto
surveillanceactivitiesandvectorcontrolofthedisease.
Authors,suchasFocks(2003),Focksetal.(2000)andNathan
andFocks(2006)havesuggestedthatindicatorscalculatedbythe
areaofpropertiesandbyinhabitantswouldhaveabetter
predic-tioncapacityforthedisease-occurrenceriskthansolelyindicators
calculatedbyproperty,recommendingthedevelopmentofstudies
thataddresstheseissues.
Geographicinformationsystems(GIS),inadditiontobeingtools
forspatialanalysis,enablethespatialcomponenttobeincludedin
studiesofmetaxenicdiseasesandallowtheassociatedvariablesto
bemappedandspatiallyanalyzed.SomeexamplesofGIS
applica-tionsarethestudiesdevelopedbyBarreraetal.(2000),Mondini
andChiaravalloti-Neto(2008)andTranetal.(2004).
Theaimsofthisstudyweretodescribetheoccurrenceofdengue
inspaceandtimeandtoassessthepotentialuseofentomologic
indicatorsthatwerebasedonthequantificationofpupaeandon
thequantificationofcontainerswithimmatureformsofAe.aegypti
calculatedbypropertyandbyareatopredictdengueoccurrence.
2. Materialsandmethods
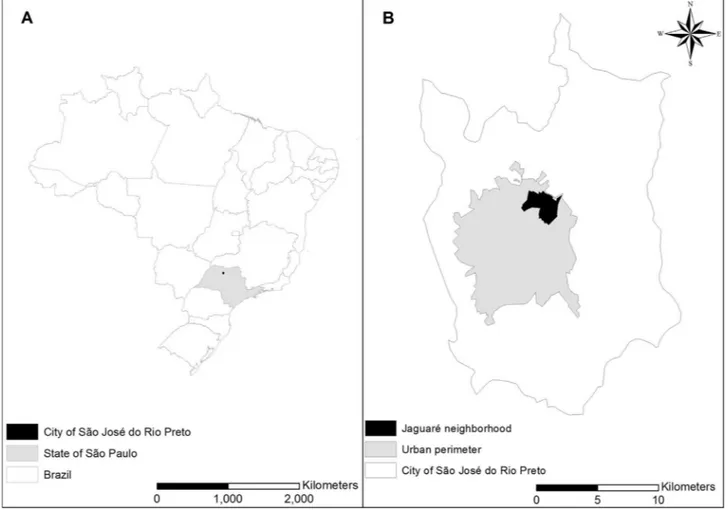
ThemunicipalityofSãoJosédoRioPretoislocatedinthe
north-westregionofthestateofSãoPaulo(Fig.1A),Brazil(20◦49′11′′S
and49◦22′46′′W).Thealtitudeofthismunicipalityis475mabove
sealevel,anditissituatedinaregionoftropicalclimatewithan
averageannualtemperatureof25◦Candanaverageannual
pre-cipitationof1410mm.SãoJosédoRio Pretoisthemaincityin
anareaconsistingof102municipalities.Thecityhasmorethan
400,000inhabitants,analmostuniversalwatersupplysystem,and
developmentindicescomparabletothoseofdevelopedareas.
AfterthereintroductionofAe.aegyptiinthecityin1985,the
firstautochthonouscasesofdengueoccurredin1990,whenthe
presenceofDENV-1wasdetected.In1998,DENV-2wasdetected,
in2005DENV-3wasdetected(Mondinietal.,2009),andin2011,
DENV-4wasdetected(Roccoetal.,2012).Sincethe2000s,thecity
hasbeenconsideredendemicfordengue(Mondinietal.,2005).
Alloftheautochthonousdenguecasesthatoccurredintheurban
areaofSãoJosédoRioPretobetweenSeptember2005andAugust
2007wereconsideredinthisstudy.Thecaseswereconfirmedby
serologictesting(ELISA-IgM),RT-PCRorclinical–epidemiological
criterionandwereregisteredintheNotifiableDiseasesInformation
System(SINAN).Duringthisperiod,serologictestingwasusedto
confirmthedenguecasesuntiltheincidencehadreached
approx-imately300casesper100,000inhabitants.Afterthat,accordingto
thegovernmentcasedefinition,theclinical–epidemiologic
crite-rionwasusedtoconfirmthedenguecases.
BetweenSeptember2005andAugust2007,aviraldiagnostic
testwasperformedusingtechniquesof molecularbiology with
blood samples frompatients withclinical diagnosesof dengue
fever(Bronzoniet al.,2005)who wereselectedin healthunits.
Theirserawerestoredat−80◦C. ViralRNAwasextractedfrom
140lofserumwiththeQIAampViralRNAMinikit(QIAGEN,Inc.)
asdescribedbythemanufacturer.Themethodologydescribedby
Bronzonietal.(2005)wasusedtodetectthedenguevirusserotypes present.
Theannualandmonthlyincidenceratesofdenguewere
cal-culatedfor themunicipality duringtheperiod fromSeptember
2005toAugust2007.Themonthlyrateswerecompared tothe
BI(numberofcontainerswithAe.aegyptiper100premises)
esti-matedmonthlyratesfortheregionofSãoJosédoRioPreto,based
onthedatarecordedintheSystemSISAWEBoftheEndemic
Con-trolSuperintendence.Wecalculated,fortheannualperiodsfrom
September2005toAugust2006andSeptember2006toAugust
2007,thePearsoncorrelationcoefficients betweenthemonthly
incidencesandBI,laggedtwoandthreemonthsinrelationtothe
rates,builtscatterplotsandfittedLOESScurves.
Ageo-codification ofdengue cases wasperformedbased on
thepatients’residenceaddressesbymeansofmetric
interpola-tionusingthecartographicbaseofthestreetaxesofSãoJosédo
RioPreto.Thematicmapswerethenproducedshowingthedengue
incidencerateinthemunicipalityaccordingtoitsurbancensus
tracts,andthecasesforwhichtheserotypeswereidentifiedwere
mappedfortheperiodfromSeptember2005toAugust2007.
Anevaluationoftherelationshipbetweendengueand
ento-mologicalindicatorswasperformedintheJaguaréneighborhood,
which is located on the northern zone of the city (Fig. 1B).
Thisneighborhoodhasapproximately37,000inhabitants,
approx-imately11,000propertiesandanareaof397.5ha.Thecriteriafor
selectionwere:thehighestlevelsofinfestationofAe.aegyptiin
relationtotheotherneighborhoods,ahighincidenceofdengue,
thepresenceofresidentswithdifferentsocioeconomicstatuses,
andresidentialandnon-residentialproperties.
AnentomologicalsurveywasconductedintheJaguaré
neigh-borhoodbetweenDecember2006andFebruary2007.Thisperiod
waschosenbecausethesemonthsarethemostfavorablemonths
forthedevelopmentofthevectorinthisregionandincludean
infestationpeak (Barbosaet al.,2010).Inthissurvey, ateamof
fieldresearcherswerecontractedforthisactivityandaccordingly
trained;theyvisitedallofthepropertiesintheneighborhoodand
collectedalloftheobservedlarvaeduringthe3rdand4thstages
andallofthepupaeincontainerswiththepresenceofculicids.The
collectedspecimenswereidentifiedandquantified.Tominimize
thenumber ofpropertiesthatcouldnotbeinspected,thevisits
wereperformedduringtheworkingdaysoftheweekuntil7pm
andonSaturdays.Othervisitswereperformedtotargetproperties
thatwerenotinspectedduringthefirstvisit.Moredetailsabout
thissurveyareprovidedbyFavaroetal.(2013).
TheentomologicalindicatorsconsideredforAe.aegyptiincluded
twoindicescalculatedperproperty(theBIandthenumberofpupae
perproperty)andtwoindicescalculatedbyarea(thenumberof
containerswithimmatureformsperhectareandthenumberof
pupaeperhectare).Thepropertyareasinhectareswereobtained
F.Chiaravalloti-Netoetal./ActaTropica142(2015)167–177 169
Fig.1.(A)MunicipalityofSãoJosédoRioPreto,stateofSãoPaulo,Brazil.(B)JaguaréneighborhoodandurbanperimeterofSãoJosédoRioPreto.
Theseindicatorswerecalculatedforthewholeneighborhoodand
byblocks(blockswithlessthanfivepropertiesweregroupedwith
adjacentblocks).Inaddition,thenumberofpupaeperinhabitant
wasestimatedfortheentireneighborhood.
Basedontheentomologicalindicatorscalculatedperblock,
the-maticmapswerebuilttovisualize theirspatialdistributions in
theJaguaréneighborhood.Weassumedthatthecentroidsofthe
geometricrepresentationsof theblocks couldbeconsideredas
representativesofpolygonobjectsand,therefore,assamplesofa
continuousgeographicphenomenoninphysicalspacethatcould
beusedtomodelastochasticGaussianpunctualprocess(Bailey
andGatrell,1995).
Theordinarykrigingmethodwasusedtoobtainamathematical
modelandtoconstructthematicmapsbasedonstatistical
inter-polationusingthemethodofgeneralizedweightedleastsquares
estimation,withtheweightsdefinedbythesemi-variancefunction
(semivariogram).Theisotropicsemivariogramwasdefinedwith
asphericalfunctionwiththeparametersnugget,contributionand
amplitude.WeusedthepackagegeoRfromtheprogramRversion
3.0.2toperformthestatisticalinterpolation(RibeiroandDiggle,
2001).
RegardingdenguecasesintheJaguaréneighborhood,we
con-sideredjusttheonesthatoccurredbetweenJanuaryandMay2006
and2007.Thesebothtimeperiodsrepresentedmorethan90%of
thetotalnumberofcasesrecordedduringthesetwoyearsandthey
includethepeaksofincidenceandvectorinfestation.Injustifying
theinclusionofthe2006periodintheanalysisoftherelationship
betweenentomologicindicatoranddengueoccurrence,we
con-sideredthattheinfestationpatternsduringthesummersof2005/6
and 2006/7 didnot have expressive variations; there were no
atypicalclimaticvariations,noalterationsofthecontrolactivities
developedand nostructuralalterations intheneighborhood.In
addition,thiscomparisonwasopportunisticbecausetheepidemic
thatoccurredin2006exposedthecompletelysusceptible
popu-lationtotherecentlyintroducedserotypeDENV3(Mondinietal.,
2009).
Torepresenttheautochthonouscasesofdenguethatoccurred
intheJaguaréneighborhoodin2006and2007,weusedtheKernel
ratio obtainedfromthedivision of theKernel function applied
tothesitesofdengueoccurrencebytheresultoftheapplication
ofthisfunctiontothecentroidsofthelotscorrespondingtothe
residencesintheneighborhood,weightedbythenumberof
inhab-itantsper residence(Câmara and Carvalho, 2004).Thisprocess
generated measurements that corresponded to the incidence
rates.Theserateswerepresentedinthematicmapsaccordingto
quintiles.
We used a generalized additive model (GAM), in a
spa-tialcase–controldesigned,toevaluatetherelationshipbetween
dengueandentomologicalmeasures(HastieandTibshirani,1986).
The autochthonous dengue cases were considered the cases
themselvesandthecontrolstorepresenttheinhabitantsof the
neighborhood(thesourcepopulationofthedenguecases)were
generatedrandomly,inaproportionof1:1withthecases.We
cal-culatedtheamountofcontrolsfor eachcensustract,weighting
byitspopulation.ArcGIS10.2softwarewasusedtogeneratethe
randomspatialdistributionofthecontrols.Valuesofthe
entomo-logicalmeasuresforeachcaseandeachcontrolwereobtainedusing
themaps ofthe entomologicalindicators generatedby kriging,
consideringthegeographicalcoordinatesofthecasesandcontrols
(Barbosaetal.,2014).
TheGAMwereadjustedconsideringtheoccurrenceofdengue
(January toMay of 2006and of 2007) and each entomological
indexasapossibleexplanatoryvariable(e.g.,webuiltamodelfor
eachstudyperiodandeachentomologicalindex).Thegeographic
coordinatesofthecasesandcontrolswereusedasthespatial
com-ponentofthemodels.Itwasconsideredassmoothingfunctions
ofthecoordinateswithabandwidthof100mrepresenting,in
thissituation,themeanflightradiousofAe.aegypti(Barbosaetal.,
2014;HastieandTibshirani,1986).Theentomologicalmeasures
werescaled(usingtheirmeansandstandarddeviations)allowing
tocomparewiththeresultsofthemodels.Weusedthesoftware
Rversion3.0.2 withthe epigamlibrary toadjust thesemodels
(Barbosaetal.,2014).
ThisstudywasapprovedbytheEthicalReviewBoardofthe
FaculdadedeMedicinadeSãoJosédoRioPreto.
3. Results
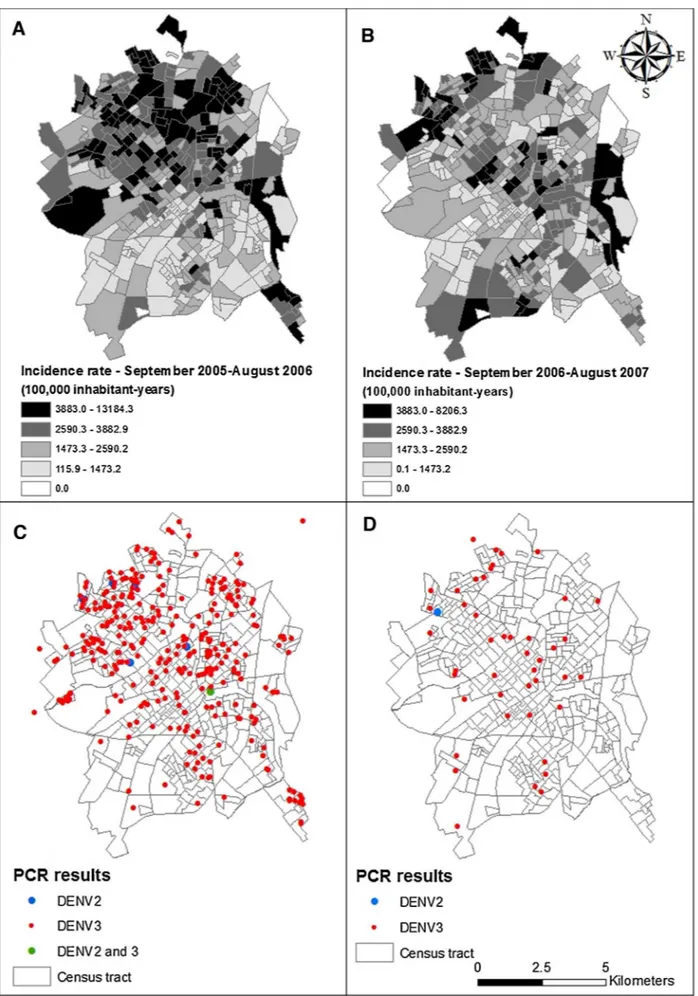
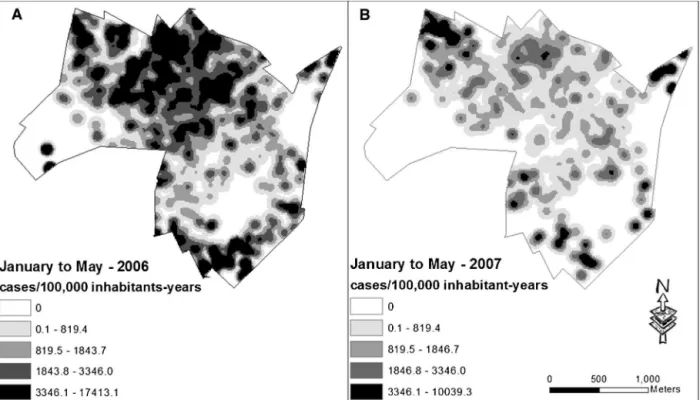
TheincidenceratesofdenguefeverinSãoJosédoRioPretofor
theannualperiodsfromSeptember2005toAugust2006(2005/6)
andSeptember2006toAugust2007(2006/7)were3014.6and
2370.1casesper 100,000inhabitant-years, respectively(12,526
autochthonouscasesin2005/6and10,051in2006/7).Fig.2Aand
Bshowstheseratesaccordingtotheurbancensussectorsandin
quintiles,in whichwenotedthatthepresenceofheterogeneity
variedbetween0and13,184.3casesper100,000inhabitant-years
duringthefirstyearandbetween0and8206.3duringthesecond
year.
Regardingthecharacterizationofthecirculatingserotypes,in
2005/6,theviralserotypespresentwereidentifiedbyPCRin336of
718serumsamples,ofwhich331containedDENV3,fourcontained
DENV2,andonecontainedbothoftheseserotypes.In2006/7,94
sampleswereprocessed,ofwhich46werepositivelyidentified:
45asDENV3andoneasDENV2.Thedenguecasesforwhichthe
viralserotypewasidentifiedforthetwoannualperiodsanalyzed
areshowninFig.2CandD,respectively.
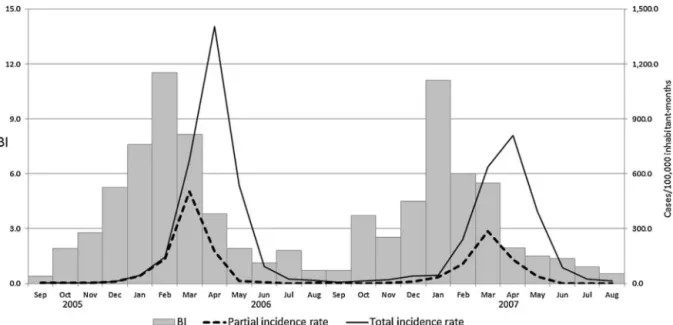
Fig. 3 shows the partial monthly incidence rate (including
only the dengue cases confirmed by either serological testing
orRT-PCR)and thetotal monthlyincidencerate(including the
denguecasesconfirmedbyserologicaltesting,RT-PCRandbythe
clinical–epidemiologic criterion). During 2005/6, the total
inci-denceratewasalmostequaltothepartialincidenceratesuntil
March,and,inthenextyearperiod,betweenJanuaryandMarchof
2007,approximatelyhalfoftheconfirmeddenguecaseswere
con-firmedbyeitherserologicaltestingorRT-PCR.Theincidencerates
weregreaterin2005/6thanin2006/7,althoughshowedsimilar
behaviorduringthetwoannualperiodsstudied.Moreover,both
demonstratedincidencepeaksinAprilandconcentrationsofmore
than90%ofthecasesbetweenJanuaryandMay.
Fig.3alsopresentsthemonthlyBIbetweenSeptember2005
andAugust2007fortheregionofSãoJosédoRioPreto;wenoted
similarinfestationlevelsandseasonalpatternsinthetwoyears,
withhighervaluesbetweenDecemberandMarch.Acomparisonof
thetwocurvesshowedthattheincidencefollowedtheinfestation
curve,withtheinfestationpeaksprecedingtheincidencepeaks
bytwotothreemonths.Thehighestcorrelationcoefficients,for
bothannualperiods,wereobtainedwhenwelaggedtheBIfortwo
monthandtheirvalueswere0.94(p=0.000)and0.84(p=0.001),
respectively,for2005/6and2006/7.ThescatterplotsandtheLOESS
curveswerebetterfittedforthefirstannualperiodcomparedtothe
second(Fig.4).
IntheJaguaréneighborhood,1528and563autochthonouscases
ofdenguefeverwererecordedfortheperiods2005/6and2006/7,
respectively,ofwhich96.2%and90.9%ofcasesoccurredbetween
JanuaryandMay.Fig.5AandBshowstheincidenceratesresulting
fromtheKernelratiointhatperiodforthetwoyearsstudied,and
wenotethedisseminationofthediseasethroughouttheentire
neighborhood,withhighervaluesin2006.
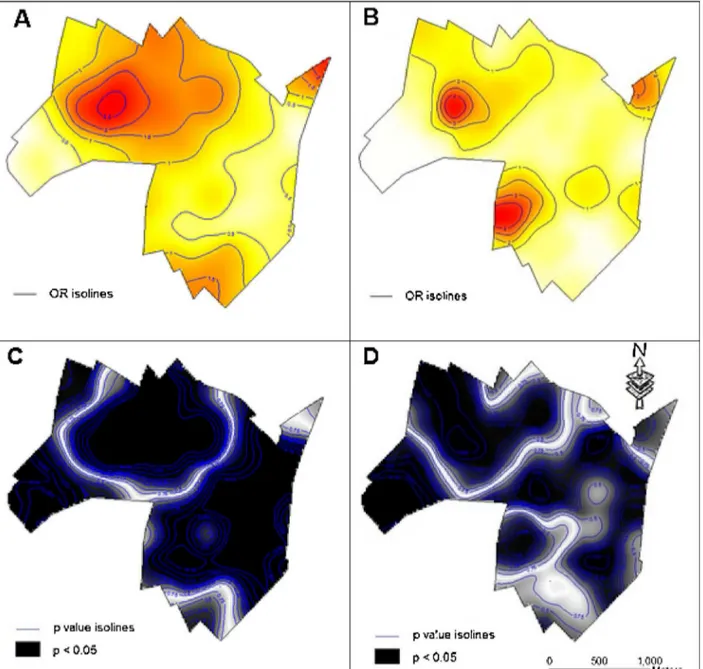
Fig.6AandBshowsthespatialriskmapswiththeoddsratio(OR)
isolinesfordengueandFig.6CandDshowstherespectivepvalue
mapsfor2006and2007,asaresultofapplyingGAMconsidering
onlythespatialdistributionofthecasesandcontrols.Theareas
withORover1andsignificantarebroaderin2006thanin2007,
withisinagreementwiththeincidenceratemapspresentedin
Fig.5AandB.
IntheentomologicalsurveyperformedintheJaguaré
neighbor-hood,9875propertieswereinspected(89.8%oftheneighborhood’s
properties).Totalsof36,119larvaeand4178pupaeofAe.aegypti
werefoundin1051propertiesand1867containers.Thelarvaeand
pupaewerefound,respectively,in1015and442propertiesand
in1788and647containers.Thefollowingentomological
indica-torsofAe.aegyptiwereobtainedintheJaguaréneighborhood:18.9
containerswithimmatureformsper100properties(BI)and0.42
pupaeperproperty,5.2containerswithimmatureformsand11.6
pupaeperhectare,and0.07containerswithimmatureformsand
0.15pupaeperinhabitant.
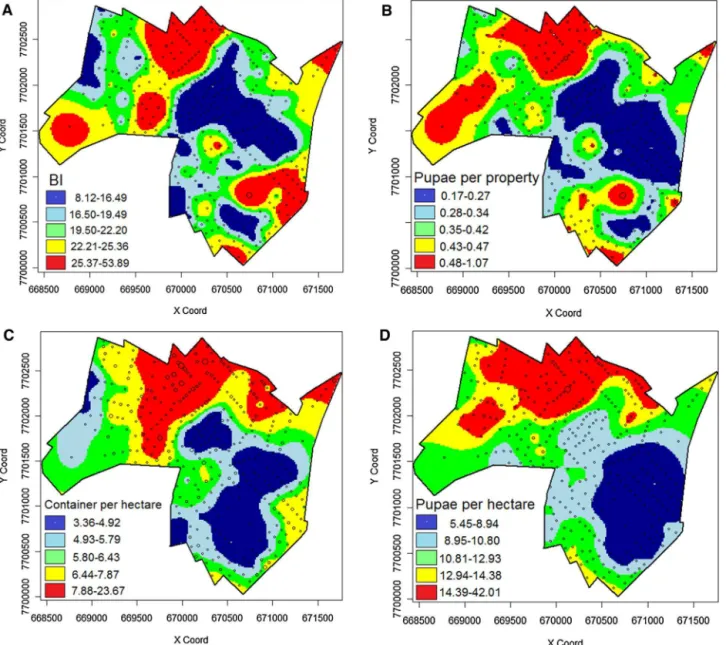
Fig.7showsthemapsoftheentomologicalindicatorsobtained
bykrigingbasedontheinformationaggregatedbyblocks.TheBI
andthenumberofpupaeofAe.aegyptiperpropertyareshownin
Fig.7AandB,andthenumberofcontainersharboringAe.aegyptiper
hectareandthenumberofAe.aegyptipupaeperhectareareshown
inFig.7CandD.Bothindicatorscalculatedperpropertyshowed
thesamepattern, which alsooccurredfor theindicators
calcu-latedperhectare.However,thecomparisonbetweentheindicators
calculatedperpropertyandthosecalculatedperhectarerevealed
differences,especiallyinthesouthernandwesternregionsofthe
Jaguaréneighborhood:alowinfestationbasedontheindicators
calculatedperhectareandahighinfestationbasedontheindicators
calculatedperproperty(Fig.7).
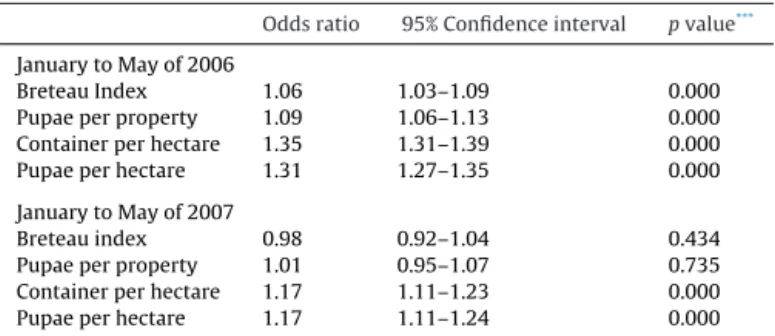
Table1presentsthemodelsshowingtherelationshipbetween
occurrenceof dengue,for bothstudyperiods,and foreach one
oftheentomologicalindicatorsevaluated,adjustedforthespatial
distributionofthecasesandcontrols.In2006,allentomological
indicatorswereconsideredriskfactorstotheoccurrenceofdengue
(OR>1andsignificant),howeverthosecalculatedperhectare
pre-sentedhighervaluesofORthantheindicesperproperty.In2007,
onlytheindicescalculatedperhectarewereconsideredriskfactors
fortheoccurrenceofdengue,neverthelesswithlowervaluesthan
in2006.Indicatorscalculatedperhectareshowed,inbothstudy
periods,tobebetterpredictorsoftheoccurrenceofthediseasethan
thosecalculatedperproperty,furthermore,theydemonstratedto
haveasimilarpredictionpower.
Theresultspresentedaboveareinconsonancewiththe
entomo-logicalindexmaps(Fig.7A–D),theincidenceratemaps(Fig.5Aand
Table1
Dengueriskestimatedmodels*foreachoneofthescaled**entomologicalindices evaluated,adjustedforthespatialdistributionofthecasesandcontrols,Jaguaré neighborhood,municipalityofSãoJosédoRioPreto,stateofSãoPaulo,Brazil.
Oddsratio 95%Confidenceinterval pvalue***
JanuarytoMayof2006
BreteauIndex 1.06 1.03–1.09 0.000
Pupaeperproperty 1.09 1.06–1.13 0.000 Containerperhectare 1.35 1.31–1.39 0.000
Pupaeperhectare 1.31 1.27–1.35 0.000
JanuarytoMayof2007
Breteauindex 0.98 0.92–1.04 0.434
Pupaeperproperty 1.01 0.95–1.07 0.735 Containerperhectare 1.17 1.11–1.23 0.000
Pupaeperhectare 1.17 1.11–1.24 0.000
F.Chiaravalloti-Netoetal./ActaTropica142(2015)167–177 171
Fig.3.Partialandtotalmonthlyincidenceratesofdengue,municipalityofSãoJosédoRioPreto,andmonthlyBreteauindices(BI),regionofSãoJosédoRioPreto,September 2005toAugust2007,stateofSãoPaulo,Brazil.
B)andthespatialriskmaps(Fig.6AandB).Itcanbeseenthatthe
indicesperhectare,inbothperiods,hadahigherdegreeof
concord-ancewithdenguethanthosecalculatedperproperty.Inaddition,
itisworthnotingthatthedegreeofconcordanceforindicesper
hectarewithdenguewashigherin2006thanin2007,whichisin
accordancewiththelowervaluesofORobtainedin2007.
4. Discussion
AccordingtoTeixeiraetal.(2005),thedenguefeverepidemics
inBrazilhaveoccurredaftertheintroductionorreintroductionof
certainvirusserotypeswhenahighproportionofsusceptible
indi-vidualsexistsinthepopulation.Thispatterncouldbeverifiedin
SãoJosédoRioPreto,wheretheresultsobtainedthroughPCR
sug-gestedthatalmostallofthecasescouldbeattributedtoDENV3,a
viruswhoseintroductionoccurredin2005(Mondinietal.,2009).In
additiontothehighdegreeofsusceptibilityofthepopulation,this
scenariogeneratedhighincidencesofdenguefeverin2005/6and
2006/7,withcasesthroughouttheurbanareaofthemunicipality.
Tocomparetheentomologicalindicatorsandtheincidenceof
denguefeverinagivenneighborhood,itwouldbeidealtoperform
entomologicmeasuresinaperiodwhenthedenguefever
trans-missionoccurredinacompletelysusceptiblepopulation(Mondini
etal.,2009).Inthisstudy,thecomparisonperformedbetweenthe
indicatorsmeasuredinDecember2006toFebruary2007andthe
incidencesofdenguefeverin2007hadthedisadvantageofpartof
thepopulationintheneighborhoodhavingbeenimmunized
dur-ingthepreviousperiodbytheserotypeDENV3.Thisimmunization
alteredthepotentialoftheindicatorsofinfestationtoestimate
thetransmissionrisk ofdenguefeverbecausefurther
transmis-sionnowalsodepended,amongotherfactors,ontheproportionof
F.Chiaravalloti-Netoetal./ActaTropica142(2015)167–177 173
Fig.5.IncidenceratesofdenguefromJanuarytoMayof2006(A),andfromJanuarytoMayof2007(B),Jaguaréneighborhood,municipalityofSãoJosédoRioPreto,stateof SãoPaulo,Brazil.
thepopulationsusceptibletoDENV3.Manyauthorsnotethatthe
entomologicalthresholdforthetransmissionofdenguedepends,
amongotherfactors,ontheimmunologicstatusofthepopulation
(Focks,2003;Focksetal.,2000;Ghouthetal.,2012;Halstead,2000; Morrisonetal.,2008).
Thedecisiontouseentomologicmeasuresobtainedinthe
sum-mer2006/7tocomparewiththeincidenceratesofdenguefeverin
both2006and2007intheJaguaréneighborhoodwasbasedon
thepatternof infestationobserved between2005and 2007for
theregionofSãoJosédoRioPreto,whichshowedthesame
sea-sonalbehaviorandsimilarlevelsofinfestation,aswasnotedinthe
methodology.
Regardingthecapacityoftheentomologicalindicatorsto
indi-catethespatialriskofdengueoccurrencein2006and2007,both
indicatorscalculatedperhectareshowedbetterresultsthanthose
calculatedperproperty,throughoutthoseperiods.Moreover,the
entomologicalindicatorsbasedonthenumberofcontainerswith
Ae.aegyptiandonthenumberofpupaeidentifiedsimilarpatterns
ofinfestation,andthelatterdidnotprovideadditionalinformation
inrelationtothefindingsprovidedbytheclassicindicators.
For authorssuchas Focks(2003), Focksand Chadee(1997),
andNathanandFocks(2006),theindicatorsbasedoncontainer
positivitywouldhaveweakrelationshipswiththeriskofdengue
occurrence, while theindicators based onpupae quantification
wouldbemoreadequatetoestimatethatrisk.However,inthis
study,themaindifferenceregardingthecapacityofthe
entomo-logicalindicatorstoindicatespatialdengueriskwasnotrelated
totheuseofpupaequantificationbuttotheapplicationof
indi-catorscalculatedperhectare.Bothoftheindicatorscalculatedper
hectare,notonlytheonebasedonthequantificationofpupae,were
inagreementwiththedengueriskmaps.
Thisresultisinagreementwiththeargumentsputforwardby
severalauthorswho noted thatindices calculated byareamay
bemore appropriatemeasuresfor assessing theriskof dengue
(Barreraetal.,2006;Focks,2003;Focksetal.,1993,2000;Focks andChadee,1997;Getisetal.,2003;Morrisonetal.,2004;Nathan andFocks,2006;Romero-VivasandFalconar,2005).
Oneexplanationforthedifferencesfoundbetweenthe
indica-torscalculatedperpropertyandthosecalculatedperhectarewas
thepresence ofpropertiessuchasschools, churches,clubsand
parks withlargeareasin theJaguaréneighborhood;becauseof
thoselargeareas,therewasahigherprobabilityofhosting
con-tainerswithimmatureformsofAe.aegypticomparedtosmaller
properties.Usingthoselargeareastocalculateindicesper
prop-erty ledto artificialincreases in those values compared to the
indicescalculatedperhectare(Favaroetal.,2013).Theindicators
calculatedperpropertymighthavesimilarperformancetothose
calculatedperhectareinareaswherethepropertieshad
homo-geneoussizes,butthishomogeneityisnotacommonsituationin
intermediate-sizeandlargemunicipalitiesinBrazil.
Therefore,inSãoJosédoRioPretoandinotherBraziliancities
withsimilarcharacteristics,changingthecalculationof
entomo-logicalindicesbysubstitutingthenumberofpropertieswiththeir
areascouldprovidetheseindiceswithagreatercapacityto
pre-dictthespatialriskofdenguefeveroccurrence.Eventhen,theuse
oftheseindicatorsisrestrictedbecausetheindicatorsshouldnot
beconsideredalone.Theindicatorsmake senseonlyiftheyare
analyzedwithothervariables relatedtothedynamicsof
trans-mission,suchasthedegreeofimmunityofthepopulationforthe
differentserotypesofthedenguevirus;theserotypes,genotypes
andcirculatingclades;vectorbehavior;andweather,
environmen-talandsocioeconomiccharacteristics(Drumondetal.,2013,2012;
Focksetal.,1995;Ghouthetal.,2012;Kuno,1977;Leeetal.,2012; Morrisonetal.,2008;Teixeiraetal.,2005;Yamanakaetal.,2011).
Eventhoughtheindices calculatedforpropertyhaveproved
worsepredictorsofthespatialriskofoccurrenceofdenguethan
thosecalculatedperhectare,BI,laggedtwomonths,wasagood
predictoroftemporalriskofdengue,asanotherstudyconducted
intheregionofSãoJosédoRioPretohadalreadyshown(Diboetal.,
2008).
The degree interference of immunity in the relationship
betweenentomologicalindicesanddenguebecameevidentinthis
study,sinceitwasfoundhigherORvaluesfor2006than2007,in
Fig.6.Spatialriskmapfordenguewithoddsratio(OR)fromJanuarytoMayof2006(A)andfromJanuarytoMayof2007(C)andpvaluemapforthefirstperiod(C)andfor thesecondperiod(D),Jaguaréneighborhood,municipalityofSãoJosédoRioPreto,stateofSãoPaulo,Brazil.
entirecityin2005/6thanin2006/7.Thesediscrepanciesare
proba-blyduetothehigherdegreeofimmunityagainstDENV3in2006/7
thanin2005/6.Ghouthet al.(2012)andMorrisonetal.(2008)
pointedoutthedecreaseintheentomologicalindicator’saccuracy
topinpointdengueriskwouldbeexpectedinpartiallyimmunized
areas.
AccordingtotheresultsofthisworkandoftheworkofNi ˜no
(2008),theuseofgeostatisticaltechniques,suchassemivariograms
andkriging,toestimatethevaluesofentomologicalindicatorsin
ageographicareaallowsfortheidentificationofsiteswithgreater
infestationbyAe.aegyptiwithoutbeingrestrictedtoregionswhere
anoutlinehasbeenpreviouslyestablished.TheuseofGIStogether
withspatialanalysesalsoallowsfortheassessmentofthe
relation-shipbetweendengueandtheentomologicalindicators,whichwas
observedinboththisstudyandthestudybySanchézetal.(2010,
2006).
However,toconductstudiesidentifyingareaswithhigher
prob-abilitiesof theoccurrence of diseaseor ofAe. aegypti withthe
goalofassessingtherelationshipbetweendengue,riskfactors,and
measuresforvectorcontrolandtoidentifyandselectpriorityareas
forvector-controlactivities(Eisenetal.,2009;Resendesetal.,2010;
Thaietal.,2010),itisnecessarytohavegeo-referencedmapsofthe
assessmentunitsofthesitesstudied,whichispresentlyenabled
by the use of increasingly user-friendly GIS and by the
avail-ability of geo-referenced databases (Eisen and Lozano-Fuentes,
2009).
Anotheraspecttobeconsideredin thediscussionaboutthe
relationship between entomological indicators and the risk of
dengue is thelevel of vectorinfestation. São José do Rio Preto
showedlowerlevelsofinfestation(Barbosaetal.,2010;Ferreira
andChiaravalloti-Neto,2007)thansitesusedinstudiesinwhich
otherindicatorsbasedonpupaequantificationwerebetter
pre-dictors of dengue occurrence (Barbazan et al., 2008; Barrera
et al., 2006; Focks, 2003). The lower levels of infestation are
related to the almostuniversal and adequatewater provisions
and collectionof solid residuesand thelow frequency of large
water-holdingcontainers(Favaroetal.,2013)thatresultfromthe
F.Chiaravalloti-Netoetal./ActaTropica142(2015)167–177 175
Fig.7. BreteauIndex(BI)(A),numberofAe.aegyptipupaeperproperty(B),numberofcontainersharboringAe.aegyptilarvaeandpupaeperhectare(C),andnumberofAe. aegyptipupaeperhectare(D)intheJaguaréneighborhood,municipalityofSãoJosédoRioPreto,stateofSãoPaulo,Brazil,fromDecember2006toFebruary2007.
intermissioninthewatersupply.Despitethelowlevelsof
vec-torinfestation,denguehasendemicbehaviorinthemunicipality
(Mondinietal.,2005)withtheoccurrenceofepidemicpeaks(CVE, 2014).
Inadditiontothelackofdifferencesamongindicesbasedon
pupae quantification and container positivity, theuse of
ento-mological indicators that employ pupae quantification in cities
withcharacteristics suchas theones foundin São José do Rio
Preto would require sampling plans that use a larger
num-berof propertiesthan thesamplingplansusedtomeasurethe
indices based on container quantification, as finding
contain-ers with pupae can be considered a rare event (Favaro et al.,
2013).
Thepotentiallimitationsofthepresentstudyincludetheuse
entomologicalindicatorsthatweremeasuredforthesummerof
2006/7,inJaguaré,toberelatedwithdengueoccurrenceinboth
studyperiods;theuseofthedenguecasesthatwerenotifiedtothe
surveillancesystem,whichisknowntonotincludealloccurrences;
theconsiderationofthepatient’sresidenceastheprobablesiteof
infection;andtheuseoftheclinical–epidemiologicalcriterionto
confirmsomeofthedenguecases.However,atthetime ofthis
outbreak,theclinical–epidemiologicalcriterionwasofficiallyused
bythegovernmenttoquantifydenguecases.Asawaytoaddmore
concretedata,wealsousedPCRtoconfirmdenguecasesinour
analysis.
Despitetheselimitations,someofthepositivecharacteristicsof
thisstudyincludetheperformedanalyses,suchasthe
accomplish-mentof viraldiagnosticsusingtechniquesofmolecularbiology
onsamplesfrom patientswithsuspecteddengue;thescopeof
thesurveillancesystemofSãoJosédoRioPreto,whichincludes
unitswithprimary,secondaryandtertiarypublicandprivatecare
andisdistributedthroughoutthemunicipality;andthe
achieve-ment of conducting the entomological survey through the use
of a census format and not by sampling. Even the use of the
clinical–epidemiologicalcriteriontoconfirmdenguecasescould
beminimizedasapotentialbiasbecauseinepidemicsituations
(highprevalence),thepositivepredictivevalueofthistypeoftest
couldbeconsideredhigh.
Anaspecttobehighlightedwasthefactthatthemunicipality’s
populationhadahighsusceptibilitytotheDENV3serotypebefore
theperiodofdevelopmentofthisresearchandthealmost
com-pletepredominanceoftheoccurrenceofthis serotypebetween
2005and 2007,which facilitated theanalysisof the
theentomologicalindicators.Suchaspectaddingtheextentand
quality of theentomological survey and the plausibility of the
resultscaninpartminimizethecitedlimitations.
5. Conclusions
It is possible to conclude that, in the study neighborhood
(Jaguaré),theentomologicalindicescalculatedbyhectarewere
bet-terpredictorsofthespatialdistributionofdenguethantheindices
calculatedbyproperty,andthepupaequantificationdidnotexhibit
betterpredictionqualitiesthantheindicesbasedonthecontainer
positivity,inrelationtothespatialriskofdengueoccurrence.We
alsoconcludedthattheBI,laggedtwomonths,wasagood
predic-torofthetemporaldistributionofdengueinthecityofSãoJosédo
RioPreto.Evenwiththepopulationpartiallyimmunizedin2007,it
waspossibletofindassociationbetweenhigherinfestationlevels
andanincreasedriskofdengue.
Acknowledgments
ToMarlene CG Souza,EdmilsonRodrigues deOliveira,Célio
Vamberto,NivaldoFirminodaSilva,FernandoRobertodeOliveira
and Cícero Alves da Silva for their assistance with the field
work;toBeatrizACBelini,NeuzaFASantanaandPerpétuaMM
Sereno of the Laboratorio de Vetores of Superintendência de
Controle de Endemias for their assistance with the laboratory
work.
ToFundac¸ão deAmparo àPesquisado Estado deSão Paulo
(FAPESP) for the grants that supported this work (Process no.
2005/02800-8andProcessno.2006/02473-0).
References
Arredondo-Jimenez, J.I., Delgado-Valdez, K.M., 2006. Aedes aegypti pupal/demographic surveys in southern México: consistency and practi-cality. Ann. Trop. Med. Parasitol. 100, 17–32, http://dx.doi.org/10.1179/ 136485906X105480.
Bailey,T.C.,Gatrell,A.C.,1995.InteractiveSpatialDataAnalysis.PrenticeHall, Har-low.
Barbazan, P., Tuntaprasart, W., Souris, M., Demoraes, F., Nitatpattana, N., Boonyuan, W.,Gonzalez, J.P., 2008. Assessmentof a newstrategy, based onAedesaegypti(L.)pupalproductivity,forthesurveillanceandcontrolof denguetransmissioninThailand.Ann.Trop.Med.Parasitol.102,161–171, http://dx.doi.org/10.1179/136485908X252296.
Barbosa,A.A.C.,Fávaro,E.A.,Mondini,A.,Dibo,M.R.,Chiaravalloti-Neto,F.,2010. Evaluationof oviposition traps as an entomological surveillance method for Aedes aegypti (Diptera, Culicidae). Rev. Bras. Entomol. 54, 328–331, http://dx.doi.org/10.1590/S0085-56262010000200017.
Barbosa,G.L.,Donalísio,M.R.,Stephan,C.,Lourenc¸o,R.W.,Andrade,V.R.,Arduino, M.B.,Lima,V.L.C.,2014.Spatialdistributionoftheriskofdengueandthe ento-mologicalindicatorsinSumaré,StateofSãoPaulo,Brazil.PLoSNegl.Trop.Dis. 8,e2873,http://dx.doi.org/10.1371/journal.pntd.0002873.
Barrera,R.,Amador,M.,Clark,G.G.,2006.Useofthepupalsurveytechniquefor mea-suringAedesaegypti(Diptera:Culicidae)productivityinPuertoRico.Am.J.Trop. Med.Hyg.74,290–302,http://dx.doi.org/10.1590/S1020-49892000000900001. Barrera,R.,Delgado,N.,Jiménez,M.,Villalobos,I.,Romero,I.,2000.Estratificaciónde umaciudadhiperendémicaemdenguehemorrágico.Rev.Panam.SaludPublica 8,225–233.
Bhatt, S., Gething, P.W., Brady, O.J., Messina, J.P., Farlow, A.W., Moyes, C.L., Drake,J.M.,Browntein,J.S.,Hoen,A.G.,Sankoh,O.,Myers,M.F.,George,D.B., Jaenisch,T., Wint, G.R.W.,Simmons,C.P., Scott,T.W., Farrar,J.J., Hay, S.I., 2013.Theglobaldistributionandburdenofdengue.Nature496,504–507, http://dx.doi.org/10.1038/nature12060.
Bronzoni,R.V.,Baleotti,F.G.,Nogueira,R.M.R.,Nunes,M.,Figueiredo,L.T.M.,2005. Duplexreversetranscription-PCRfollowedbynestedPCRassaysfordetection andidentificationofBrazilianalphavirusesandflaviviruses.J.Clin.Microbiol. 43,696–702,http://dx.doi.org/10.1128/JCM.43.2.948-950.2005.
Câmara,G.,Carvalho,M.S.,2004.AnáliseEspacialdeEventos.In:Druck,S.,Caravalho, M.S.,Câmara,G.,Monteiro,A.M.V.(Eds.),AnáliseEspacialdeDadosGeográficos. Embrapa,Planaltina,pp.53–76.
CVE–CentrodeVigilânciaEpidemiológica ProfessorAlexandreVranjac,2014. SecretariadeSaúdedoEstadodeSãoPaulo.Dengue.Dadosestatísticos.São Paulo,Availablefrom:http://www.cve.saude.sp.gov.br/htm/cvedengue.html (accessed7.02.14).
Dibo, M.R., Chierotti, A.P., Ferrari, M.S., Mendonc¸a, A.L., Chiaravalloti-Neto, F., 2008. Study of the relationship between Aedes (Stegomyia)
aegypti egg and adult densities, dengue fever and climate in Miras-sol, state of São Paulo, Brazil. Mem. Inst. Oswaldo Cruz 103, 554–560, http://dx.doi.org/10.1590/S0074-02762008000600008.
Drumond,B.P.,Mondini,A.,Schmidt,D.J.,Bosch,I.,Nogueira,M.L.,2012. Pop-ulation dynamics of DENV-1 genotype V in Brazil is characterized by co-circulationandstrain/lineagereplacement.Arch.Virol.157,2061–2073, http://dx.doi.org/10.1007/s0075-012-1393-9.
Drumond,B.P.,Mondini,A.,Schmidt,D.J.,Bronzoni,R.V.M.,Bosch,I.,Nogueira, M.L., 2013. Circulation of differentlineages of dengue virus2, genotype American/AsianinBrazil:dynamicsandmolecular andphylogenetic char-acterization. PLoS ONE 8, e59422, http://dx.doi.org/10.1371/journal.pone. 0059422.
Eisen,L.,Beaty,B.J.,Morrison, A.C.,Scott, T.W.,2009.Proactivevectorcontrol strategiesandimprovedmonitoringandevaluationpracticesfordengue pre-vention.J.Med.Entomol.46,1245–1255,http://dx.doi.org/10.1603/033.046. 0601.
Eisen,L.,Lozano-Fuentes,S.,2009.Useofmappingandspatialandspace-time mod-elingapproachesinoperationalcontrolofAedesaegyptianddengue.PLoSNegl. Trop.Dis.3,e411,http://dx.doi.org/10.1371/journal.pntd.0000411.
Favaro, E.A., Dibo, M.R., Pereira, M., Chierotti, A.P., Rodrigues-Junior, A.L., Chiaravalloti-Neto,F.,2013.Aedesaegyptientomologicalindicesinanendemic areafordengueinSaoPauloState,Brazil.Rev.SaúdePública47,588–597, http://dx.doi.org/10.1590/S0034-8910.2013047004506.
Ferreira, A.C., Chiaravalloti-Neto, 2007. Infestac¸ão da área urbana por Aedes aegyptierelac¸ãocomníveissocioeconomicos.Rev.SaúdePública41,915–922, http://dx.doi.org/10.1590/S0034-89102007000600005.
Figueiredo,R.M.,Naveca,F.G.,Bastos,M.S.,Melo,M.N.,Viana,S.S.,Mourão,M.P., Costa,C.A.,Farias,I.P.,2008.Denguevirustype4,Manaus,Brazil.Emerg.Infect. Dis.14,667–669,http://dx.doi.org/10.3201/eid1404.071185.
Focks,D.A.,2003.AReviewofEntomologicalSamplingMethodsandIndicatorsfor DengueVectors.WorldHealthOrganization,Gainsvill.
Focks,D.A.,Brenner,R.J.,Hayes,J.,Daniels,E.,2000.Transmissionthresholdsfor dengueintermsofAedesaegyptipupaeperpersonwithdiscussionoftheirutility insourcereductionefforts.Am.J.Trop.Med.Hyg.62,11–80.
Focks,D.A.,Chadee,D.D.,1997. Pupalsurvey: anepidemiologically significant surveillancemethodforAedesaegypti:anexampleusingdatafromTrinidad. Am.J.Trop.Med.Hyg.56,159–167.
Focks,D.A.,Haile,D.G.,Daniels,E.,Mount,G.A.,1993.Dynamiclifetablemodelfor Aedesaegypti(Diptera:Culicidae):analysisoftheliteratureandmodel develop-ment.J.Med.Entomol.30,1003–1017.
Focks,D.A.,Daniels,E.,Haile,D.G.,Keesling,J.E.,1995.Asimulationmodelofthe epidemiologyofurbandenguefever:literatureanalysis,modeldevelopment, preliminaryvalidation,andsamplesofsimulationresults.Am.J.Trop.Med.Hyg. 53,489–506.
Getis,A.,Morrison,A.M.Y.C.,Gray,K.,Scott,T.W.,2003.Characteristicsofthespatial patternofthedenguevector,Aedesaegypti,inIquitos,Peru.Am.J.Trop.Med. Hyg.69,494–505.
Ghouth,A.S.B.,Amarasinghe,A.,Letson,G.W.,2012.DengueOutbreakinHadramout, Yemen,2010: an epidemiological perspective.Am. J. Trop.Med.Hyg.86, 1072–1076,http://dx.doi.org/10.4269/ajtmh.2012.11-0723.
Halstead,S.B.,2000.Successesandfailuresindenguecontrol–globalexperience. DengueBull.24,60–70.
Hastie,T., Tibshirani,R.,1986. Generalizedadditivemodels.Stat.Sci. 1,297– 318.
Kuno,G.,1977.Factorsinfluencingthetransmissionofdengueviruses.In:Gubler, D.J.,Kuno,G.(Eds.),DengueandDengueHaemorrhagicFever.CABInternational, London,pp.61–87.
Lee,K.S., Lo, S.,Tan, S.S., Chua, R., Tan,L.K., Xu,H., Ng, L.C., 2012. Dengue virus surveillance in Singaporereveals high viral diversity through mul-tiple introductions and in situ evolution. Infect. Genet. Evol. 12, 77–85, http://dx.doi.org/10.1016/j.meegid.2011.10.012.
Mondini, A., Bronzoni, R.V.M., Nunes, S.H.,Chiaravalloti-Neto, F., Massad, E., Alonso,W.J., Lázzaro, E.S.M., Ferraz, A.A., Zanotto, P.M.A., Nogueira, M.L., 2009.Spatio-temporaltrackingandphylodynamicsofanurbandengue out-breakinSãoPaulo,Brazil. PLoSNegl. Trop.Dis.3,e448,http://dx.doi.org/ 10.1371/journal.pntd.0000448.
Mondini, A., Chiaravalloti-Neto, F., Sanches, M.G., Lopes, J.C.C., 2005. Análise espacial da transmissão de dengue em cidade de porte médio do inte-rior paulista. Rev. Saúde Pública 39, 444–451, http://dx.doi.org/10.1590/ S0034-89102005000300016.
Mondini, A., Chiaravalloti-Neto, F., 2008. Spatial correlation of incidence of denguewithsocioeconomic,demographicandenvironmentalvariablesina Braziliancity. Sci.TotalEnviron. 393,241–248,http://dx.doi.org/10.1016/j. scitotenv.2008.01.010.
Morrison,A.C.,Gray,K.,Getis,A.,Astete,H.,Sihuincha,M.,Focks,D.,etal.,2004. TemporalandgeographicpatternsofAedesaegypti(Diptera:Culicidae) produc-tioninIquitos,Peru.J.Med.Entomol.41,1123–1142,http://dx.doi.org/10.1603/ 0022-2585-41.6.1123.
Morrison,A.C.,Zielinski-Gutierrez,E.,Scott,T.W.,Rosenberg,R.,2008.Defining chal-lengesandproposingsolutionsforcontrolofthevirusvectorAedesaegypti.PLoS Med.5,e68,http://dx.doi.org/10.1371/journal.pmed.0050068.
Nathan,M.B.,Focks,D.A.,2006.Pupal/demographicsurveystoinformdengue-vector control.Ann.Trop.Med.Parasitol.100,1–3.
F.Chiaravalloti-Netoetal./ActaTropica142(2015)167–177 177
Resendes,A.P.C.,Silveira,N.A.P.R.,Sabroza,P.C.,Souza-SantosR,2010. Determina-tionofpriorityáreasfordenguecontrolactions.Rev.SaúdePública44,274–282, http://dx.doi.org/10.1590/S0034-89102010000200007.
RibeiroJr.,P.J.,Diggle,P.,2001.geoR:apackageforgeostatisticalanalysis.R-NEWS 1,15–18.
Rocco,I.M.,Silveira,V.R.,Maeda,A.Y.,Silva,S.J.S.,Spenassatto,C.,Bisordi,I.,Suzuki,A., 2012.Firstisolationofdengue4inthestateofSãoPaulo,Brazil,2011.Rev.Inst. Med.Trop.54,49–51,http://dx.doi.org/10.1590/S0036-46652012000100009. Romero-Vivas,C.M.,Falconar,A.K.I.,2005.Investigationofrelationshipsbetween
Aedesaegyptiegg,larvae,pupae,andadultdensityindiceswheretheirmain breedingsiteswerelocatedindoors.J.Am.Mosq.ControlAssoc.21,15–21, http://dx.doi.org/10.2987/8756-971X(2005)21[15:IORBAA]2.0.CO;2. Sanchéz,L., Cortinas, J.,Pelaez, O., Gutierrez,H., Concepción, D., Stuyft,P.V.,
2010. BreteauIndex thresholdlevels indicatingriskfor dengue transmis-sioninareaswithlowAedesinfestation.Trop.Med.Int.Health15,173–175, http://dx.doi.org/10.1111/j.1365-3156.2009.02437.x.
Sanchéz,L.,Vanlerberghe,V.,Afonso,L.,Marquetti,M.C.,Guzman,M.G.,Bisset,J., etal.,2006.Aedesaegyptilarvalindicesandriskfordengueepidemics.Emerg. Infect.Dis.12,800–806.
Teixeira,M.G.,Costa,M.C.,Barreto,M.L.,Mota,E.,2005.Dengueanddengue hem-orrhagicfeverepidemicsinBrazil:whatresearchisneededbasedontrends,
surveillance,and controlexperiences?Cad. SaúdePública 21,1307–1315, http://dx.doi.org/10.1590/S0102-311X2005000500002.
Teixeira, M.G., Siqueira-Junior,J.B., Ferreira, G.L.C., Bricks, L.,Joint, G., 2013. EpidemiologicaltrendsofdenguediseaseinBrazil(2000–2010):a system-atic literature search and analysis. PLoS Negl. Trop. Dis. 7 (12), e2520, http://dx.doi.org/10.1371/journal.pntd.0002520.
Thai,K.T.D.,Nagelkerke,N.,Phong,H.L.,Nga,T.T.T.,Giao,P.T.,Hung,L.Q.,etal., 2010. Geographical heterogeneity of denguetransmission in two villages insouthernVietnam. Epidemiol.Infect.138,585–591,http://dx.doi.org/10. 1017/S095026880999046X.
Tran,A.,Deparis,X.,Dussart,P.,Morvan,J.,Rabarison,P.,Remy,F.,etal.,2004. Denguespatialandtemporalpatterns,FrenchGuiana,2001.Emerg.Infect.Dis. 10,615–621.
Yamanaka,A.,Mulyatno,K.C.,Susilowati,H.,Hendrianto,E.,Ginting,A.P.,Sary, D.D.,Rantam,F.A.,Soegijanto,S.,Konishi,E.,2011.Displacementofthe pre-dominantdenguevirusfromtype2totype1withasubsequentgenotype shiftfromIVtoIinSurabaya,Indonesia2008–2010.PLoSONE6,e27322, http://dx.doi.org/10.1371/journal.pone.0027322.