ADAPTING THE FORCHHEIMER EQUATION FOR THE FLOW
OF AIR THROUGH WHEAT STRAW BEDS
by
Djordjije D. DODER*, Biljana M. MILJKOVI], Borivoj Lj. STEPANOV,
and Ivan K. PE[ENJANSKI
Faculty of Technical Sciences, University of Novi Sad, Novi Sad, Serbia
Original scientific paper DOI:10.2298/TSCI151005030D
The paper presents the results of an experimental investigation of air pressure drop while flowing through wheat straw beds. According to Darcy’s law, the smaller the porosity of the bed, the bigger the pressure drop. The investigation was conducted using three different porosities (or three bed densities), and for two different air flow rates. After determining porosity (which is directly measur-able), the permeability of straw could be found. For high flow velocities, such as the velocity of air flowing through a straw bale, the Forchheimer equation be-comes more relevant as a correction of Darcy’s law with inertial effects included. Otherwise, the permeability tensor depends only on the geometry of the porous medium. When permeability is established, the Forchheimer equation coefficients can be easily estimated. These results may be important for the future develop-ment of efficient biomass combustion facilities. The measuredevelop-ment methods and facility characteristics are described in more detail.
Key words: biomass combustion, air pressure drop, porosity, Forchheimer equation, wheat straw permeability
Introduction
Due to the increasing environmental concerns related to energy production, as well as the continuously increasing prices of fossil fuels, biomass is receiving growing attention as an energy resource alternative to fossil fuels.
Conventional combustion equipment is not designed for burning agricultural resi-due. It can be combusted in existing facilities with certain adaptations, or in new facilities specially designed for such purposes. However, efficient devices for agricultural waste com-bustion are still in the development phase. That is why grate-fired boilers burning agricultural residue are often associated with high emission levels and relatively poor fuel burnout. For the further development of these types of energy systems, a fuller understanding of the factors which affect the efficiency of power production is particularly important [1].
Serbia has great potential for using biomass as a primary energy resource. Solid ag-ricultural waste stands out as one of the most reliable resources, primarily because of the huge amounts and quality. Table 1 shows the amount of agricultural biomass gathered in the prov-ince of Vojvodina (northern autonomous provprov-ince of Serbia, area: 21506 km2) during the period from 2003 to 2007 [2].
_______________
*
It can be concluded that wheat straw is the most important resource because of its high annual yield and availability, so this experiment was conducted for this kind of agricultural residue. Due to the above mentioned reasons, combustion science and industry in Serbia should be focused on developing and designing wheat straw furnaces of high efficiency.
A moving grate furnace is a typical way to burn solid biomass in many combustion plants. Although there have been many improvements in the furnace design, packed bed combustion is still the most common method of biomass combustion. After ignition, a reaction front propagates from the surface of the bed down to the grate. This method results in a better combustion process than the ones with surface combustion, with total facility efficiency increased, and smaller emis-sion of CO during combustion [3, 4].
The aim of this paper, is to determine the total pressure drop, as well as the local pressure drops at different heights in the straw bed, in order to obtain a better insight into the internal air flows through porous beds and determine optimal combustion conditions, consid-ering the flow rate of theoretical air needed for combustion.
Permeability is a characteristic of porous media which affects the flow pattern and influences heat and mass transfer. Hence, the permeability and thickness of the straw bed are sufficient to describe the condition of air in the combustion area and to provide valuable data for its analysis. Due to high flowing velocities, the inertial factor cannot be neglected, so Dar-cy’s law in its classical form is not relevant in this case. The Forchheimer equation should be used instead, because it presents the corrected form of Darcy’s law, which is applicable for the flows with higher values of Reynolds number, such as the air flow through straw bales. Several papers offer very comprehensive theoretical and mathematical basis for deriving the Forchheimer equation, e. g. [5]. There is no data in the literature on the permeability of wheat straw, nor the Forchheimer viscous and inertial coefficients data, which we have determined in this paper.
A similar research was conducted in [6], for soya residue, so we used the procedure established there for determining the characteristics of wheat straw residue.
Porous media flow brief review
Mathematical models that describe flow through porous beds have their role in pre-dicting mass and energy transport through the media [5]. They are created from laws of con-servation of mass, energy and momentum with the application of thermodynamic relations. Porosity of media is defined as:
Porosity estimation is experimental. Porosity is non-dimensional [m3/m3] and has a value between 0 and 1. Formula (1) shows that porosity of media is defined as the ratio of the volume of porous space and the total volume of bed (which is a sum of the volumes of solid fractions and porous space). The relation between porosity and pressure gradient can be ex-pressed by Darcy's law. Darcy's law is the simplest (linear) relation between the superficial velocity and the pressure drop in the porous medium [7], and it states that:
Type of straw Yield [tones/year]
Growing area [ha]
Wheat 1,120,074 297,403
Barley 154,964 47,921
Oats 12,140 5,179
Rye 4,506 1,474
Soy 620,358 127,856
Permeability K is a property of porous media whose effect is taken into account by the pressure gradient term in the momentum equation. For very high velocities in porous media, inertial effects can also become significant. An inertial term added to the Darcy's equa-tion is known as Forchheimer term.
When the Reynolds number is small enough (Re < 1) [7, 8], permeability is a linear function of velocity. Darcy’s law is reliable for such cases where linear dependence may per-sist. Forchheimer term is able to account for the non-linear behavior of the pressure difference vs. velocity data. The pressure gradient is usually modeled by the Forchheimer equation [8-10]:
where K1,ij and K2,ij are second-order tensors representing permeability of the viscous and inertial term in the Forchheimer equation, respectively.
Biomass bales analysis can include assumption of isotropic case, so a simplified form of eq. (3) is used, modified to be representative of a single flow direction:
Experimental investigation
The investigation was conducted in an experimental facility located at the Faculty of Technical Sciences, University of Novi Sad, Novi Sad, Serbia.
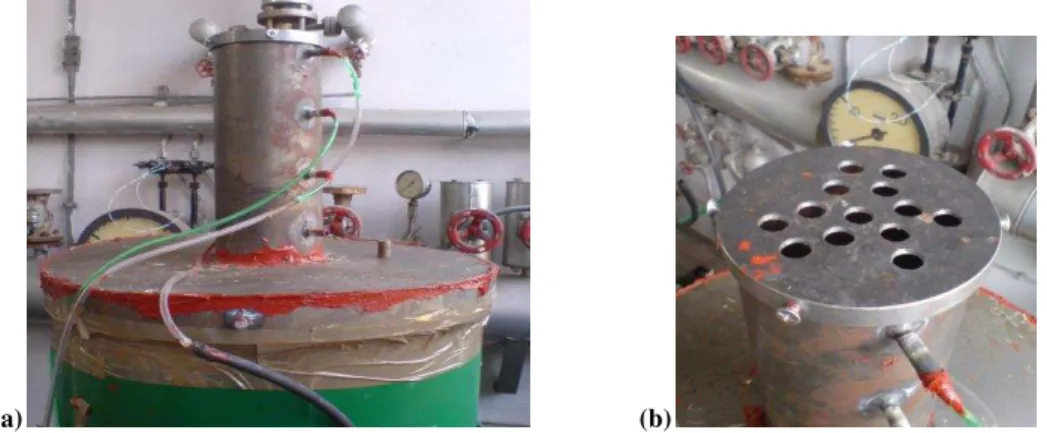
Figure 1(a) presents the working part of the investigation facility with the pressure measuring ducts. The working part consists of one vertical cylinder with three pressure meas-uring ducts. On the top of the cylinder, there is a perforated lid, which allows the release of air and holds the straw inside the cylinder. Figure 1(b) shows the cylinder lid.
(a) (b)
Figure 1. (a) Pressure measuring ducts, (b) Perforated lid
Measuring method and facility description
with liquid to the same height, the volume (or mass) of the filling liquid will be different and we can calculate porosity simply by using the ratio of these volumes. The calculated porosi-ties are 0.91, 0.82, and 0.79, for three different densiporosi-ties that were chosen according to the dimensions of the measuring vessels in the laboratory.
The gauge pressure was measured at three different heights in the bed. For this pur-pose, the classical method of U-tubes was used, so the static pressure inside the bed was cal-culated from the U-tube pressure difference read-offs.
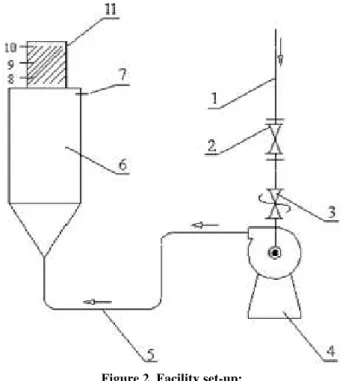
Figure 2 shows the facility setup plan. Point 1 presents the air inlet. At point 2 there is a flow measuring aperture (where the gauge pressure is also measured with U-tubes), and at point 3 there is a flow rate regulating valve. Point 4 presents an electrical centrifugal fan, and 5 is an air duct. Cylinder 6 served as a flow equalization cylinder. Point 7 is the inlet air pres-sure measuring point, and 8, 9, and 10 are other prespres-sure measuring points. After point 10 the air comes to the outlet. Point 11 presents the measuring part of the facility which is filled with straw.
The cylinder is filled with the straw of previously meas-ured porosity. After air flow is established, the pressure under the straw bed starts to increase, and pressure gradients occur. After the pressure reaches the necessary value, air will be conducted through the bed. Logically, the smaller the po-rosity, the larger the pressure gradients necessary for estab-lishing the flow, so the flow rate must be increased.
The flow rate was meas-ured using the already men-tioned aperture at point 5, by measuring the pressure differ-ences before and after the ap-pearance of aperture disturb-ance, and calculating the flow from the relevant relations.
The investigation was conducted for three different porosities, and for two air flow rates for each porosity - full and reduced flow rate (opened and half-closed valve). The calculated flow rates are 370 m3/h of air for fully open valve and 279 m3/h for half-closed valve. The ambient temperature was 20°C, so the density and viscosity of the gas were ρ = 1.205 kg/m3 and μ = 18.1·10-6 Pa∙s.
Results analysis
The experimental results are presented in the foregoing diagrams. Figure 3 contains all the measured data that served for developing all other dependences and relations. More
Figure 2. Facility set-up:
precisely, fig. 3 shows the pressure drops vs. the straw layer height lines. Each of the six lines presents individual pressure drops for one value of flow rate and one porosity value. The lines with square, x and circle markers present the total pressure drop for the porosities of 0.91, 0.82, and 0.79, respectively, (without the release point which is at atmospheric pressure). It can be noticed that the air
flows through the straw of larg-er porosities produced highlarg-er pressures at some points, main-ly the mid-height and exhaust ones, regardless of the fact that the pressure of air intake was smaller. This observation could be explained by the fact that the straw loads with smaller porosity are liable to lodgment near the exhaust lid, which affects the increase of local pressure values. This phe-nomenon is restricted to labora-tory conditions and should not occur in real cases with compact straw bales. Bigger loads of straw possess the structure of more expressed solid-shape charac-teristics, and are not liable to this kind of shape deformation. In any case, the overall pressure drop (from air inlet to release point which is at atmospheric pressure) will be equal to the gauge pressure at the inlet, i.e. total and at-mospheric pressure difference.
By dividing the volume flow rates of air by the surface area of the straw bed (which was A = d2π/4 = 0.0201 m2), cross sectional velocity (super-ficial velocity) w is obtained. The pressure gradient is calcu-lated by dividing the pressure drop by the thickness of the straw bed. The dependence of
superficial velocity on the pressure gradient is shown in fig 4.
The coefficients K1 and K2 from eq. (4) may be determined from fig. 4, by fitting a se-cond-order polynomial function to the experimentally de-termined correlations (for the known density and viscosity), applying a last-squares fit. [6, 11]
Figure 3. Pressure drop measurement results for different bed heights
Figure 4. Pressure gradient values in relation to superficial velocity
By implementing this procedure, the proportionality coefficients A = μ/K1 and B = ρ/K2 of eq. (4) were obtained, and so the coefficients K1 and K2. Table 2 shows these values.
Table 2. Viscous and inertial permeability values
Porosity
Ε[-]
Proportionality coefficients Viscous, Inertial
Viscous permeability,
K1∙109 [m2]
Inertial, permeability
K2∙103 [m]
A B
0.79 2541.8 –239.8 7.12 5.02
0.82 2147.6 –173.5 8.43 6.94
0.91 2009.5 –167.8 9.01 7.19
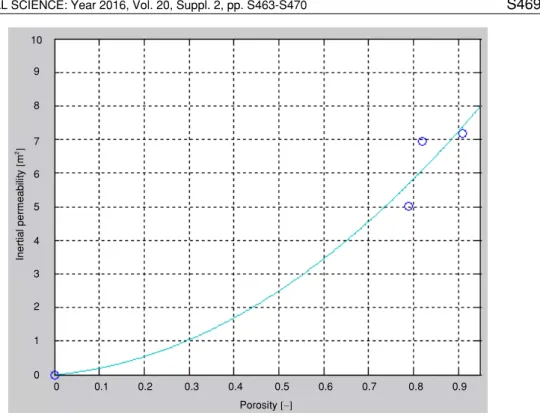
Using a similar procedure (the method of polynomial fitting), the dependence of permeability on porosity can be obtained. These dependences are shown in figs. 5 and 6.
Figure 5. Variation of viscous permeability with porosity
By applying the above-mentioned method, the dependence of viscous and inertial permeability K1 and K2 on the porosity variations may be expressed:
V
iscou
s
p
e
rm
e
a
b
ility
[
m
2]
10
9
8
7
6
5
4
3
2
1
0
0 0.1 0.2 0.3 0.4 0.5 0.6 0.7 0.8 0.9
Figure 6. Variation of inertial permeability with porosity
Hence, the Forchheimer equation developed for wheat straw has the following form:
Coefficients K1 and K2 could also be expressed in the form of a rational function, if it is considered more appropriate, according to Ergun’s relation [12] for porous materials. Conclusions
Based on the literature survey, we believe that due to different straw particles struc-ture, practically every kind of agricultural waste will have different air flow characteristics, so the conclusions about the Forchheimer coefficients for different sorts of mediums must be strictly distinguished. In addition, every type of straw should be investigated by several au-thors, in very different conditions, to gain even better insight into the flow through the medi-um. Otherwise, models could be poor and insufficient for the purposes of designing useful facilities.
This paper outlines a new formula, and considering all these facts, it might be a con-tribution to this area of combustion science.
By analyzing the obtained results, some significant conclusions important for bustion technology could be made. These results could serve as a theoretical basis for com-bustion kinetics considerations. Real agricultural waste bales are gathered and compressed in many different densities and dimensions, so by varying the thickness of straw bed (i.e. straw layer height) and its porosity, very different pressure gradients may appear. Combustion pa-rameters, such as theoretical air amount and air pressure, could be largely influenced by these
10
9
8
7
6
5
4
3
2
1
0
In
e
rtia
l
p
e
rm
e
a
b
ili
ty
[
m
2]
0 0.1 0.2 0.3 0.4 0.5 0.6 0.7 0.8 0.9
variations. With models like the one presented in this paper, these conditions should be de-termined with ease.
It can be noticed that higher points have smaller pressure drops (or smaller pressure gradients). This fact could be explained by the appearance of developed porous media flow, i.e. the main stream is split into many smaller streamlines that withstand friction and drag forces of less intensity.
In order to get a wider set of experimental data, an essentially different experimental set-up should be used. This should be the subject of future works.
The internal bale humidity is neglected. However, the humidity of the straw was very low, so this parameter should not have much influence on the results. The reason for neglecting bale humidity is the assumption that the straw fed in the combustion facility was already exposed to some kind of drying process, which is common in such facilities.
Nomenclature
A – surface area, [m2]
d – diameter of the porous bed, [m]
K1 – viscous permeability, [m2] K2 – inertial permeability, [m] p – pressure, [Pa]
Vp – volume of porous space, [m3] Vs – volume of solid fractions, [m3] Vt – total volume of bed, [m3] w – superficial velocity, [ms-1]
x – coordinate, [m]
Greek symbols
ε – porosity, [-]
μ – dynamic viscosity, [Pa∙s] ρ – density, [kgm-3]
Subscripts
i, j – direction
References
[1] Miljković, B., et al., Mathematical Modelling of Straw Combustion in a Moving Bed Combustor: A Two Dimensional Approach, 10th Japan/China Symposium on Coal and C1 Chemistry – Fuel, 104
(2013), Feb., pp. 351-364
[2] ***, Statistical Yearbook of Serbia 2008 – Production of Major Crops, 2008, pp. 211-214
[3] Sheng, Y. Z., et al., Structural Design and Numerical Simulation for Furnace Arch in Straw-Fired Boil-er, Challenges of Power Engineering and Environment Proceedings,14 (2007), 3, pp. 1167-1172 [4] Yang, Y. B., et al., Mathematical Modelling of Straw Combustion in a 38 MWe Power Plant Furnace
and Effect of Operating Conditions, Fuel,86 (2007), 1-2, pp. 129-142
[5] Whitaker, S., The Forchheimer Equation: A Theoretical Development, Transport in Porous Media,25
(1996), 1, pp. 27-61
[6] Erić, A., et al., Experimental Method for Determining Forchheimer Equation Coefficients Related to Flow of Air Through the Bales of Soy Straw, International Journal of Heat and Mass Transfer, 54
(2011), 19-20, pp. 4300-4306
[7] Sobieski, W., Trykozko, A., Darcy’s and Forchheimer’s Laws in Practice. Part 1. The Experiment,
Technical Sciences,17 (2014), 4, pp. 321-335
[8] Nield, D. A., Bejan, A. ,Convection in Porous Media, Springer Science Bussines Media, Inc., 2006 [9] Dukhan, N., et al., Experimental Flow in Various Porous Media and Reconciliation of Forchheimer and
Ergun Relations, Experimental Thermal and Fluid Science, 57 (2014), Sept., pp. 425-433
[10] Cimolin, F., et al., Navier–Stokes/Forchheimer Models for Filtration Through Porous Media, Applied Numerical Mathematics, 72 (2013), Oct.,pp. 205-224
[11] Jambhekar, V. A., Forchheimer Porous-Media Flow Models – Numerical Investigation and Comparison with Experimental Data, M. Sc. thesis, Universität Stuttgart, Germany, 2011
[12] Ergun, S., Fluid Flow through Packed Columns, Chem. ENG. Prog, 48 (1952), 1, pp. 89-94
![Table 1. Biomass production in Vojvodina region 2003-2007 [2]](https://thumb-eu.123doks.com/thumbv2/123dok_br/17077650.235798/2.892.157.425.284.421/table-biomass-production-in-vojvodina-region.webp)