Cancer mortality among
rubber industry workers in São
Paulo, Brazil
ABSTRACT
OBJECTIVE: To investigate cancer deaths among rubber industry workers according to company size.
METHODS: This historical cohort study included 9,188 male workers, engaged as members of a workers’ union in São Paulo, Southeastern Brazil, between 1975 and 1985, alive in January 1990 and followed until the end of 2000. Overall and specific cancer deaths were compared within the cohort, with subjects stratified according to company size and economic activity, sector of work, and worker qualification. Risk set assessment and conditional logistic regression were used to estimate relative risks, adjusted for age, time since first job, and duration of employment in the rubber industry.
RESULTS: When compared to employees of larger companies, workers employed in small companies showed greater risk of death due to any type of cancer (RR=2.33, 95% CI: 0.90-6.03), stomach tumors (RR=3.47; 95% CI: 2.57-4.67), and upper aero-digestive tract tumors (RR=2.49; 95% CI: 1.78-3.48). Risk of death was greater among workers employed in maintenance (RR=2.23; 95% CI: 0.73-6.76); expedition, storage and transportation (RR=2.97; 95% CI: 0.77-11.38); and production (RR=3.51; 95% CI: 1.07-11.57), when compared to workers engaged in clerical work and support activities.
CONCLUSIONS: Our results provide further evidence for an increased risk of stomach and upper aero-digestive tract tumors – and possibly of all types of cancer – among rubber industry workers employed in small companies when compared to employees of larger companies.
KEYWORDS: Neoplasms, mortality. Rubber industry. Occupational health. Cohort studies. Risk.
Hélio NevesI
José Eduardo Cajado MoncauII,†
Paulo Roberto KaufmannIII
Victor Wünsch FilhoIV
I Secretaria do Verde e Meio Ambiente do Município de São Paulo. São Paulo, SP, Brasil
I I Departamento de Medicina Preventiva. Escola Paulista de Medicina. Universidade Federal de São Paulo. São Paulo, SP, Brasil
I I IDepartamento de Saúde. Sindicato dos Trabalhadores da Indústria de Artefatos de Borracha, de Pneumáticos e Afins de São Paulo. São Paulo, SP, Brasil
I VDepartamento de Epidemiologia. Faculdade de Saúde Pública. Universidade de São Paulo. São Paulo, SP, Brasil
†In memoriam
Correspondence:
Hélio Neves
Rua do Paraíso, 387 10o andar 04103-000 São Paulo, SP, Brasil E-mail: helion@prefeitura.sp.gov.br
INTRODUCTION
The rubber industry is a unique example of complex exposure of human beings to chemicals. This expo-sure is considered as carcinogenic for humans by the World Health Organization’s International Agency for
Research on Cancer.*,** Ideally, an estimate of the
risk of cancer death related to each of the carcino-genic substances present in the production process of multiple rubber products would be desirable. How-ever, this is impossible in practice due to the lack of adequate and feasible techniques for identifying and measuring individual exposure to the many sub-stances used in this industry, many of which even lack known chemical structures. An alternative to overcome such difficulties is to use indirect classifi-cations for exposure, such as time working in the in-dustry, tasks performed, and work sector, in order to
evaluate the risk of cancer in the rubber industry.8,9
Although a wide range of levels of exposure to differ-ent substances have been found in the rubber indus-try, certain patterns have been identified. Exposure to airborne particulate matter takes place especially during the early stages of the production process, during the manipulation, weighting, and mixing of raw materials. Solvents are employed during the mix-ing stages, when they are sprayed over the rubber before it is vulcanized. Vulcanization, in its turn, gen-erates fumes and gases that contain benzene, polycy-clic aromatic hydrocarbons, and nitrosamines. Dur-ing product inspection, finishDur-ing, and storage stages, contaminants such as nitrosamine can be detected in
the environment.15 These distinct stages are less
no-ticeable in smaller companies, where work organiza-tion and infrastructure are deficient.
Epidemiological studies conducted in developed countries, usually in the context of large companies, have shown increased risk of leukemia, lymphomas, and cancers of the bladder, lung, larynx, stomach, colon, prostate, pancreas, liver, and skin among
rub-ber industry workers.7 However, the magnitude of the
risks found varies greatly among studies.
Little information is available on the occurrence of cancer in the rubber industry in developing coun-tries. In Brazil, as in Latin-America, there are no co-hort studies investigating the occurrence of cancer in this industry.
The present study was aimed at determining cancer
mortality rates among workers of the rubber industry. Our primary hypothesis was that the size of the com-pany would influence the risk of cancer death, i.e., that the employees of small companies would be at greater risk of dying of cancer than those of large companies.
METHODS
We studied a fixed-population cohort, consisting of workers engaged in a rubber industry workers’ union in the state of São Paulo, Southeastern Brazil, be-tween 1 January 1975 and 31 December 1985, who were alive on 1 January 1990. Subjects were followed until 31 December 2000. The choice of including only workers who were alive on 1 January 1990 was based on the fact that reliable information on cause of death was available only after this date.
Data were transcribed into an electronic database and subjected to consistency procedures. Of the 17,717 workers enrolled in the union between 1975 and 1985, 14,359 (81%) were identified in the Cadastro Nacional de Informações Sociais (National Social Information Database – CNIS), which is maintained by the Brazilian Ministry of Labor and Employment.
Females (n=1,336) were excluded from the analyses, leading to a study population of 9,188 male workers.
The company for which subjects worked upon enrollment in the union was obtained from union re-gistration forms. We thus identified 205 companies, to which we added all other companies identified in union databases, totaling 1,017 companies with com-pany name and Cadastro Nacional de Pessoa Jurídica (National Business Registration Number). The Empresa de Processamento de Dados da Previdência
Social(Social Security Data Processing Company
-Dataprev) identified, in the CNIS database, all sub-jects with labor relationships with any of the 1,017 companies. Dataprev searched for the records of each subject working in these companies and generated a database with the occupational history of 1,076,917 workers, corresponding to 7,134,022 employments, with beginning and ending dates, in 646,923 compa-nies of any type and field. We traced 9,188 members of the cohort in this database. Employment prior to 1975 was considered as beginning on 1 January 1975.
We found 743 rubber manufacturing companies, lo-cated in any of the country’s five regions, in which
*International Agency for Research on Cancer - IARC. Overall Evaluations of Carcinogenicity to Humans. Available on-line at://www-cie.iarc.fr/monoeval/crthall.html [2006 jan 06].
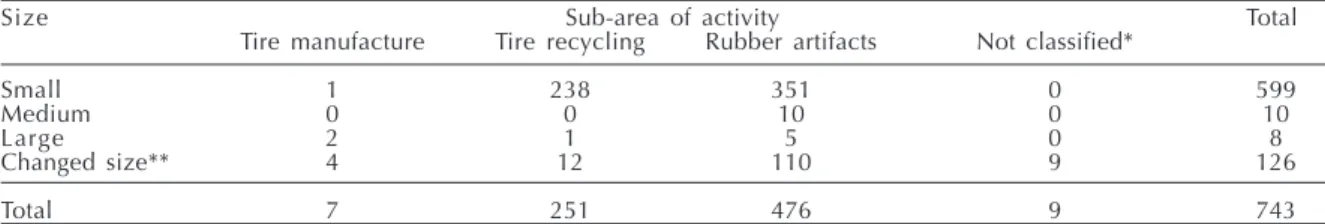
members of the cohort had been employed. These companies were classified into three sub-areas: tire manufacture, rubber article manufacture, and tire re-cycling. We also classified companies by size, ac-cording to the number of employees (under 100, 100-499, 500 and over). Employment commencement and termination dates were used to calculate the duration of employment of each subject and the year-to-year size of companies. The distribution of companies ac-cording to size and sub-area is presented in Table 1.
We found that the larger the number of different employments, the higher the probability of the subject having worked in companies of different sizes and sub-areas. Moreover, the size of some companies changed during the studied period. However, the majority of the workers in the cohort worked always in companies of similar size and equivalent sub-area (Table 2).
Professional qualification and sector of employment were determined based on to the information pro-vided by the worker upon entry to the union. Many workers may have changed sectors; however, the databases consulted do not allow us to evaluate such dynamics. Professional qualification was divided into three groups: non-qualified; qualified; and gen-eral management and higher level professionals. Sec-tors of employment were divided into four groups: office and support; maintenance; expedition, stor-age, and support; and production (Table 2).
Each subject in the cohort was thus identified in terms of beginning of exposure to industry (date of first employment, starting in 1975); duration of employ-ment in small, medium, and large rubber manufactur-ing companies; production sub-area; personal quali-fication; and sector of employment upon enrollment in the union.
Multiple sources were used for the follow-up of sub-jects and identification of deaths. Search in these sources was hierarchical, despite being performed si-multaneously in certain situations. Once reliable in-formation on a subject was obtained from one of the sources, search in the remaining sources was inter-rupted. Information from different sources were
or-ganized into a single database, in which the dates of entry and withdrawal of the subject from the source, as well as the subject’s vital status (living/deceased), were recorded.
The CNIS database allowed for an investigation of subjects’ occupational histories. Subjects with regis-tered employment on 31 December 2000 were con-sidered as alive at the end of the study. Two other sources were also investigated: the Sistema Informatizado de Óbitos (Computerized Mortality System - SISOBI) and the Sistema Único de Benefícios (Unified Benefit System - SUB), from which we ob-tained information on the beginning and ending of social security benefits received by cohort members or, when benefits were requested due to death, on the date and city where the death was registered. The Relação Anual de Informações Sociais (Annual So-cial Information Report - RAIS) was used to confirm the vital status of cohort members.
Based on the Tribunal Regional Eleitoral (Regional Electoral Court - TRE) database, we considered as being alive in 2002 all subjects present to the 2002 election. When the TRE provided information on the date and city of death of a given subject, the city’s notary publics were investigated for the pres-ence of a death certificate (DC). The Sistema Estadual de Análises de Dados (State Data Analysis System -SEADE) Foundation and the Programa de
Aprimo-ramento de Informações de Mortalidade do
Município de São Paulo (City of São Paulo Mortal-ity Information Improvement Program - PRO-AIM) were also invaluable sources of information on the death of cohort members and were essential for the location of DC.
After uniting the information contributed by each of these sources, the following profile of the status of cohort members in 31 December 2000 was estab-lished: 7,032 (76.5%) living; 1,604 (17.5%) lost to follow-up; and 552 (6.0%) deceased.
The expected number of deaths was calculated based on the age distribution and mortality for the popula-tion of São Paulo State between 1980 and 2000. This Table 1 - Characteristics of the companies that employed cohort members. São Paulo, Brazil, 1990-2000.
Size Sub-area of activity Total
Tire manufacture Tire recycling Rubber artifacts Not classified*
Small 1 238 351 0 599
Medium 0 0 10 0 10
Large 2 1 5 0 8
Changed size** 4 12 110 9 126
Total 7 251 476 9 743
*Companies not classified with respect to sub-area of activity due to insufficient information
was calculated using the direct standardization
method.2 We thus obtained an estimate of 831 deaths,
of which 111 were due to cancer.
Although we found information on the deaths of 651 subjects, 99 of these did not include either the date or city of registration. These subjects were considered as lost to follow-up. We did not obtain copies of the DC or information on underlying cause of death for 104 deaths with known date and city. Copies of the DC were obtained for 421 deaths. For 27 deaths, we accepted the underlying cause of death included in the SEADE (8 deaths) and PRO-AIM (19 deaths) elec-tronic databases, thus totaling 448 deaths of cohort members with defined date and cause.
A trained SEADE codifier reviewed the DC and stand-ardized the coding of underlying cause of death
ac-cording to the 10th revision of the International
Clas-sification of Diseases and Related Health Problems
(ICD-10),10 identifying 67 cancer deaths.
Cancer deaths were compared within the cohort, con-sidering the distribution of subjects according to com-pany size and sub-area, professional qualification, sector of employment, and duration of exposure in each category. We calculated the effect of each vari-able on cancer mortality. We did not carry out exter-nal comparisons due to the losses to follow-up and to the large number of deaths without defined causes.
We used risk set assessment2 and conditional logistic
regression for data analysis. Relative risk (RR) was
calculated by comparing each cancer death with all living cohort members under risk at that moment. Thus, each subject may contribute to several risk sets. Potential confounders “age, total duration of employ-ment, and time since first exposure in the rubber in-dustry” were controlled for during analysis.
We built a database including 67 risk sets, one for each cancer death, ranging from 7,058 to 8,952 sub-jects for comparison. Risk sets included the follow-ing information on subjects: identification; date of entry into union; date of birth; beginning of first employment in rubber industry; beginning and end of each employment in rubber industry and company classification according to sub-area and size; total duration of employment in rubber industry; profes-sional qualification; sector of employment; date of exit from the cohort (due to death, loss, or end of follow-up); and, when applicable, cause of death.
We calculated latency periods for each subject, ex-cluding periods of employment in the rubber indus-try in the 10 years preceding the subject’s death. This period is of little relevance from the etiological per-spective, since any cases of cancer occurred within this period are unlikely to be associated to exposure
in the rubber industry.5
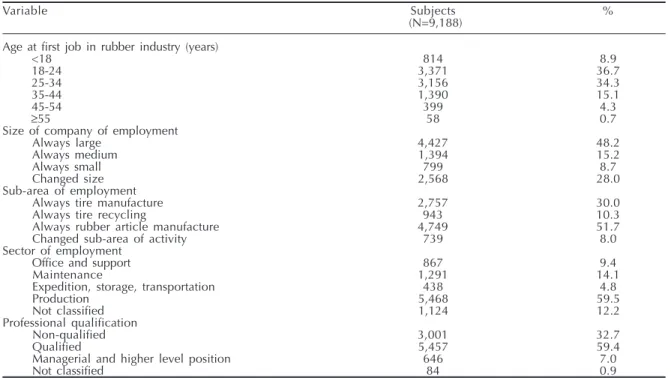
In addition to analyses considering the total number of tumors, we examined the risk of occurrence of spe-cific cancers with frequencies large enough to allow for statistical treatment. These included lung, stom-ach, and upper aero-digestive tract cancer. Estimated Table 2 - Characteristics of cohort members. São Paulo, Brazil, 1990-2000.
Variable Subjects %
(N=9,188) Age at first job in rubber industry (years)
<18 814 8.9
18-24 3,371 36.7
25-34 3,156 34.3
35-44 1,390 15.1
45-54 399 4.3
≥55 58 0.7
Size of company of employment
Always large 4,427 48.2
Always medium 1,394 15.2
Always small 799 8.7
Changed size 2,568 28.0
Sub-area of employment
Always tire manufacture 2,757 30.0
Always tire recycling 943 10.3
Always rubber article manufacture 4,749 51.7
Changed sub-area of activity 739 8.0
Sector of employment
Office and support 867 9.4
Maintenance 1,291 14.1
Expedition, storage, transportation 438 4.8
Production 5,468 59.5
Not classified 1,124 12.2
Professional qualification
Non-qualified 3,001 32.7
Qualified 5,457 59.4
Managerial and higher level position 646 7.0
RR according to sub-area, size, sector, and professional qualification were calculated considering scenarios with any duration of employment in the rubber indus-try, with and without the inclusion of the latency pe-riod. We used SAS version 8.02 software both for build-ing databases and for statistical analysis.
RESULTS
Mean number of jobs in any area among cohort mem-bers was 8.2; mean number of jobs within the rubber industry was 2,0. Most subjects (80%) were first em-ployed in the rubber industry before age 35 years. Roughly one-half of all subjects were always em-ployed in large companies and in the rubber article manufacture sub-area. Most workers (59.5%) were employed in production, and 59.4% of subjects were classified as qualified workers (Table 2).
Total losses amounted to 1,708 subjects (18.6%), which include the 203 deaths for which we could not obtain a copy of the DC, although information on the date and city of death were available. Of the 448 deaths with defined underlying cause, the propor-tion of cancer deaths (14.9%) was above the expected for the population of the State of São Paulo (13.4%). The distribution of cancers according to anatomical site is presented in Table 3. Cancers of the stomach and lung were the most frequent.
Table 4 presents the relative risk for variables com-pany size, sub-area, sector of employment, and pro-fessional qualification, both including and not in-cluding the latency period.
We found a 13% increase in the chance of cancer death for each additional year of life (RR=1.13; 95% CI: 1.11-1.16). Subjects whose first employment in
the rubber industry was over 20 years ago showed excess deaths due to cancer in general (RR=1.84; 95% CI: 0.78-4.33) when compared to those who began their activities in the rubber industry 20 or less years ago. Duration of employment in the rubber industry, treated as a continuous variable, was negatively as-sociated with death by cancer (RR=0.94; 95% CI: 0.89-0.99), which corresponds to a protective effect of 6% for each additional year of work.
Although not all estimates attained statistical signifi-cance, the results obtained allow us to formulate the hypothesis that workers always employed in small or medium companies showed increased risk of death due to any type of cancer, as well as to cancer of the stom-ach and upper aero-digestive tract (Tables 4 and 5).
We did not find differences in risk of death between workers employed in the different sub-areas (Table 4). However, we did find a protective effect for can-cer of the stomach and upper aero-digestive tract among workers always employed in the rubber arti-cle manufacture sub-area, when compared to those producing tires (Table 5). We were unable to calcu-late the risk of death due to lung and stomach tumors for this variable.
Subjects who worked in maintenance; expedition, stor-age, and transportation, and in production sectors showed excess deaths due to any type of cancer when compared to subjects working in office and support sectors (Table 4). We were unable to calculate the ef-fect of variable “sector of work” on mortality due to lung, stomach, and upper aero-digestive tract cancer.
We found excess mortality due to any type of cancer among subjects occupying managerial and higher level positions, when compared to non-qualified
Table 3 - Cancer deaths in the cohort, according to anatomic site and International Classification of Diseases, 10th Review
(ICD-10). São Paulo, Brazil, 1990-2000.
ICD-10 Anatomic site N (%)
C01-06; C09-10; C13-14 Oral cavity and pharynx* 3 (4.5)
C15 Esophagus* 7 (10.4)
C16 Stomach 17 (25.4)
C18.7 Colon 1 (1.5)
C20 Rectum 2 (3.0)
C22 Liver and intrahepatic bile ducts 3 (4.5)
C32 Larynx* 4 (6.0)
C34 Bronchus and lung 9 (13.4)
C43.9 Skin 1 (1.5)
C45-49 Mesothelial and soft tissues 1 (1.5)
C61 Prostate 3 (4.5)
C64 Kidney 3 (4.5)
C67 Bladder 1 (1.5)
C71 Brain 3 (4.5)
C76; C80 Ill-specified 4 (6.0)
C82-83; C85 Non-Hodgkin’s lymphoma 1 (1.5)
C90 Multiple myeloma 1 (1.5)
C91-95 Leukemias 3 (4.5)
C00-97 All sites 67 (100.0)
workers (Table 4). However, managerial or higher level position was a protective factor for death due to stom-ach and upper aero-digestive tract cancer (Table 5). We were unable to calculate the effect of professional qualification on lung cancer mortality.
DISCUSSION
Beginning to work in the rubber industry earlier (>20 years ago) was positively associated with cancer death. This result is comparable to that reported by
Weiland et al,16 who identified increased risk of
can-cer for periods between 10 and 20 years since first
employment in the rubber industry. Gustavsson et al6
reported increased cancer mortality in the Swedish rubber industry for workers admitted more than 40 years before the study.
Workers with greater time of employment in the rubber industry were protected from cancer mortality. Used as a surrogate for cumulative exposure, time of employ-ment also reflects the healthy worker effect, and the apparently contradictory protective effect detected is
not unprecedented. Checkoway et al3,4 argued that the
healthy worker effect is perceived in both internal and external comparisons in the context of occupational
cohort studies. Bernardinelli et al1 identified
protec-tion against cancer mortality only during the first years of employment in the rubber industry and increased risk after the second decade of employment.
The results of the present study support the hypoth-esis that the risk of cancer death in the rubber indus-try increases as company size decreases. No other studies include this evaluation, which prevents a
comparison of our results. This result may reflect the fact that smaller companies are usually less struc-tured and, consequently, environments are less healthy, and the probability of exposure to
carcino-genic substances is greater.7
Sub-area of activity was not a risk factor in our
popula-tion. Sorahan et al13 identified excess esophagus
can-cer deaths among workers in the rubber article manu-facturing sub-area, when compared to those working in tire manufacture. We were unable to evaluate the risk of lung and stomach cancer according to sub-area due to the limitations of our sample. However, workers from the rubber article manufacture sector showed pro-tection against upper aero-digestive tract cancer when compared to workers from the tire industry.
The analysis of cancer mortality according to sector of employment showed increased risk for the mainte-nance; expedition, storage, and transportation, and the production sectors, when compared to the office and support sector. One may assume that, regardless of the company’s sub-area, the greatest risk of expo-sure to carcinogenic substances will be for workers of the production sector. In spite of the lack of a com-mon standard by which to classify sectors of employ-ment, epidemiological studies have attempted to iden-tify areas or tasks of greater risk in different depart-ments. The association between stomach and lung cancer mortality and work in the rubber industry has been attributed to the exposure to rubber dust, particulate matter in general, fibers, oils, and talcum,
which are present mostly in the production sectors.13,14
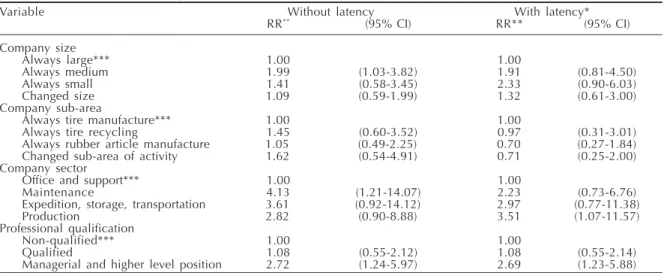
Workers occupying managerial or higher-level posi-Table 4 - Analyses with and without the inclusion of the latency period of relative risks (RR) related to size, sub-area of activity, and sector of work of companies in which cohort members were employed, and professional qualification of workers on the occurrence of death due to all types of cancer (n=67). São Paulo, Brazil, 1990-2000.
Variable Without latency With latency*
RR** (95% CI) RR** (95% CI)
Company size
Always large*** 1.00 1.00
Always medium 1.99 (1.03-3.82) 1.91 (0.81-4.50)
Always small 1.41 (0.58-3.45) 2.33 (0.90-6.03)
Changed size 1.09 (0.59-1.99) 1.32 (0.61-3.00)
Company sub-area
Always tire manufacture*** 1.00 1.00
Always tire recycling 1.45 (0.60-3.52) 0.97 (0.31-3.01)
Always rubber article manufacture 1.05 (0.49-2.25) 0.70 (0.27-1.84)
Changed sub-area of activity 1.62 (0.54-4.91) 0.71 (0.25-2.00)
Company sector
Office and support*** 1.00 1.00
Maintenance 4.13 (1.21-14.07) 2.23 (0.73-6.76)
Expedition, storage, transportation 3.61 (0.92-14.12) 2.97 (0.77-11.38)
Production 2.82 (0.90-8.88) 3.51 (1.07-11.57)
Professional qualification
Non-qualified*** 1.00 1.00
Qualified 1.08 (0.55-2.12) 1.08 (0.55-2.14)
Managerial and higher level position 2.72 (1.24-5.97) 2.69 (1.23-5.88) *Latency was obtained by the exclusion of exposures in the ten years preceding the occurrence of cancer
tions showed excess deaths due to any type of cancer. Paradoxically, however, this same group was pro-tected against cancer death of the stomach and of the upper aero-digestive tract. We were unable to explain this finding. We were also unable to find other stud-ies investigating professional qualification. On the other hand, stomach and upper aero-digestive tract
cancers affect mostly the lower socioeconomic strata.11
Thus, it is likely that the protection observed for these types of tumor in subjects with managerial or higher-level positions would be a reflection of the effect of socioeconomic variables on mortality.
The comparative analysis showed that losses to fol-low-up (18.6%) were similar to subjects traced until the end of the cohort in terms of selected variables of interest. This indicates that losses to follow-up were not due to factors related to exposure or dis-ease of interest. Several limitations are implied in the present study and may have introduced distor-tions into our estimates.
The loss of information on deaths – which includes both deaths that were not located and those that were located but lacked information on the underlying cause of death – reduced the precision of our esti-mates in a non-measurable manner. However, it is likely that the actual number of deaths in the cohort is smaller than expected, if we consider the healthy worker effect. This effect was identified in the analy-sis of variable “time of employment in the rubber industry”. However, two factors may distort its meas-urement – namely that workers may have had non-registered jobs, and that the work experience prior to
1975 was not investigated. The healthy worker effect may have influenced the risk estimates in the present study; however, we highlight the fact that this effect is less pronounced in cohort analyses based on inter-nal comparisons and in cancer studies.
The number of cancer deaths in the cohort was small, which prevented us from attaining the necessary sta-tistical power for some of the calculated estimates. In the analysis considering the latency period – i.e., ex-cluding from the analysis the 10-year period preced-ing death due to cancer – the number of observations was even smaller. However, estimates with this restric-tion were more faithful to reality and conferred greater coherence and biological plausibility to the results.
Smoking and alcohol consumption are potential risk factor for certain types of cancer and were not con-trolled for in the present study. However, as usual with occupational cohort studies, we assume that there were no substantial differences in terms of these fac-tors between the groups of workers.
The failure to detect differences in cancer mortality between the workers of different sub-areas may be due to non-differential misclassification. Some of the com-panies were unknown to union managers, and no ad-equate source of confirmation of the assumptions made regarding this variable was identified. Professional qualification and sector of employment, classified based on the information provided by workers upon enrollment in the union, may have changed with time, and we were unable to follow such alterations. There-fore, caution is advised when considering the results Table 5 - Analysis with the inclusion of latency* of relative risks (RR) related to size, sub-area of activity, and sector of work of companies in which cohort members were employed, and professional qualification of workers on the occurrence of death due to lung, stomach, and upper aero-digestive- tract (UADT). São Paulo, Brazil, 1990-2000.
Variable Lung Stomach UADT
(n=9) (n=17) (n=14)
RR** (95% CI) RR** (95% CI) RR** (95% CI)
Company size
Always large*** 1.00 1.00 1.00
Always medium 0.43 (0.21-0.89) 1.18 (0.83-1.66) 2.30 (1.68-3.17)
Always small - - 3.47 (2.57-4.67) 2.49 (1.78-3.48)
Changed size 0.97 (0.54-1.72) 0.62 (0.45-0.87) 3.91 (3.00-5.09)
Company sub-area
Always tire manufacture*** - - - - 1.00
Always tire recycling - - - - 1.04 (0.75-1.44)
Always rubber article manufacture - - - - 0.40 (0.30-0.54)
Changed sub-area of activity - - - - 0.63 (0.47-0.86)
Company sector
Office and support*** - - -
-Maintenance - - -
-Expedition, storage, transportation - - -
-Production - - -
-Professional qualification
Non-qualified*** - - 1.00 1.00
Qualified - - 0.06 (0.03-0.14) -
-Managerial and higher level position - - 0.58 (0.49-0.69) 0.73 (0.61-0.87) *Latency was obtained by the exclusion of exposures in the ten years preceding the occurrence of cancer
obtained for these two variables. An alternative to im-prove the quality of these data would be to apply them
to an occupational exposure matrix.12
ACKNOWLEDGEMENTS
We would like to thank Dr. Paolo Boffetta of the World Health Organization’s International Agency
REFERENCES
1. Bernardinelli L, De Marco R, Tinelli C. Cancer mortality in an italian rubber factory. Br J Ind Med. 1987;44(3):187-91.
2. Breslow NE, Day NE. Statistical methods in cancer research. Lyon: IARC; 1987. The design and analysis of cohort studies; v. 2.
3. Checkoway H, Pearce N, Dement JM. Design and conduct of occupational epidemiology studies: I -design aspects of cohort studies. Am J Ind Med. 1989;15(4):363-73.
4. Checkoway H, Pearce N, Dement JM. Design and conduct of occupational epidemiology studies: II -analysis of cohort studies. Am J Ind Med.
1989;15(4):375-94.
5. Checkoway H, Pearce N, Hickey JL, Dement JM. Latency analysis in occupational epidemiology. Arch Environ Health. 1990;45(2):95-100.
6. Gustavsson P, Hogstedt C, Holmberg B. Mortality and incidence cancer among swedish rubber workers, 1952-1981. Scand J Work Environ Health. 1986;12(6):538-44.
7. Kogevinas M, Sala M, Boffetta P, Kazerouni N, Kromhout H, Hoar-Zahm S. Cancer risk in the rubber industry: a review of the recent epidemiological evidence. Occup Environ Med. 1998;55(1):1-12.
8. Kromhout H, Heederick D. Occupational epidemiology in the rubber industry: implications of exposure variability. Am J Ind Med. 1995;27(2):171-85. 9. Kromhout H, Swuste P, Boleij JS. Empirical modeling
of chemical exposure in the rubber-manufacturing industry. Ann Occup Hyg. 1994;38(1):3-22.
10. Organização Mundial da Saúde – OMS. Classificação internacional de doenças e problemas relacionados à saúde: décima revisão. São Paulo: EDUSP; 1995. 11. Parkin DM, Bray F, Ferlay J, Pisani P. Global cancer
statistics, 2002. CA Cancer J Clin. 2005;55(2):74-108. 12. Ribeiro FSN, Wünsch Filho V. Avaliação retrospectiva
da exposição ocupacional a cancerígenos: aborda-gem epidemiológica e aplicação em vigilância em saúde. Cad Saúde Pública. 2004;20(4):881-90. 13. Sorahan T, Parkes HG, Veys CA, Waterhouse JA,
Straughan JK, Nutt A. Mortality in the British rubber industry 1946-85. Br J Ind Med. 1989;46(1):1-11. 14. Straif K, Keil U, Taeger D, Holthenrich D, Sun Y,
Bungers M, et al. Exposure to nitrosamines, carbon black, asbestos and talc and mortality from stomach, lung and laryngeal cancer in a cohort of rubber workers. Am J Epidemiol. 2000;152(4):297-305. 15. Vermeulen R, Bos RP, Kromhout H. Mutagenic
exposure in the rubber manufacturing industry: an industry wide survey. Mutat Res. 2001;490(1):27-34. 16. Weiland SK, Mundt KA, Keil U, Kraemer B, Birk T,
Person M, et al. Cancer mortality among workers in the german rubber industry: 1981-91. Occup Environ Med. 1996;53(5):289-98.
Supported by Fundação de Amparo à Pesquisa do Estado de São Paulo (Fapesp - Process no. 97/07522-8). Study carried out at the Departamento de Epidemiologia da Faculdade de Saúde Pública da USP.
Based on the Doctoral thesis presented at the Departamento de Epidemiologia, Faculdade de Saúde Pública da USP, in 2004.