AR
TIGO ORIGINAL / ORIGINAL AR
TICLE
NUTRITIONAL FOLLOW-UP OF PATIENTS
WITH ULCERATIVE COLITIS DURING
PERIODS OF INTESTINAL INFLAMMATORY
ACTIVITY AND REMISSION
Juliana
RIPOLI
, Sender Jankiel
MISZPUTEN
, Orlando
AMBROGINI Jr.
and Luciana de
CARVALHO
ABSTRACT – Context - Ulcerative colitis is an inlammatory bowel disease involving supericial inlammation of the mucosa of the colon,
rectum, and anus, sometimes including the terminal ileum. When in clinical activity, the disease is characterized by various daily evacuations
containing blood, mucus and/or pus alternating periods of remission. Objective - To compare nutritional parameters (dietary, biochemical
and anthropometric) among patients with ulcerative colitis followed up on an outpatient basis over a period of 1 year and during periods
of intestinal inlammatory activity and remission. Methods - Sixty-ive patients were studied over a period of 1 year and divided into two
groups: group 1 with inlammatory disease activity (n = 24), and group 2 without disease activity (n = 41). Anthropometric measures,
biochemical parameters, quantitative food intake, and qualitative food frequency were analyzed. Results - A signiicant reduction in body mass
index and weight and in the intake of energy, proteins, lipids, calcium, iron and phosphorus was observed in the group with inlammatory activity (group 1) when compared to the period of clinical remission. The most affected food groups were cereals, legumes, oils, and fats. In contrast, in group 2 signiicant differences in triceps and sub scapular skin fold thickness, total protein, hemoglobin and hematocrit
were observed between the irst and inal visit. Calcium and vitamin B6 intake, as well as the consumption of legumes, meat and eggs, and
sugar and sweets, was signiicantly higher than on the irst visit. Conclusion: Patients with ulcerative colitis followed up on an outpatient
basis tend to be well nourished. However, the nutritional aspects studied tend to worsen during the period of inlammatory disease activity.
HEADINGS – Proctocolitis. Nutrition assessment. Risk groups.
INTRODUCTION
Inlammatory bowel diseases (IBD) comprise a variety of disorders that result from the continuous activation of the immunoinlammatory cascade, whose etiology has not been deined in some cases. Classical IBD include Crohn’s disease (CD), ulcerative colitis (UC), and indeterminate colitis. These diseases are chronic and are characterized by alternating periods of recurrence and remission(35, 37).
UC is the result of inlammation which is limited to the colonic mucosa; the terminal ileum may be involved in rare cases(9, 34, 35, 38). In Europe, the incidence of UC is
approximately 10 to 20 new cases per 100,000/year, with a prevalence of 100 to 200 patients/100,000 inhabitants(9, 29, 30, 35, 40). No epidemiological surveys regarding the
prevalence of UC in Brazil are available. According to Miszputen(35), Brazil is rated as a geographic area of
low frequency of this disease based on data from the World Gastroenterology Organization. Various genetic, immunological and environmental factors have been associated with UC(9, 37). As an environmental factor,
diet may contribute to the pathogenesis of this disease, but conclusive studies are still lacking(36).
Malnutrition in IBD is multifactorial, with anorexia, nausea, unnecessary food restrictions, increased intestinal loss of electrolytes, minerals, trace elements and blood, increased energy and nutritional requirements (sepsis, fever, increased cell turnover), and interaction between drugs and nutrients contributing to this condition(2, 13, 14, 21, 27, 28, 31, 34, 36). Patients with UC are frequently concerned
that some foods aggravate their gastrointestinal symptoms and often modify their diet in an attempt to control their symptoms or to prevent recurrence of the disease. This becomes signiicant when the patient reduces or avoids certain foods to an extent that may lead to the onset of a nutritional deiciency. No epidemiological data are available but it is expected that food intake is limited during clinical activity and not during remission of the disease(14, 26, 31, 36). Among the foods most cited
in the literature are the limited ingestion of milk and its derivatives and ibers, which are often reported to be unnecessary, thus resulting in a supply that lacks essential nutrients(3, 5, 10, 11, 14, 20, 31, 32, 33, 43).
Nutritional follow-up by nutritionists, gastroenterologists and clinicians is considered to be of fundamental importance for patients with UC during both the phase of remission and of inlammatory activity.
“Departamento de Gastroenterologia Clínica, Universidade Federal de São Paulo (UNIFESP)”, São Paulo, SP, Brazil.
The objective of this study was to compare nutritional parameters (dietary, biochemical and anthropometric) among patients with UC followed up on an outpatient basis over a period of 1 year and during periods of intestinal inlammatory activity and remission.
METHODS
Eighty-four patients with a diagnosis of UC consecutively seen at the IBD outpatient clinic of the Gastroenterology Department (Federal University of São Paulo - UNIFESP), who were followed up between January 2004 and August 2006, were included for this prospective study and called general population.
Criteria for inclusion were a deinitive diagnosis of UC, understanding of the food record and agreement to the free informed consent form and excluded those with a history of surgery (total colectomy), patients with associated chronic diseases (neurological disorders, renal failure, liver diseases, cancer, and sclerosing cholangitis), and pregnant women.
During the study, 19 subjects (22.62%) were excluded because they did not attend the previously scheduled visits or because they could not be contacted by telephone or mail according to their data reported during the initial interview. Sixty-ive patients concluded the protocol and were individually followed up over a period of 1 year at intervals of 3 months, for a total of ive visits per patient including the entry visit.
The patients were submitted to the following evaluations on all visits: determination of clinical disease activity using the Simple Clinical Colitis Activity Index(24, 45), nutritional
status (anthropometry), dietary assessment (food record and food frequency questionnaire) and biochemical tests.
The 65 patients who attended all visits were subdivided into two groups based on the disease activity index throughout follow-up. Group 1 consisted of patients who presented inlammatory activity on some visit during the study period (n = 24), and group 2, with those who were in remission throughout the study (n = 41). In group 1, the variables were analyzed by comparing the same patient during recurrence and remission of the inlammatory process. In group 2, data from the same patient were compared between the irst and inal visit.
Anthropometric data were collected on all visits as follows:
• Height was measured with a sliding bar attached to a
scale to the nearest 0.5 cm;
• Weight was measured on a calibrated Filizola® scale to
the nearest 0.1 kg, with the subject barefoot and wearing minimal clothing;
• Body mass index (BMI) was calculated by dividing weight
(kg) by the square of height (m2)(46);
• Triceps (TST) and subscapular skinfold thickness (SST)
was measured with a caliper to the nearest 0.1 mm on the right arm. Measurements were made in triplicate and means were calculated(6, 12);
• Arm circumference (AC) was measured with metric tape
to the nearest 1 cm on the right arm. This parameter was used to calculate arm muscle circumference (AMC) and arm muscle area (AMA)(6, 12);
• AMC was calculated by the following formula: AMC (cm)
= (AC (cm) – π) x TST (mm). AMA was calculated by the formula AMA (cm2) = (AMC)2/4 π. AMA was corrected
for bone area by subtracting 6.5 cm2 for women and 10
cm2 for men aged 18 to 65 years(6, 12).
The following biochemical parameters were determined: albumin(16), hemoglobin and hematocrit(4), total lymphocyte
count (TLC) calculated based on the percentage of lymphocytes and number of leukocytes using the formula TLC = % lymphocytes x leukocytes/100(4), iron, ferritin, total protein(42),
leukocytes, and lymphocytes(22).
A quantitative food record was kept by the patient for 3 predetermined days (Sundays, Tuesdays and Thursdays) in the same week as the scheduled visit. The mean of the three records was used for analysis.
The NUTWIN Nutrition Support Program (2003) developed by the Health Informatics Studies Center of UNIFESP/EPM was used to calculate the intake of the following nutrients:
• Macronutrients: total energy (kcal), energy (kcal/kg) current
weight, protein (g), total protein/kg current weight, lipids (g), carbohydrates (g), and ibers (g).
• Minerals: calcium (mg), copper (mg), iron (mg), magnesium
(mg), manganese (mg), phosphorus (mg), sodium (mg), potassium (mg), zinc (mg), folate (µg), and pantothenic acid (mg).
• Vitamins: vitamin A (IU), vitamin C (mg), thiamine (vitamin
B1, mg), ribolavin (vitamin B2, mg), niacin (vitamin B3, mg), pyridoxine (vitamin B6, mg), and cobalamine (vitamin B12, µg).
A qualitative food frequency questionnaire was applied during the visits by the same interviewer. Foods were divided into the following groups: milk and its derivatives, cereals, legumes, meat and processed derivatives, vegetables, fruits, oils and fats, sugar and sweets, oleaginous seeds, and non-alcoholic beverages.
All procedures adopted were approved by the Ethics Committee of UNIFESP (1147/06).
The results obtained for both groups were analyzed statistically. Quantitative variables are reported as the mean and standard deviation, and qualitative and semiqualitative variables are reported as absolute (n) and relative (%) frequency. Variables were compared between the same patients using the parametric t-test, adopting a level of signiicance of
P<0.05 (α = 5%).
RESULTS
extensive disease (52.38%), and in clinical remission without symptoms related to the inlammatory disease (89.29%).
Most anthropometric parameters were lower during the disease activity period compared to that of remission (group 1), with a signiicant difference for weight and BMI (Table 1). In group 2, the anthropometric parameters showed a trend towards improvement on the inal visit, with a signiicant difference being observed for body adiposity (TST and SST).
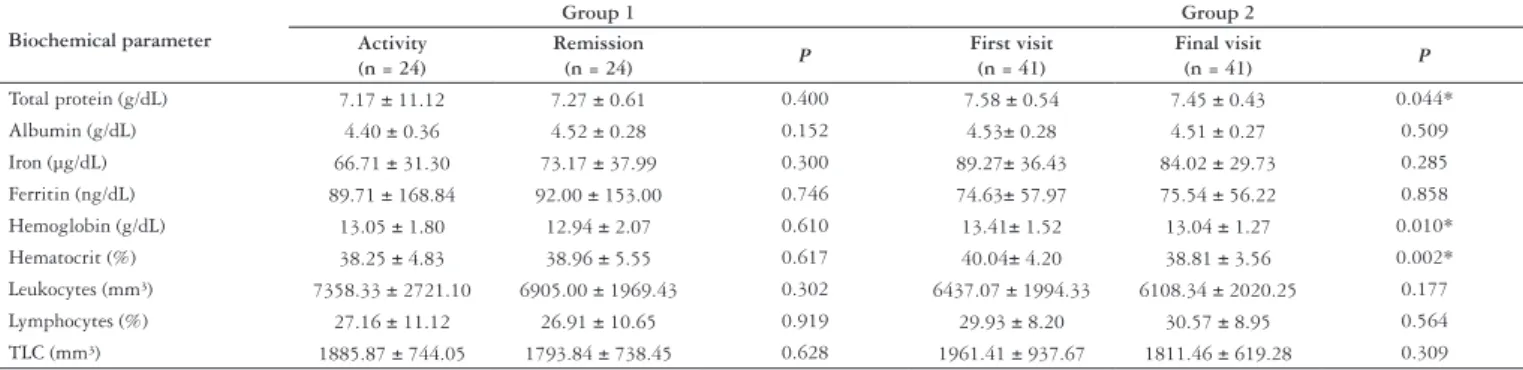
As can be seen in Table 2, most mean values of the biochemical parameters tended to be lower during the inlammatory activity period, but the differences were not signiicant. In contrast, in group 2 mean values were lower on the inal appointment when compared to the irst one, with the difference being signiicant for total protein, hemoglobin and hematocrit.
Nutrient intake (except for manganese) was higher during the remission when compared to the period of inlammatory recurrence, with a signiicant difference being observed for total energy, protein, lipids, calcium, iron, and phosphorus (Table 3). In group 2, nutrient intake was predominantly higher on the inal visit. This increase was signiicant for the daily intake of calcium and vitamin B6.
Table 4 shows a trend towards improved intake of different food groups in group 1 (except of oleaginous seeds) during remission when compared to the period of inlammatory activity. A signiicant difference between the two periods was observed for the groups of cereals, legumes, and oils and fats. An increase in the intake of most food groups was observed in group 2 (except for processed meat and oleaginous seeds)
between the irst and inal visit (Table 4), with a signiicant difference for legumes, meat, and sugar and sweets.
DISCUSSION
The objective of this study was an abroad investigation of the nutritional conditions of patients with UC stratiied according to activity and remission of the inlammatory process.
The mean age of the patients (45.52 ± 11.61 years, range: 22 to 77) was similar to that reported by other investigators(8, 26, 27), although a lower or higher mean age has also been
observed(18, 19, 23, 25, 39, 44). The mean age at diagnosis (37.5 ±
11.71 years) was also similar to that reported in the literature as the decade of peak incidence of the disease(9, 35, 41) with a
higher incidence among women (65.48%). A similar incidence has been found in other investigations(1, 23, 39, 44), but there are
studies reporting a male predominance(8, 18, 19, 25, 26).
Among the 84 patients of the general population, 89.29% presented remission of inlammation on the irst visit(45).
Twenty-four (36.92%) of the 65 patients studied over the period of 1 year manifested reactivation of the inlammatory process. Jowett et al.(26) observed disease recurrence in 52%
at the same period of follow-up. One criticism to the present study might be the lack of endoscopic conirmation of inlammatory reactivity. However, the instrument used to classify the characteristics of remission and recurrence has been validated previously, with the observation of a strong correlation between sigmoidoscopy and the clinical score used(24, 45).
TABLE 2. Comparison of biochemical parameters between group 1 and group 2 at disease activity period compared to that of remission (group 1) and at irst and inal visit (group 2)
Biochemical parameter
Group 1 Group 2
Activity (n = 24)
Remission
(n = 24) P
First visit (n = 41)
Final visit
(n = 41) P
Total protein (g/dL) 7.17 ± 11.12 7.27 ± 0.61 0.400 7.58 ± 0.54 7.45 ± 0.43 0.044* Albumin (g/dL) 4.40 ± 0.36 4.52 ± 0.28 0.152 4.53± 0.28 4.51 ± 0.27 0.509 Iron (µg/dL) 66.71 ± 31.30 73.17 ± 37.99 0.300 89.27± 36.43 84.02 ± 29.73 0.285 Ferritin (ng/dL) 89.71 ± 168.84 92.00 ± 153.00 0.746 74.63± 57.97 75.54 ± 56.22 0.858 Hemoglobin (g/dL) 13.05 ± 1.80 12.94 ± 2.07 0.610 13.41± 1.52 13.04 ± 1.27 0.010* Hematocrit (%) 38.25 ± 4.83 38.96 ± 5.55 0.617 40.04± 4.20 38.81 ± 3.56 0.002* Leukocytes (mm³) 7358.33 ± 2721.10 6905.00 ± 1969.43 0.302 6437.07 ± 1994.33 6108.34 ± 2020.25 0.177 Lymphocytes (%) 27.16 ± 11.12 26.91 ± 10.65 0.919 29.93 ± 8.20 30.57 ± 8.95 0.564 TLC (mm³) 1885.87 ± 744.05 1793.84 ± 738.45 0.628 1961.41 ± 937.67 1811.46 ± 619.28 0.309
TLC = total lymphocyte count; * P<0.05 indicates statistical signiicance
TABLE 1. Comparison of anthropometric parameters between group 1 and group 2 at disease activity period compared to that of remission (group 1) and at irst and inal visit (group 2)
Anthropometric parameter
Group 1 Group 2
Activity (n = 24)
Remission
(n = 24) P
First visit (n = 41)
Final visit
(n = 41) P
Weight (kg) 66.07 ± 14.42 67.33 ± 15.27 0.033* 65.53 ± 11.24 66.38 ± 12.13 0.167 BMI (kg/m²) 25.37 ± 3.32 25.86 ± 3.52 0.025* 24.64 ± 4.15 24.97 ± 4.49 0.157 TST (mm) 21.38 ± 6.22 22.00 ± 7.40 0.466 17.92 ± 7.68 19.95 ± 8.15 0.003* SST (mm) 25.71 ± 7.83 25.50 ± 7.99 0.689 20.57 ± 8.43 23.76 ± 8.92 <0.001* AMC (cm) 23.39 ± 3.35 23.50 ± 2.90 0.670 23.88 ± 2.49 23.44 ± 2.45 0.078 AMA (cm²) 37.61 ± 12.33 37.80 ± 10.16 0.845 38.80 ± 8.68 37.16 ± 8.61 0.086
TABLE 4. Comparison of food frequency between group 1 and group 2 at disease activity period compared to that of remission (group 1) and at irst and inal visit (group 2)
Food groups
Group 1 Group 2
Activity (n = 24)
Remission
(n = 24) P
First visit (n = 41)
Final visit
(n = 41) P
Milk and derivatives 1.08 ± 0.92 1.42 ± 0.90 0.059 1.47 ± 0.91 1.48 ± 0.71 0.905 Cereals 3.06 ± 1.06 3.57 ± 0.90 0.009* 3.37 ± 0.79 3.43 ± 0.76 0.657 Legumes 0.73 ± 0.56 1.23 ± 0.57 0.001* 1.13 ± 0.54 1.35 ± 0.56 0.020* Meat 1.46 ± 0.59 1.72 ± 0.43 0.079 1.38 ± 0.36 1.52 ± 0.42 0.015* Processed meat 0.30 ± 0.33 0.36 ± 0.32 0.285 0.22 ± 0.28 0.22 ± 0.21 1.000 Vegetables 1.59 ± 0.77 1.83 ± 0.62 0.089 1.86 ± 0.80 1.87 ± 0.69 0.920 Fruits 1.57 ± 1.01 1.89 ± 1.07 0.125 2.02 ± 1.07 2.06 ± 0.97 0.737 Oils and fats 2.43 ± 0.98 2.86 ± 0.79 0.011* 3.02 ± 0.67 3.06 ± 0.74 0.690 Sugar and sweets 2.02 ± 0.76 2.14 ± 0.70 0.268 2.72 ± 0.70 2.94 ± 0.57 0.029* Oleaginous seeds 0.07 ± 0.15 0.05 ± 0.15 0.739 0.05 ± 0.11 0.05 ± 0.10 0.623 Beverages 0.85 ± 0.51 0.96 ± 0.55 0.402 1.03 ± 0.56 1.13 ± 0.59 0.344
* P<0.05 indicates statistical signiicance
TABLE 3. Comparison of food record data between group 1 and group 2 at disease activity period compared to that of remission (group 1) and at irst and inal visit (group 2)
Energy, macro and micronutrients
Group 1 Group 2
Activity (n = 24)
Remission
(n = 24) P
First visit (n = 41)
Final visit
(n = 41) P
Energy (kcal) 1714.35 ± 575.28 1905.67 ± 501.98 0.033* 1913.49 ± 496.95 2023.29 ± 103.64 0.172 Energy (kcal/kg) 26.31 ± 8.64 28.77 ± 7.55 0.076 30.3 ± 10.00 31.5 ± 9.30 0.324 Protein (g) 80.19 ± 31.12 92.30 ± 33.18 0.037* 91.78 ± 27.08 99.78 ± 25.12 0.091 Protein (g/kg) 1.21 ± 0.41 1.37 ± 0.40 0.092 1.40 ± 0.50 1.60 ± 0.50 0.106 Lipids (g) 54.05 ± 18.21 61.43 ± 20.44 0.045* 60.12 ± 21.91 61.35 ± 19.06 0.773 Carbohydrates (g) 228.82 ± 88.52 248.39 ± 77.90 0.215 255.99 ± 77.15 272.06 ± 92.77 0.236 Fibers (g) 12.44 ± 9.23 12.90 ± 8.27 0.835 12.31 ± 6.48 14.09 ± 8.07 0.085 Calcium (mg) 529.84 ± 285.62 665.76 ± 313.92 0.0048* 594.57 ± 254.50 709.06 ± 278.55 0.017* Copper (mg) 1.28 ± 0.84 1.33 ± 0.75 0.778 1.50 ± 0.84 1.39 ± 0.64 0.566 Iron (mg) 13.09 ± 5.35 14.85 ± 5.13 0.041* 15.55 ± 5.73 16.09 ± 4.73 0.515 Magnesium (mg) 243.66 ± 97.76 261.08 ± 74.79 0.348 298.58 ± 125.08 289.13 ± 80.60 0.628 Manganese (mg) 2.48 ± 1.59 2.40 ± 1.04 0.768 2.80 ± 1.29 2.94 ± 1.43 0.579 Phosphorus (mg) 1084.46 ± 401.92 1226.47 ± 333.58 0.012* 1303.69 ± 507.86 1344.37 ± 335.22 0.613 Sodium (mg) 3922.94 ± 993.51 4156.43 ± 1044.08 0.102 4166.16 ± 919.11 4103.00 ± 689.44 0.675 Potassium (mg) 2413.95 ± 1053.08 2497.26 ± 699.61 0.642 2756.26 ± 761.89 2959.69 ± 822.12 0.137 Zinc (mg) 10.58 ± 4.84 11.51 ± 4.80 0.240 11.9 ± 3.67 13.13 ± 3.79 0.094 Folate (mcg) 240.62 ± 135.72 265.69 ± 129.46 0.242 326.63 ± 152.42 323.53 ± 123.59 0.889 Pant. acid (mg) 4.42 ± 1.85 4.76 ± 1.43 0.237 4.71 ± 1.48 5.21 ± 1.70 0.089 Vitamin A (IU) 3008.39 ± 1909.20 3342.84 ± 1682.96 0.543 3474.20 ± 1968.30 3132.45 ± 1937.95 0.423 Vitamin C (mg) 83.02 ± 79.73 101.99 ± 77.23 0.330 109.91 ± 91.65 134.86 ± 129.51 0.305 Thiamine (mg) 1.32 ± 0.61 1.40 ± 0.43 0.094 1.55 ± 0.48 1.67 ± 0.53 0.112 Ribolavine (mg) 1.50 ± 0.81 1.72 ± 0.78 0.094 1.56 ± 0.62 1.82 ± 0.77 0.106 Niacine (mg) 20.41 ± 10.33 23.82 ± 10.53 0.149 24.66 ± 14.37 24.71 ± 9.17 0.984 Vitamin B6 (mg) 1.63 ± 0.74 1.73 ± 0.58 0.366 1.71 ± 0.43 1.96 ± 0.62 0.017* Vitamin B12 (µg) 3.86 ± 2.18 4.84 ± 2.59 0.099 4.39 ± 2.38 5.55 ± 2.58 0.055
* P<0.05 indicates statistical signiicance
Anthropometric evaluation of groups 1 and 2 showed that the BMI was within the range of eutrophy to overweight, indicating that this population tends to be well nourished(46).
These indings are in agreement with various studies(8, 15, 17, 18, 23, 39, 44). A signiicant difference in mean weight and BMI was
observed in group 1 (Table 1), demonstrating that during an outbreak of inlammatory activity rectocolitic patients present a signiicant weight loss and a consequent reduction of BMI.
reactivation are free to seek immediate medical care, irrespective of scheduled visits. To our knowledge, there are no studies comparing the same population of outpatients with UC during the periods of activity and remission. Studies have reported a body weight loss of patients hospitalized due to recurrence of the disease(27). In addition, BMI might be reduced during
the active phase of IBD(44) or when compared to a group of
control subjects(17, 18, 23). Similar to the present results, other
investigators also found no changes that would compromise body composition (lean and fat mass) in patients with UC(8, 15, 18, 23, 27, 39). Physical exercise can improve muscle strength and
affect body composition. Muscle mass tends to increase and fat mass tends to decrease(28). Unfortunately, no information
regarding physical exercise is available for the present patients. However, it seems reasonable to assume that patients with UC are physically less active than healthy individuals.
There was no concern regarding the therapeutic regimens used by the patients during any of the phases, since the analyses included parameters related to the last pre-visit week. However, patients who relapsed between visits and sought medical care were evaluated on that occasion and transferred to group 1. In a few cases, the patients spontaneously modiied their treatment based on past experience and, when attending the scheduled visit again in remission, there was no reason for their reallocation to group 1.
Corticosteroids are known to stimulate food intake, to promote fat deposition and to alter energy expenditure, factors that lead to changes in body composition. We did not address therapeutic questions in the present series since, to our knowledge, there are no conclusive studies investigating the effect of drug treatment on the nutritional status of patients with UC(31).
With respect to biochemical analysis, mean total protein, albumin, iron, ferritin, hemoglobin, hematocrit, leukocytes and lymphocytes were found to be normal in the general population and in groups 1 and 2. Similar results have been reported in other studies(8, 18, 44). Lower mean albumin, hemoglobin
and hematocrit values were observed in patients with active IBD, but these indings might have been inluenced by the inclusion of patients with CD in the same group(15). In the
present study, TLC was recognized to be within normal limits in only 38.10% of the general population. Mild lymphocyte depletion has been reported in the literature(15). Lower TLC
is associated with nutritional deiciencies. Values indicating lymphocyte depletion as observed in this study might be due to the disease itself or to the continuous use of medications such as immunosuppressive agents.
We observed no signiicant difference in the levels of albumin, a marker widely used for the classiication of malnutrition, since it relects the acute phase reaction mediated by cytokines during the inlammatory event. However, the time interval between the onset of inlammatory activity of the disease and albumin measurement has not been correctly deined. A study conducted at UNIFESP investigating the relationship between albumin and malnutrition in CD found no association between these parameters but there was an association between disease activity and hypoalbuminemia(7).
A decline in albumin levels may also be observed in patients hospitalized due to recurrence of UC(27). The observation
of normal biochemical parameters in this study might be explained by outpatient conditions of the patients who did not require hospitalization and presented good nutritional status (in relation to the anthropometric parameters analyzed above).
Signiicant reductions in total protein, hemoglobin and hematocrit were observed in group 2 on the inal visit. Although some of these reductions were signiicant, values remained within normal limits and at good levels.
In group 1, intake reduction of most nutrients was observed during disease activity period, when compared to remission phase. Signiicant differences were observed in energy, protein, lipids, calcium, iron, and phosphorus intake. To our knowledge, there are no studies in the literature evaluating the same patient treated on an outpatient basis during the periods of disease activity and remission. Nutrient reduction during the symptomatic phase has been suggested to be associated with anorexia, abdominal pain, dietary beliefs and attempts to relieve symptoms(21, 26, 44). In group 2, patients maintained
their dietary pattern from the irst to the inal visit, with the observation of signiicant improvement only in the intake of calcium and vitamin B6.
Analysis of the quantitative food frequency questionnaire, group 1 showed a reduction in all food groups (except for oleaginous seeds), a inding probably related to the factors mentioned earlier. The food groups showing a signiicant reduction in group 1 during the inlammatory activity period were cereals, legumes, and oils and fats. Reductions in foods such as grains, fruits, vegetables, meat and derivatives, milk and derivatives, and lipids during active IBD compared to the period of remission have been reported in the literature(15, 39, 44). We observed no signiicant qualitative reduction in
milk consumption and its derivatives or ibers in those with active disease compared to the phase of remission. Diet containing adequate amounts of calcium and vitamin D is recommended as a prophylaxis of osteopenia and osteoporosis(14, 26). In group 2, patients presented a signiicantly
higher consumption of legumes, meat and sugar and sweets on the inal visit. Foods rich in sulfate and sulfur, such as meat (especially red meat) and alcohol, have been implicated in the recurrence of UC(25).
It is known that many patients with UC undergo food restrictions based on the indication of health care professionals, relatives or friends, or based on indings in magazines and newspapers. In the present study, it was not possible to evaluate the source of food restriction since the patients did not recall it or received numerous instructions and were unable to specify them. The present results may relect a new attitude to patients with UC towards health care habits and a greater attention to nutrition.
FINAL CONSIDERATIONS
are inluenced, in part, by a reduced intake of these nutrients. A healthy diet with little or no food restriction, depending on individual tolerance, should be encouraged in order to maintain a healthy nutritional status. Food restrictions may produce deiciencies in different elements, and follow-up by
a team specialized in clinical nutrition is therefore important. Further studies in this area are necessary to deine the true nutritional needs of this population. Dietary beliefs should be revised in order to guide healthcare professionals who monitor these patients.
REFERENCES
1. Ballegaard M, Bjergstrom A, Brondum S, Hylander E, Jensen L, Ladefoges K. Self-reported food intolerance in chronic inlammatory bowel disease. Scand J Gastroenterol. 1997;32:569-71
2. Barot LR, Rombeau JL, Feurer ID, Mullen James L. Caloric requirements in patients with inlammatory bowel disease. Ann Surg. 1982;195:214-8. 3. Bernstein CN, Ament M, Artinian L, Ridgeway J, Shanahan F. Milk tolerance
in adults with ulcerative colitis. Am J Gastroenterol. 1994;89:872-77. 4. Blackburn G, Bristriam BR, Moini BS, Schlamn HT, Smith MF. Nutritional and
metabolic assessment of hospitalized patient. JPEN J Parenter Enteral Nutr. 1977;1:11-22.
5. Burke A, Lichtenstein GR, Rombeau JL. Nutrition and ulcerative colitis. Baillieres Clin Gastroenterol. 1997;11:153-74.
6. Burr ML, Phillips KM. Anthropometric norms in the elderly. Br J Nutr. 1984;51:165-9.
7. Cabral VLR, Carvalho L, Miszputen SJ. Importância da albumina sérica na avaliação nutricional e de atividade inlamatória em pacientes com doença de Crohn. Arq Gastroenterol. 2001;38:104-8.
8. Capristo E, Mingrone G, Addolorato G, Greco AV, Gasbarrini G. Metabolic features of inlammatory bowel disease in a remission phase of the disease activity. J Intern Med. 1998;243:339-47.
9. Carter MJ, Lobo AJ, Travis SPL. Guidelines for the management of inlammatory bowel disease in adults. Gut. 2004;53(suppl V):v1-v16.
10. Davis PS, Rhodes J. Maintenance of remission in ulcerative colitis with sulphasalazine or a high-iber diet: a clinical trial. Br Med J. 1978;1:1524-5.
11. Fernández-Banares F, Hinojosa J, Sánchez-Lombraña JL, Navarro E, Martinez-Salmerón JF, García-Pugés A, González-Huix F, Riera J, González-Lara V, Domínguez-Abascal F, Giné JJ, Moles J, Gomollón F, Gassull MA. Randomized clinical trial of Plantago ovata seeds (dietary iber) as compared with mesalamine in maintaining remission in ulcerative colitis. Spanish Group for the Study of Crohn’s Disease and Ulcerative Colitis (GETECCU). Am J Gastroenterol. 1999;94:427-33.
12. Frisancho AR. Anthropometric standards for the assessment of growth and nutritional status. Ann Arbor: University of Michigan Press; 1990.
13. Gassul MA, Cabré E. Nutrition in inlammatory bowel disease. Curr Opin Clin Nutr Metab Care. 2001;4:561-9.
Ripoli J, Miszputen SJ, Ambrogini Jr. O, Carvalho L. Acompanhamento nutricional de pacientes com retocolite ulcerativa inespecíica, nas fases de atividade e remissão da inlamação intestinal. Arq Gastroenterol. 2010;47(1):49-55.
RESUMO – Contexto - A retocolite ulcerativa inespecíica compreende uma das doenças inlamatórias intestinais, com características de inlamação supericial
da mucosa do cólon, reto, ânus, podendo incluir o íleo terminal. Caracteriza-se por várias exonerações diárias, com a presença de sangue e/ou pus, cursando
em períodos de atividade e remissão inlamatória intestinal. Objetivo - Comparar os parâmetros nutricionais (alimentares, bioquímicos e antropométricos)
em pacientes com retocolite ulcerativa inespecíica acompanhados em ambulatório, durante a atividade e remissão da doença inlamatória, no período de
1 ano. Métodos - Foram estudados 65 pacientes durante 1 ano e divididos em dois grupos: grupo 1 com atividade inlamatória da doença (n = 24) e grupo
2 sem atividade da doença (n = 41), e analisadas as medidas antropométricas, os exames bioquímicos, o consumo alimentar quantitativo e a frequência
alimentar qualitativa. Resultados - O grupo com atividade inlamatória (grupo 1) apresentou redução estatisticamente signiicante no índice de massa
corpórea, peso, no consumo de energia, proteínas, lipídios, cálcio, ferro e fósforo, em relação ao período de remissão clínica. Os grupos alimentares com signiicado prejuízo foram os cereais, as leguminosas, os óleos e as gorduras. Já no grupo 2, foram observadas alterações com signiicância estatística na dobra cutânea tricipital e subescapular, nos valores de proteínas totais, hemoglobina e hematócrito da consulta inicial para a inal. Encontrou-se consumo
de cálcio e vitamina B6, assim como na ingestão do grupo das leguminosas, carnes e ovos, açúcares e doces maiores signiicativamente do que na consulta
inicial. Conclusão - Pacientes com retocolite ulcerativa inespecíica, acompanhados em ambulatório, tendem a ser bem nutridos, mas na fase de atividade
inlamatória da doença, há tendência na piora dos aspectos nutricionais estudados.
DESCRITORES – Proctocolite. Avaliação nutricional. Grupos de risco.
14. Goh J, O’Morain CAO. Nutrition and adult inlammatory bowel disease (review article). Aliment Pharmacol Ther. 2003;17:307-20.
15. Góngora VVC, Aguilar NEP, García PM, Vargas-Voráková F. Evaluación dietética en pacientes con padecimientos gastroenterológicos en el área de Consulta Externa del Instituto Nacional de Ciencias Médicas y Nutrición Salvador Zubirán. Rev Gastroenterol Mex. 2003;68:192-206.
16. Grant JP, Custer EJ, Thurlow J. Técnicas atuais para avaliação nutricional. In: Mullen, JL, Crosby LO Rombeau JL, editores. Simpósio sobre nutrição e cirurgia. Clínicas Cirúrgicas da América do Norte. Rio de Janeiro: Interamericana. 1981. p.441-69. 17. Greeling BJ, Lichtenbelt WDVM, Stockbrugger RW, Brummer RJM. Gender
speciics alterations on body composition in patients with inlammatory bowel disease compared with controls. Eur J Clin Nutr. 1999;53:479-85.
18. Greeling BJ, Badart-Smook A, Stockbrugger RW, Brummer R-JM. Comprehensive nutritional status in recently diagnosed patients with inlammatory bowel disease compared with population controls. Eur J Clin Nutr. 2000;54:514-21. 19. Greeling BJ, Dagnelie PC, Badart-Smook A, Russel MG, Stockbrugger RW,
Brummer R-JM. Diet as a risk factor for the development of ulcerative colitis. Am J Gastroenterol. 2000;95:1008-13.
20. Hallert C, Kaldma M, Petersson BG. Ispaghula Husk may relieve gastrointestinal symptoms in ulcerative colitis in remission. Scand J Gastroenterol. 1991;26:747-50. 21. Han PD, Burke A, Baldassano RN, Rombeau JL, Lichtenstein GR. Nutrition and inlammatory bowel disease. Gastroenterol Clin North Am. 1999;28:423-43. 22. International Committee for standardization in haematology (ICSH). The assignment of values to fresh blood used for calibrating automated cell counters. Clin Lab Hematol. 1988;10:203-12.
23. Jahnsen J, Falch JA, Mowinckel P, Aadland E. Body composition in patients with inlammatory bowel disease: a population-based study. Am J Gastroenterol. 2003;98:1556-62.
24. Jowett SL, Seal CJ, Phillips E, Gregory W, Barton JR, Welfare MR. Deining relapse of ulcerative colitis using a symptom-based activity index. Scand J Gastroenterol. 2003;38:164-71.
25. Jowett SL, Seal CJ, Pearce MS, Phillips E, Gregory W, Barton JR, Welfare MR. Inluence of dietary factors on the clinical course of ulcerative colitis: a prospective cohort study. Gut 2004;53:1479-84.
27. Klein S, Meyers S, O’Sullivan P, Barton D, Leleiko N, Janowitz HD. The metabolic impact of active ulcerative colitis: energy expenditure and nitrogen balance. J Clin Gastroenterol. 1988;10:34-40.
28. Kushner RF, Schoeller DA. Resting and total energy expenditure in patients with inlammatory bowel disease. Am J Clin Nutr. 1991;53:161-5.
29. Lashner BA. Epidemiology of inlammatory bowel disease. Gastroenterol Clin North Am. 1995;24:467-74.
30. Loftus EVJ. Clinical epidemiology of inlammatory bowel disease: incidence, prevalence, and environmental inluences. Gastroenterology. 2004;126:1504-17. 31. Lochs H, Dejong C, Hammarqvist F, Hebuterne X, Leon-Sanz M, Schütz T, Van
Gemert W, Van Gossum A, Valentini L, Lübke H, Bischoff S, Engelmann N, Thul P. ESPEN Guidelines on enteral nutrition: gastroenterology. Clin Nutr. 2006;25:260-74. 32. Madrid RB, Benarroch HS, Sánchez SM, Sánchez FG, Merino AA, Martínez
JM. Malabsorción de lactosa en pacientes con enfermedad inlamatoria intestinal inactiva: ¿esta justiicado excluir los productos lácteos a todos los pacientes? An Med Interna. 2004;21(5):212-14.
33. Mishkin B, Yalovsky M, Mishlin S. Increased prevalence of lactose malabsorption in Crohn’s disease patients at low risk for lactose malabsorption based on ethnic origin. Am J Gastroenterol. 1997;92:1148-53.
34. Miszputen SJ. Doenças inlamatórias intestinais. In: Miszputen SJ, editor. Manual de gastroenterologia. São Paulo: Projetos Médicos; 2004. p.201-11.
35. Miszputen SJ. Doenças inlamatórias intestinais. In: Miszputen SJ, editor. Guias de medicina ambulatorial e hospitalar UNIFESP/EPM – Gastroenterologia. 2ª ed. São Paulo: Manole; 2007. p.333-46.
36. O’Sullivan M, O’Morain C. Nutrition in inlammatory bowel disease. Best Pract Res Clin Gastroenterol. 2006;20:561-73.
37. Podolsky DK. Inlammatory bowel disease (medical progress). N Engl J Med. 2002;347:417-29.
38. Sands BE. From symptom to diagnosis: clinical distinctions among various forms of intestinal inlammation. Gastroenterology. 2004;126:1518-32.
39. Santos RR, Santana GO, Brito MA, Mello ACN, Guedes JC, Lyra LG. Aspectos nutricionais de pacientes adultos com doença inlamatória intestinal atendidos em uma unidade de saúde de Salvador. GED Gastroenterol Endosc Dig. 2003;22:169-74.
40. Shivananda S, Lennard-Jones J, Logan R, Fear N, Price A, Carpenter L, Blankenstein Van M; The EC-IBD Study Group. Incidence of inlammatory bowel disease across Europe: is there a difference between North and South? Gut. 1996;39: 690-7.
41. Souza MHLP, Troncon LEA, Rodrigues CM, Viana CFG, Onofre PHC, Monteiro RA, Passos ADC, Martinelle ALC, Meneghelli U. Evolução da ocorrência (1980-1999) da doença de Crohn e da retocolite ulcerativa idiopática e análise das suas características clínicas em um hospital universitário do Sudeste do Brasil. Arq Gastroenterol. 2002;39:98-105.
42. Tiez NW. Clinical guide to laboratory tests. 3rd edition. Philadelphia: WB Saunders; 1995. p.234, 374, 518-9.
43. Truelove SC. Ulcerative colitis provoked by milk. Br Med J. 1961;21:154-60. 44. Vagianos K, Bector S, McConnell J, Bernstein CN. Nutrition assessment of patients
with inlammatory bowel disease. JPEN J Parenter Enteral Nutr. 2007;31:311-9. 45. Walmsley RS, Ayres RCS, Pounder RE, Allan RN. A simple clinical colitis activity
index. Gut. 1998;43:29-32.
46. WHO – World Health Organization. Physical status: the use and interpretation of anthropometric. Report of a WHO Expert Committee. WHO Technical Reports Series. Geneva; 1995.