Analysis of Heterosis and Quantitative Trait
Loci for Kernel Shape Related Traits Using
Triple Testcross Population in Maize
Lu Jiang1,2, Min Ge1, Han Zhao1, Tifu Zhang1*
1Provincial Key Laboratory of Agrobiology, Jiangsu Academy of Agricultural Sciences, Nanjing, China,
2School of Biosciences, University of Nottingham, Sutton Bonington, United Kingdom
*zhangtifu@jaas.ac.cn
Abstract
Kernel shape related traits (KSRTs) have been shown to have important influences on grain yield. The previous studies that emphasize kernel length (KL) and kernel width (KW) lack a comprehensive evaluation of characters affecting kernel shape. In this study, materials of the basic generations (B73, Mo17, and B73 × Mo17), 82 intermated B73 × Mo17 (IBM) indi-viduals, and the corresponding triple testcross (TTC) populations were used to evaluate het-erosis, investigate correlations, and characterize the quantitative trait loci (QTL) for six KSRTs: KL, KW, length to width ratio (LWR), perimeter length (PL), kernel area (KA), and circularity (CS). The results showed that the mid-parent heterosis (MPH) for most of the KSRTs was moderate. The performance of KL, KW, PL, and KA exhibited significant posi-tive correlation with heterozygosity but their Pearson’s R values were low. Among KSRTs, the strongest significant correlation was found between PL and KA with R values was up to 0.964. In addition, KW, PL, KA, and CS were shown to be significant positive correlation with 100-kernel weight (HKW). 28 QTLs were detected for KSRTs in which nine were aug-mented additive, 13 were augaug-mented dominant, and six were dominance × additive epistat-ic. The contribution of a single QTL to total phenotypic variation ranged from 2.1% to 32.9%. Furthermore, 19 additive × additive digenic epistatic interactions were detected for all KSRTs with the highest totalR2for KW (78.8%), and nine dominance × dominance digenic epistatic interactions detected for KL, LWR, and CS with the highest totalR2(55.3%). Among significant digenic interactions, most occurred between genomic regions not mapped with main-effect QTLs. These findings display the complexity of the genetic basis for KSRTs and enhance our understanding on heterosis of KSRTs from the quantitative genetic perspective.
Introduction
Heterosis was proposed in the early 20thcentury to describe the superiority of heterozygous F1
compared with its homozygous parents in one or more traits [1,2]. Since then, heterosis has a11111
OPEN ACCESS
Citation:Jiang L, Ge M, Zhao H, Zhang T (2015) Analysis of Heterosis and Quantitative Trait Loci for Kernel Shape Related Traits Using Triple Testcross Population in Maize. PLoS ONE 10(4): e0124779. doi:10.1371/journal.pone.0124779
Academic Editor:Mingliang Xu, China Agricultural University, CHINA
Received:September 27, 2014
Accepted:March 3, 2015
Published:April 28, 2015
Copyright:© 2015 Jiang et al. This is an open access article distributed under the terms of the Creative Commons Attribution License, which permits unrestricted use, distribution, and reproduction in any medium, provided the original author and source are credited.
Data Availability Statement:All relevant data are within the paper and its Supporting Information files.
Funding:This work was supported by the NSFC
(No. 31301391;http://www.nsfc.gov.cn/), Jiangsu Natural Science Foundation (No. BK2012375), and Jiangsu Agriculture Science and Technology Innovation Fund (No. CX(12)5020 and No. CX(14) 5055). The funders had no role in study design, data collection and analysis, decision to publish, or preparation of the manuscript.
Competing Interests:The authors have declared
been widely applied for improving crops, and it has been particularly effective for maize pro-duction [3–5]. In general, maize crossbreeding efforts first aimed at improving the inbred lines and subsequently hybridizing these lines. Usually, the methods were focused on improving grain yield, which directly affects corn production and/or characters indirectly acting on corn production, e.g., decreasing plant height [6,7], enhancing resistance to diseases and pests [8–10], increasing planting density [11–13], or enhancing fertilizer utilization efficiency [14–16].
Given the quantitative complexity of these studies, grain yield was usually dissected into sev-eral components for further analysis. Considered the morphological relations, the relative com-ponents could be divided into two parts, ear related traits (e.g., ear length, ear diameter, row numbers, kernel number per row, and kernel number per ear) and kernel related traits (e.g., kernel length (KL), kernel width (KW), kernel thickness, and kernel weight). Researchers have demonstrated that yield related components always exhibit higher heritability than grain yield [17]. Most previous studies on maize yield related traits focused on ear related traits [18–21]. In recent years, kernel related traits have garnered more attention with studies attempting to elucidate the genetic basis of grain yield for a variety of reasons. For example, kernel size and weight were characterized as important determinants of grain yield [22,23] and large inbred kernels had the potential to produce better early vigor hybrids and promote flowering time [24]. In addition, several reports revealed that KL and KW had strong influences on kernel weight [25,26]. Therefore, kernel shape related traits (KSRTs) such as KL and KW are likely the major characters affecting grain yield.
Analyses based on quantitative trait locus (QTL) mapping have been extensively applied for deciphering the genetic basis of kernel shape in major crops [27–34]. In contrast, the corre-sponding research progress in maize has been slow and only a few QTLs related to kernel shape have been detected [17,26,35,36]. However, these studies all focused on the relationships of kernel weight with KL and/or KW using different mapping populations, e.g., F2:3and
recom-binant inbred line (RIL). To date, there have been no consistent QTLs related to KL and KW found among previous reports. The discrepancy could be caused by the different evaluation methods, different linkage maps, or different mapping populations used. In addition to KL and KW, other kernel shape characters such as perimeter length (PL), kernel area (KA), and circu-larity (CS) have not be quantified in previous studies on maize.
The accurate estimation of genetic effects facilitates a better understanding of target traits. To precisely detect epistasis, the triple testcross (TTC) design was developed by Kearsey and Jinks [37]. The design has the ability to test epistasis with high efficiency and can produce unbi-ased estimates of additive and dominance effects if epistasis does not exist. Following the RIL-based TTC design, digenic epistatic effects have been evaluated in several studies [38–40]. In maize, Frascaroli et al. [41] mapped several QTLs for plant height, seedling weight, grain yield, and number of kernels per plant using a TTC design and identified a few QTLs for these traits with digenic epistasis.
Materials and Methods
Plant materials
The intermated B73 × Mo17 (IBM) populations derived from the B73 × Mo17 cross were used for creating the TTC genetic populations. Based on the four generations of intermating among the F2progenies, the IBM populations have the potential to increase the genetic resolution
roughly four-fold [43]. According to the testcross (TC) progeny production scheme [37], three TC populations were obtained as follows: three groups of 82 RILs (female parents) were crossed with B73, Mo17, and their F1(B73 × Mo17) and the corresponding progeny
popula-tions are referred to as TC(B), TC(M), and TC(F). Therefore, the materials tested included the basic generations consisting of B73, Mo17, and F1as well as four RILs, TC(B), TC(M), and TC
(F) populations, with 82 genotypes within each population.
Field experiments
All materials were planted in three blocks in the Luhe Experimental Station of the Jiangsu Academy of Agricultural Science. Each block was arranged with the basic generations and the four populations. To evaluate the population traits statistically, two different field designs were laid out. A randomized complete block design was used for the basic generations and a split-plot design was used for the RIL and TTC populations. In the split-split-plot design, the four popu-lations were deemed the main plot and the subplot was comprised of the RILs and their three TTC progenies. In all instances, each genotype within each block was planted in a single-row with 8 plants after thinning. Thus, the distance between plants in a row was 0.3 m and the dis-tance between rows was 0.6 m. To reduce the boundary effect of the field, border rows were grown all around the blocks. All materials were subjected to the normal field management until the harvest of mature ears.
Traits measurement
The whole ears were manually harvested at physiological maturity (R6 stage). After several days of airing, the middle part of each ear was shelled. All kernels in a row were then bulked and 30 kernels were selected randomly per bulk to survey the representative KSRTs of geno-types. To measure the kernel shape accurately,SmartGrain, a high-throughput software for seed shape measurement was employed for the analysis [42]. Following the manual, digital im-ages of thirty kernels per genotype (along with a wire for reference length) were captured by large pixel digital camera. The images were then analyzed and kernel outlines were detected by SmartGrain. The software calculated six KSRTs automatically including KL, KW, LWR, PL, KA, and CS. We corrected misdetected parameters manually. Furthermore, 100-kernel weight (HKW) was evaluated by averaging three replicates of randomly selected 100 kernels for each TTC population.
Genetic linkage map
genotyping data. In total, 959 molecular markers were used for the genetic linkage map con-struction by MSTMap (S2 Table) [45].
Data analysis and QTL mapping
Heterosis was evaluated by mid-parent heterosis (MPH): MPH (%) = (F1-MP)/MP × 100,
where MP is the mid-parent value. The performance of the cross progenies TC(B), TC(M), and TC(F) is denoted asL1i,L2i, andL3i(i= 1–82), respectively. The mean values of genotype were
used for analyses of significant difference which were conducted via the SPSS 17.0 software (http://www.spss.com). As described by Melchinger et al. [46], the linear transformationsZ1=
(L1i+L2i)/2,Z2=L1i-L2i, andZ3=L1i+L2i- 2L3iwere then calculated for additive,
domi-nance, and epistasis QTL analysis.
The QTL analysis was carried out on the three linear transformationsZ1,Z2, andZ3with
composite interval mapping [47,48] via the software QTLMapper [49]. To obtain high resolu-tion QTL mapping, the main and interacresolu-tion effects of important markers were taken as the background genetic variation control. In the mapping range setup, the whole genome range was chosen to search QTLs from the entire genome. Following the manual, the main-effect QTLs were first identified and then the digenic epistasis at all possible marker pairs was ana-lyzed. When the threshold ofP0.001 andR2>5% was reached, the putative QTL was declared present [49]. IfP0.001 but 0<R25%, QTLs with LOD>3.0 were also considered significant. For all the main-effect and epistasis QTLs, the detection was based on the mix model approach [49].
Regarding the genetic effects of QTLs, the TTC design revealed the novel definitions given by Melchinger et al.[46] as follows. QTL detected by one-dimensional genome scans withZ1,
Z2, andZ3reflect augmented additive effectsai, augmented dominance effectsdi, and
dominance × additive effects [dai], respectively. The dominance degree ratio of a QTL was
esti-mated by the augmented dominance ratio |di/ai| and the QTLs were classified as additive
(|di/ai|<0.2), partially dominant (0.2|di/ai|<0.8), dominant (0.8|di/ai|<1.2), or
over-dominant (|di/ai|1.2).
Results
Linkage map construction
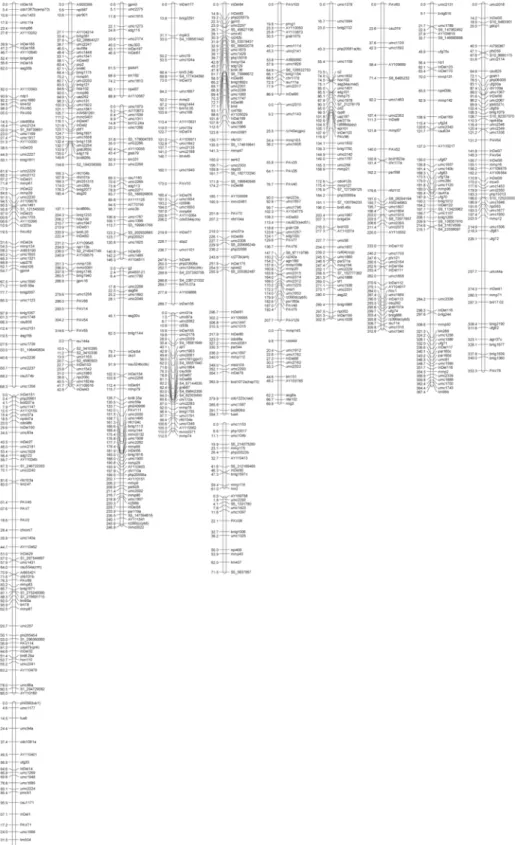
Fig 1. Linkage map generated from 302 individuals.Each chromosome is comprised of one or more LGs and each LG is represented by one bar. The bars of each chromosome were aligned vertically and not according to the order of chromosome framework. The numbers on the left of the bar represent the genetic position of markers as evaluated by the distance function of Kosambi in cM. The names on the right side of the bar indicate the markers.
Heterosis and population performance of KSRTs
KSRTs of all the populations in our study were evaluated bySmartGrain(Fig 3A). The image shows that the various outlines of seed traits could be recognized clearly (Fig 3B) and it indi-cates that KSRTs have been measured accurately. The mean values and heterosis of KL, KW, LWR, PL, KA, and CS for basic populations are listed inTable 1. For parental lines B73 and Mo17, the performance of KW, LWR, and KA differed significantly and the mean values of KW and KA in B73 were significantly lower than Mo17. Except for CS, the seed trait values of F1were significantly higher than the MP values. When comparing F1with two parental lines,
the mean values were greater than both of parents. This indicated that most of the KSRTs ex-hibited positive dominance, even overdominance effects. Only CS exex-hibited negative domi-nance effect. Heterosis of KSRTs was estimated via MPH. KA exhibited the highest level of MPH (>40%) among these seed traits, MPH values of KL and PL were>20%, and MPH values of KW and LWR were>10%. However, CS expressed very low levels of MPH.
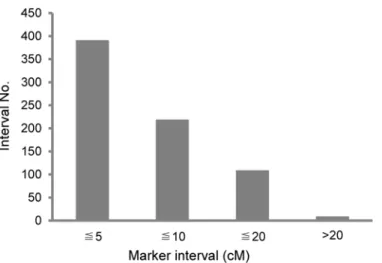
Fig 2. Overview of genetic distance between two adjacent markers on the linkage groups. doi:10.1371/journal.pone.0124779.g002
Fig 3. Images of kernel shape related traits detected bySmartGrain.(A) The loading image for
SmartGrain. The gray wire in the center of the image is used as the reference length. (B) KSRTs recognized bySmartGrain. The red outline can be used for calculating PL and KA (areas within the red line); The yellow and green lines indicate the KL and KW, respectively, and can also be used for calculating LWR and CS; The small red circle and green circle represent the center of gravity and the intersection of length and width, respectively, as evaluated bySmartGrain. These values are not included in our analysis.
The maximum, minimum, and mean values of four populations across three blocks are shown inTable 2. The performance of all seed traits for RILs (Table 2) was almost at the same level with the MP of the parents (Table 1). This stable mean value demonstrates that there was no interference in the artificial selection during the continuous self-pollination program for creating the RIL population from F1. Meanwhile, the maximum and minimum values of RIL
traits were more extreme than those of the high value parent and low value parent, respectively. Thus, the RILs displayed extensive variation beyond the parents. When we compare the perfor-mance of RILs (Table 2) and F1(Table 1), F1values fall into the range between the maximum
and minimum values of RILs for all KSRTs. This indicates the moderate MPH of KSRTs. With respect to TC progenies, mean values of TC(M) were significantly higher than TC(B) for KL, KW, PL, and KA. On the contrary, the values were significantly lower for LWR (Table 2) which is consistent with the observation of parental Mo17 to B73 and confirms the contribution of beneficial alleles donated from Mo17 and B73, respectively, to the former traits and the latter trait. As expected, both of the means of crossed heterozygous progenies from TC (B) and TC(M) populations exceeded significantly any homozygous parent of RIL, B73, and Table 1. Mean values and heterosis based on the three blocks.
Generation KL (mm) KW (mm) LWR PL (mm) KA (mm2) CS
B73 8.38±0.35 6.60±0.42 1.23±0.03 25.48±1.41 41.25±2.88 0.81±0.01
Mo17a 8.96±0.65 7.87±0.27
** 1.14±0.04* 28.06±1.84 50.57±5.92* 0.81±0.01
MP 8.51±0.43 7.23±0.35 1.18±0.03 26.77±1.53 45.91±4.17 0.81±0.01
F1b 10.99±0.47** 8.08±0.43* 1.39±0.02** 32.40±1.52** 67.21±6.70** 0.8O±0.01
MPH (%) 26.8±2.53 14.54±3.10 17.97±3.83 21.11±2.36 46.33±4.64 -1.23±1.97
*P0.05,
**P0.01.
aComparison between B73 and Mo17 usingttest. bComparison between MP and F1 usingttest.
doi:10.1371/journal.pone.0124779.t001
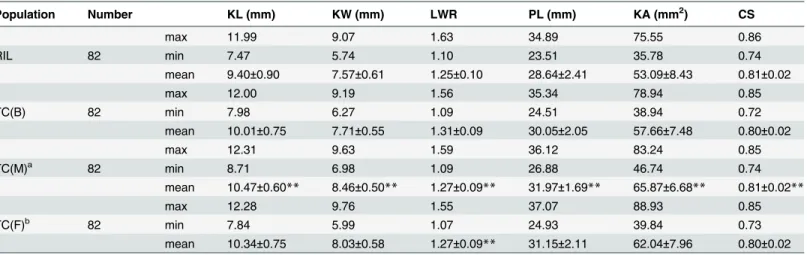
Table 2. Maximum, minimum, and mean values of RIL and TC populations based on three blocks.
Population Number KL (mm) KW (mm) LWR PL (mm) KA (mm2) CS
max 11.99 9.07 1.63 34.89 75.55 0.86
RIL 82 min 7.47 5.74 1.10 23.51 35.78 0.74
mean 9.40±0.90 7.57±0.61 1.25±0.10 28.64±2.41 53.09±8.43 0.81±0.02
max 12.00 9.19 1.56 35.34 78.94 0.85
TC(B) 82 min 7.98 6.27 1.09 24.51 38.94 0.72
mean 10.01±0.75 7.71±0.55 1.31±0.09 30.05±2.05 57.66±7.48 0.80±0.02
max 12.31 9.63 1.59 36.12 83.24 0.85
TC(M)a 82 min 8.71 6.98 1.09 26.88 46.74 0.74
mean 10.47±0.60** 8.46±0.50** 1.27±0.09** 31.97±1.69** 65.87±6.68** 0.81±0.02**
max 12.28 9.76 1.55 37.07 88.93 0.85
TC(F)b 82 min 7.84 5.99 1.07 24.93 39.84 0.73
mean 10.34±0.75 8.03±0.58 1.27±0.09** 31.15±2.11 62.04±7.96 0.80±0.02
**P0.01.
aComparison between TC(B) and TC(M) usingttest.
bComparison between TC(F) and the mean of TC(B) and TC(M) usingttest.
Mo17 populations for most of KSRTs (data not shown). This indicates the prevalence of heter-osis. Additionally, only LWR exhibited significant difference between the mean of TC(F) and the mean of TC(B) and TC(M). Furthermore, the mean of TC(F) trended higher than the ho-mozygous parent RIL mean and lower than the heterozygous parent F1mean for most of the
KSRTs. The CS of progenies did not exceed that of any parent. The phenotypic performance difference seems to be relative with heterozygosity (F1>TC(F)>RIL).
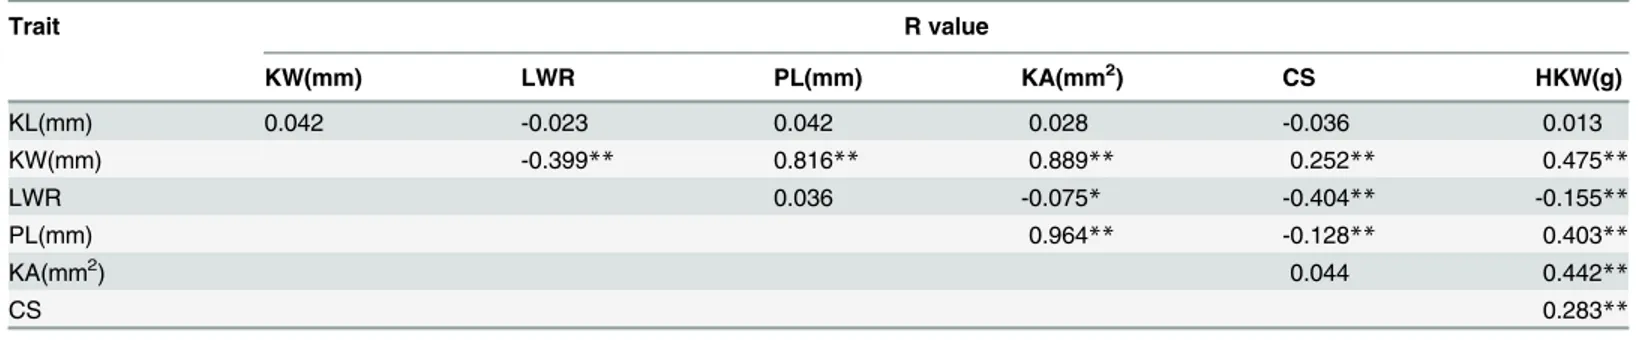
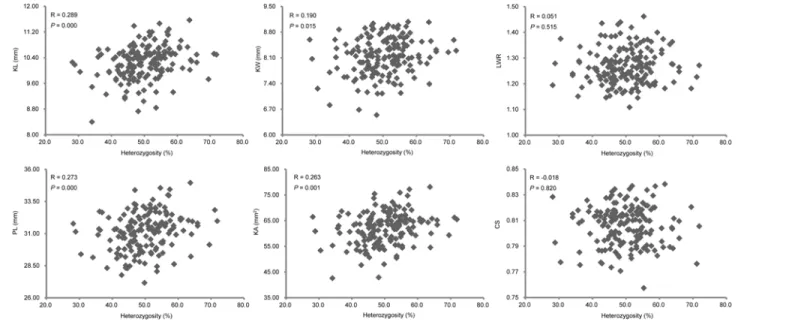
To further explore the relationship between the heterozygosity and the KSRTs, we investi-gated the correlations between the heterozygous levels of TC(B) and TC(M) individuals (based on the homozygous proportion of RILs inherited from B73 and Mo17) and their KSRTs (S3 Table). Four out of the six traits exhibited significant positive correlation with heterozygosity (Fig 4). However, the Pearson’s R values showed that the correlations between the heterozygos-ity and the KSRTs were not strong. In the meanwhile, the correlations among KSRTs and be-tween KSRTs and HKW were detected (Table 3). Among KSRTs, KL was not correlated with other KSRTs, whereas KW was statistically significant correlated with the KSRTs except KL. The strongest correlation was found between PL and KA in which the R values was up to 0.964. Four KSRTs were shown to be significant positive correlation with HKW, and significant nega-tive correlation was found between LWR and HKW. The correlation between KL and HKW was not existed according to the correspondingPvalue.
Identification of QTLs affecting kernel shape
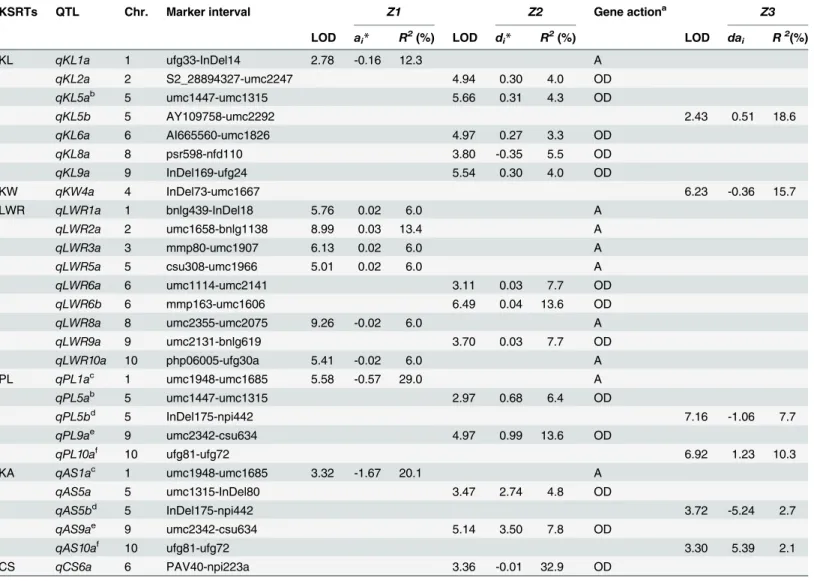
QTL analysis was carried out based onZ1,Z2, andZ3of three blocks. The putative QTL was declared significant whenP0.001 andR2>5% or whenP0.001 and LOD>3.0 (0<R25%). In total, 28 QTLs for KSRTs were detected in threeZtransformations with some QTLs related to different traits located within the same QTL regions (Table 4). The contribution of a single QTL to total phenotypic variation ranged from 2.1% to 32.9% with 18 QTLs>5% (Table 4). The majority of LOD values exceeded the 3.0 with a maximum of 9.3. However, the LOD of two QTLs did not achieve the threshold with a minimum of 2.4 (data not shown).
Seven QTLs were detected for KL: five inZ2and one in bothZ1andZ3(Table 4). These QTLs were mapped on six chromosomes. Despite five dominant QTLs detected inZ2that were all characterized by overdominance, these QTLs could not be considered as major QTLs due to lowR2values (3.3%-5.5%). However, these dominant QTLs found inZ2explained 21.0% of total phenotypic variance. The negative additive QTL detected inZ1located within the marker region of ufg33-InDel14 on chromosome 1 accounted for 12.3% of the phenotypic variation which indicates that an allele from the longer kernel parent Mo17 contributed to Table 3. The Pearson’s R correlation values among KSRTs, and between KSRTs and HKW.
Trait R value
KW(mm) LWR PL(mm) KA(mm2) CS HKW(g)
KL(mm) 0.042 -0.023 0.042 0.028 -0.036 0.013
KW(mm) -0.399** 0.816** 0.889** 0.252** 0.475**
LWR 0.036 -0.075* -0.404** -0.155**
PL(mm) 0.964** -0.128** 0.403**
KA(mm2) 0.044 0.442
**
CS 0.283**
*P0.05,
**P0.01.
improving kernel length. InZ3, one epistasis QTL was examined which explained 18.6% of the phenotypic variation.
There was only one QTL detected for KW (Table 4):qKW4awas identified inZ3, mapped on chromosome 4, accounted for 15.7% of the phenotypic variation, and displayed an epistasis effect. It is suggested that the dominance × additive epistatic interaction might have an effect on kernel width.
Nine QTLs were identified for LWR: six inZ1and three inZ2(Table 4). These QTLs were dispersed on chromosomes 1, 2, 3, 5, 8, and 10 (one QTL per chromosome forZ1) as well as on 6 and 9 (forZ2). The QTLs inZ1exhibited additive effects and QTLs inZ2displayed overdom-inant effects. Among additive QTLs, four were positive and two were negative, indicating that alleles from both large LWR parent B73 and small LWR parent Mo17 were beneficial for in-creasing LWR. The LOD of additive QTLs were all greater than 5.0, and their contribution ran-ged from 6.0% to 13.4%. Two of three dominant QTLs were located on chromosome 6 and the other was on chromosome 9. They were all classified as positive overdominance, explaining in-dividually between 7.7% and 13.6% of total variation. QTLs detected inZ1accounted for 43.2% of total phenotypic variation due to additive effects, whereas QTLs identified inZ2accounted for 29.0% of total phenotypic variation due to dominance effects.
Five QTLs were found for PL: one inZ1and two in bothZ2andZ3(Table 4). The QTL found inZ1contributed 28.6% to total phenotypic variation and exhibited a negative additive effect. This indicates that an allele from high PL parent Mo17 contributed to improving PL. Two QTLs identified inZ2were located on chromosomes 5 and 9, respectively, and both showed positive dominant effects with overdominance classification. The simultaneous fit of two overdominant QTLs accounted for 20.0% of total variation (6.4% and 13.6% each). More-over,qPL5aflanked with umc1447 and umc1315 shared a genomic region with overdominant qKL5adetected inZ2for KL. ForZ3, two QTLs found in chromosomes 5 and 10, respectively, exhibited opposite epistatic effects and explained 7.3% and 10.7% of total variation each.
Likewise, five QTLs were detected for KA: one inZ1and two in bothZ2andZ3(Table 4). The mapped genetic position and the orientation of genetic effects of QTLs for KA were almost exactly the same as the five QTLs for PL, except forqAS5aandqPL5awith two mapping Fig 4. The relationship between heterozygosity and KSRTs based on TC(B) and TC(M) populations.
positions closely linked. In addition, the contribution to total variation explained by individual QTLs of KA was all lower than those of PL.
For CS, only one QTL were found. The QTL detected inZ2was mapped on chromosome 6. This overdominant QTL accounted for 32.9% of total variation which was the maximum con-tribution of all individual QTLs detected.
Analysis of digenic interaction affecting KSRTs
Digenic epistasis for QTLs detected inZ1andZ2was determined based on an analysis of mark-er pairs ovmark-er the whole genome. The epistatic effects detected inZ1andZ2are referred to as additive × additive and dominance × dominance interaction effects, respectively. InZ1, the in-teraction genetic regions were found for all traits, whereas, only three traits inZ2(KL, LWR, and CS) were found to possess digenic interaction.Table 5shows the digenic epistasis detected Table 4. QTLs for KSRTs detected inZ1,Z2, andZ3.
KSRTs QTL Chr. Marker interval Z1 Z2 Gene actiona Z3
LOD ai* R2(%) LOD di
* R2(%) LOD dai R2(%)
KL qKL1a 1 ufg33-InDel14 2.78 -0.16 12.3 A
qKL2a 2 S2_28894327-umc2247 4.94 0.30 4.0 OD
qKL5ab 5 umc1447-umc1315 5.66 0.31 4.3 OD
qKL5b 5 AY109758-umc2292 2.43 0.51 18.6
qKL6a 6 AI665560-umc1826 4.97 0.27 3.3 OD
qKL8a 8 psr598-nfd110 3.80 -0.35 5.5 OD
qKL9a 9 InDel169-ufg24 5.54 0.30 4.0 OD
KW qKW4a 4 InDel73-umc1667 6.23 -0.36 15.7
LWR qLWR1a 1 bnlg439-InDel18 5.76 0.02 6.0 A
qLWR2a 2 umc1658-bnlg1138 8.99 0.03 13.4 A
qLWR3a 3 mmp80-umc1907 6.13 0.02 6.0 A
qLWR5a 5 csu308-umc1966 5.01 0.02 6.0 A
qLWR6a 6 umc1114-umc2141 3.11 0.03 7.7 OD
qLWR6b 6 mmp163-umc1606 6.49 0.04 13.6 OD
qLWR8a 8 umc2355-umc2075 9.26 -0.02 6.0 A
qLWR9a 9 umc2131-bnlg619 3.70 0.03 7.7 OD
qLWR10a 10 php06005-ufg30a 5.41 -0.02 6.0 A
PL qPL1ac 1 umc1948-umc1685 5.58 -0.57 29.0 A
qPL5ab 5 umc1447-umc1315 2.97 0.68 6.4 OD
qPL5bd 5 InDel175-npi442 7.16 -1.06 7.7
qPL9ae 9 umc2342-csu634 4.97 0.99 13.6 OD
qPL10af 10 ufg81-ufg72 6.92 1.23 10.3
KA qAS1ac 1 umc1948-umc1685 3.32 -1.67 20.1 A
qAS5a 5 umc1315-InDel80 3.47 2.74 4.8 OD
qAS5bd 5 InDel175-npi442 3.72 -5.24 2.7
qAS9ae 9 umc2342-csu634 5.14 3.50 7.8 OD
qAS10af 10 ufg81-ufg72 3.30 5.39 2.1
CS qCS6a 6 PAV40-npi223a 3.36 -0.01 32.9 OD
aDegree of dominance: additive (A, |d
i*/ai*|<0.2), partially dominant (PD, 0.2|di*/ai*|<0.8), dominant (D, 0.8|di*/ai*|<1.2), and overdominant (OD, |di*/ ai*|1.2).
b, c, d, e, findicates marker intervals that were mapped to more than one QTL.
KSRTs Chr. Marker interval Chr. Marker interval LOD ai a aj a aaij a
R2i(%)b R 2
j(%)b R 2
ij(%)b R 2
(%)b
KL Z1 4 umc2176-umc2039c 1 ufg33-InDel14d 3.05 0.02 -0.13** -0.12 0.3 12.1 10.3 10.3
Z2 5 AY109995-umc1447 5 umc104b-S5_214075260 5.08 0.31** 0.13 -0.14 8.7 1.5 1.8 11.7 7 rz404-umc1865 4 bnl10.05-umc158 4.30 -0.10 -0.13 0.29** 0.9 1.5 7.6
8 psr598-nfd110 4 umc2176-umc2039c 3.97 -0.44
** 0.05 0.16 17.5 0.2 2.3
KW Z1 2 npi587-psr901 1 ufg33-InDel14d 10.87 -0.01 -0.01 -0.12** 0.1 0.1 11.8 78.8 2 AY109575-mmp138 5 S5_53078437-S5_56902078 8.45 -0.04 -0.06 -0.18** 1.3 3.0 26.5
3 umc59e-phi243966 1 S1_294729082-AY110160 4.08 0.00 0.00 0.09** 0.0 0.0 6.6 3 AY111541-rz390c 5 umc1747-InDel86 4.61 -0.02 -0.01 -0.09** 0.3 0.1 6.6 3 jpsb79-lim331 7 umc1787-umc258 7.47 0.00 0.00 0.11** 0.0 0.0 9.9 4 InDel67-InDel68 5 php15018-mmp154 5.23 0.01 -0.01 0.09** 0.1 0.1 6.6 6 S6_128522753-bnlg1154 5 InDel24-mmp124 2.93 -0.01 0.01 -0.07** 0.1 0.1 4.0 6 mmp16-AY109876 5 umc43-rz242b 4.32 0.01 0.01 0.09** 0.1 0.1 6.6
LWR Z1 1 csu374b-umc1358 5 php20566-S5_200685249 5.83 0.00 0.00 -0.02** 0.0 0.0 6.3 30.1 3 umc1907-rz296b 4 umc2176-umc2039c 5.41 0.02
** 0.00 -0.01 6.3 0.0 1.6 3 umc2268-csu1183 7 sdg101-mmp75 3.65 -0.02** 0.00 -0.03** 6.3 0.0 14.2 3 bnlg1113-mmp144 9 ufg24-umc2342 5.09 0.00 0.00 0.02** 0.0 0.0 6.3 4 PAV10-InDel76 1 bnlg439-InDel18 5.61 0.00 0.02** -0.01 0.0 6.3 1.6
Z2 3 mmp144-mmc0132 9 umc2131-bnlg619 5.09 0.00 0.04** 0.02 0.0 12.7 3.2 20.7 6 umc1114-umc2141 4 umc2176-umc2039c 3.89 0.04
** 0.02 0.02 12.7 3.2 3.2 6 mmp108b-mmp20 10 umc2114-csu625 4.14 0.00 0.00 -0.03** 0.0 0.0 7.2 8 umc1483-umc2352 1 AY109678-umc1461 4.46 -0.01 0.01 -0.03** 0.8 0.8 7.2 PL Z1 4 umc2176-umc2039c 1 umc1948-umc1685 3.98 -0.09 -0.49
** -0.24 0.7 20.9 5.0 7.8 9 csu634-AY110217 4 umc2176-umc2039c 4.86 0.95
** -0.25 0.31 25.8 1.8 2.8
KA Z1 8 S8_72977857-umc2355 1 umc1403-umc11a 4.91 0.10 -0.07 -3.21** 0.0 0.0 17.0 17.0 CS Z1 2 InDel45-prp2 10 phi059-S10_8660170 4.95 0.00 0.00 -0.01** 0.0 0.0 31.1 62.2
3 php20521-umc1825 2 mmc0401-InDel47 6.41 0.00 0.00 -0.01** 0.0 0.0 31.1
Z2 2 umc1658-bnlg1138 5 nfd104a-umc51a 4.20 0.00 0.00 0.01** 0.0 0.0 27.7 55.3 4 bnlg1444-bnl10.05 5 mmp154-sdg129 6.90 0.00 0.00 -0.01** 0.0 0.0 27.7
**P0.01.
aa
iandajrepresent the main effect of the lociiandj, andaijrepresents the epistatic effect between lociiandj. bR2
i,R2j,R2ij, andR2represent the genetic contribution via the percentage of the total variation explained by theai,aj,aijand the total interactions for KSRTs respectively. c, dindicate marker intervals mapped to more than one QTL.
inZ1andZ2, excluding those withR2ijof zero. Totally, there were 28 pairs of digenic epistasis
detected for all traits inZ1andZ2. The number of the digenic interaction pairs for each KSRT ranged from one for KA to nine for LWR.
The majority of interaction effects detected in the KSRTs were determined to be significant. The digenic epistatic effects were all significant for KW, KA, and CS. However, there was no significant epistatic interaction detected for PL. InTable 5, most of the single genetic regions which displayed no or a small contribution to phenotypic variation could account for large proportions of total variation when two genetic regions interacted. For example, no single locus detected in CS could be shown as contributing to phenotypic variation. However, two locus interactions could both explain ~30% of total variation. There were also some cases where the percentage of total variation due to digenic interaction was obviously lower than that due to a single locus. For example, two genetic regions detected inZ1for PL accounted for 25.8% and 1.8% of total variation, respectively, but the contribution to total variation explained by their digenic interaction was 2.8%. In addition, the proportion of total variation explained by epistatic interactions detected inZ1andZ2ranged from 1.6% to 31.1%. InZ1, the maxi-mum proportion of variation explained by all additive × additive interactions was 78.8% for KW. This is consistent with the observation that epistatic QTL was detected inZ3without any significant additive or dominant QTLs detected inZ1orZ2for KW. This suggests that epistasis interaction may play an essential role in determining maize KW. InZ2, the highest totalR2was 55.3% for CS and resulted from a dominance × dominance interaction.
The majority of genetic regions detected in digenic epistasis analysis exhibited interaction with one another genetic region. However, some digenic epistatic regions were found to have simultaneous interaction with multiple regions. The genetic regions flanked by umc2176 and umc2039 were discovered to have epistatic interactions with various loci for the three traits KL, LWR, and PL. These involved both additive × additive and dominance × dominance interac-tions which indicate that kernel shape may be regulated by digenic epistasis at this region. Like-wise, additive × additive epistatic interactions were found between the genetic region enclosed by ufg33 and InDel14 and two other loci for both KL and KW. Furthermore, this common in-teractive region was found to be shared with an additive QTL for KL. Most of loci exhibited main-effect and digenic epistatic effect contributing to the same trait (e.g., psr598-nfd110 for KL and bnlg439-InDel18, umc1114-umc2141, and umc2131-bnlg619 for LWR). We also found that the genetic region of umc1658-bnlg1138 on chromosome 2 mapped with an addi-tive QTL for LWR and contributed to CS via a dominance × dominance interaction with the genetic region on chromosome 5. However, it should be noted that the majority of interactive regions were not mapped with main-effect QTLs. Moreover, no two regions showing digenic interaction were found to both co-locate with main-effect QTLs. In addition, the genetic region harboring an epistatic QTL detected inZ3was not shown to interact with other
genetic regions.
Discussion
Heterosis, mode of gene action for KSRTs, and their utilization in maize
breeding
the grain yield if ear diameter remains unchanged. Therefore, the long KL type is expected to be the initial kernel shape trait in breeding programs.
In present study, the highest MPH was 46.33% for KA which was followed by KL (26.8%). It seems that the KSRTs exhibited modest heterosis levels. For traits showing strong heterosis, their MPH level might be more than 100%. For example, MPH of seedling dry weight and number of kernels per plant were found to exceed 100% and even that of grain yield could reach 239% when maize inbred line B73 was crossed with H99 [41]. It is not surprising that dif-ferent traits expressed various heterosis levels due to the cross between particular maize inbred lines. According to the interpretation of MPH defined by Melchinger et al. [46], MPH can be expressed as the sum of augmented dominance QTL effects. In the formula, the augmented dominance effect is denoted as the dominance effect minus half the sum of its
additive × additive interactions. Thus, the dominance and additive × additive effects both con-tribute to MPH. For most of the KSRTs, augmented dominance QTLs were detected inZ2, ex-cept for KW which only displayed epistasis. The mode of gene action of augmented dominance QTLs were all overdominance, suggesting that overdominance or epistasis might contribute to these QTLs. To improve MPH for these traits, the sum of dominance effects of QTLs should in-crease to a greater extent than the sum of additive × additive interactions during breeding.
The augmented additive QTLs were also identified inZ1for four out of six KSRTs (exclud-ing KW and CS). The augmented additive effect at a QTL was considered as the net contribu-tion of the QTL to the parental difference in the presence of epistasis [46]. The contribucontribu-tion to phenotypic variation explained by an individual QTL for KL was 12.3%, indicating that selec-tion based on the augmented additive locus should be enhanced in the process of maize breed-ing. For all QTLs identified, the total variation explained by individual QTLs ranged from 2.1% to 32.9%. If marker-assisted selection (MAS) was used for KSRTs, the QTLs with minor contri-butions should not be abandoned because the selection for beneficial genotypes with more loci would improve the target phenotype value. However, MAS for epistatic QTLs should be cau-tious due to the difficulties in the prediction of epistatic effects.
In our study, the change in phenotypic values of KSRTs can be attributed to B73 and Mo17, implying that alleles from both parents contribute to KSRTs. For the complex traits, it is not difficult to understand that positive effects for different components might be provided by any parent which leads to the observation that the alleles from the two parents were both in favor of the whole complex trait. This has been observed in other studies. For example, the complex trait grain yield gained favorable alleles from both Zong3 and 87–1 parents [18]. Taken togeth-er, the occurrence of additive, dominant, and epistatic QTLs for components of KSRTs indi-cates the genetic complexity of KSRTs. To gain a better understanding of the genetic basis of complex maize KSRTs for their further utilization, the favorable genes should be isolated and characterized.
Comparison of QTLs for KSRTs
that KA has the close correlation with PL (Table 3). Moreover, several main-effect QTL regions for one trait expressed interaction with genomic regions for the same trait or another trait. Therefore, some QTL regions might play pleiotropic roles for different traits. On the other hand, traits that are closely linked might also lead to the co-localization for different traits.
To evaluate the consistency of QTLs for KSRTs, we collected the QTLs for KL and KW re-ported in recent studies [17,36]. The comparison results revealed the poor congruency among these QTLs. No QTLs were located on the same chromosomal bins. The inconsistency of QTLs for the same traits has been reported in previous studies [53,54]. The main cause of the discrep-ancy is usually attributed to genetic background differences which result from utilizing various mapping populations.
Interpretation of digenic interaction
In addition to main effect, epitasis was also exhibited large effect on complex traits in maize, es-pecially grain yield [55,56]. The types of digenic interactions including additive × additive, additive × dominance and dominance × dominance have been shown to exist in different pro-portions for the target traits. Additive × additive is usually more common than the other inter-active types. For instance, additive × additive epistatic interaction was the major interinter-active type among digenic interactions detected in maize grain yield and yield components using F2:3
populations [18]. In another study on maize kernel related traits, additive × additive interaction made up the highest proportion among all interactive types and displayed the large digenic epi-static effects on KL and kernel thickness [35].
In our present work, the proportion of 67.9% for additive × additive interactions detected in Z1versus 32.1% for dominance × dominance interactions detected inZ2illustrates the impor-tance of additive × additive digenic interactions for KSRTs. For KL, the contribution to total variation explained by individual additive × additive interactions was higher than that by dominance × dominance interaction. Moreover, for KW, the epistasis detected inZ3was all at-tributed to eight additive × additive interactions with a totalR2ijof 78.8%. Therefore,
additive × additive epistatic interactions between two loci may be the important genetic ele-ment for KL and KW. On the other hand, only one additive × additive interaction was detected for KA which had the highest MPH. This result demonstrates that reduced additive × additive interaction can increase the MPH for the trait according to the definition of Melchinger et al. [46]. Furthermore, there was no dominance × dominance digenic interaction found for KW, PL, or KA. This suggests that dominance × dominance digenic interactions might not be im-portant for heterosis of these traits.
However, most of the interactive genomic regions were not mapped with main-effect QTLs. The majority of the single loci were not significant for the KSRTs but exhibited significant inter-active effects. This finding is in agreement with a previous study which reported that 74.9% of significant epistatic interactions occurred between loci not linked with any QTL and that only a few interactive loci were coupled with main-effect QTLs [18]. These results indicate that some main-effect QTL regions could influence the genetic background of corresponding KSRTs.
It should be noted that high-order epistasis might influence on KSRTs even though proper evaluation could not be conducted due to the detection methods of our study. All inferences on epistatic interaction should be cautious when the size of mapping population is limited [57].
Supporting Information
S1 Table. The primer list of insertion/deletion (InDel) and presence/absence variations (PAV) markers anchored in the linkage groups (LGs).
S2 Table. The genotyping information of intermated B73 × Mo17 (IBM) recombinant in-bred lines (RILs) used for genetic likage group construction."A" and "B" represent the geno-type of B73 and Mo17 respectively, and "-" represents the missing genogeno-type. "S1_10096204" represents the single nucleotide polymorphism (SNP) occurred in the position 10096204 on Chromosome 1 of B73 reference genome (V2). The naming format is applicable for other SNPs.
(XLSX)
S3 Table. The homozygous proportion of intermated B73 × Mo17 (IBM) individuals and heterozygosity of TC(B) and TC(M) populations.
(XLSX)
Author Contributions
Conceived and designed the experiments: HZ TZ. Performed the experiments: LJ MG TZ. Ana-lyzed the data: LJ HZ TZ. Contributed reagents/materials/analysis tools: LJ MG. Wrote the paper: LJ TZ.
References
1. East EM. Heterosis. Genetics. 1936; 21: 375–397. PMID:17246801
2. Shull GH. The composition of a field of maize. J Hered. 1908;296–301.
3. Duvick DN, Cassman KG. Post-green revolution trends in yield potential of temperate maize in the North-Central United States. Crop Sci. 1999; 39: 1622–1630.
4. Duvick DN. The Contribution of Breeding to Yield Advances in maize (Zea maysL.). Adv Agron. 2005; 86: 83–145.
5. Duvick DN. Biotechnology in the 1930s: the development of hybrid maize. Nat Rev Genet. 2001; 2: 69– 74. PMID:11253074
6. Harberd NP, Freeling M. Genetics of dominant gibberellin-insensitive dwarfism in maize. Genetics. 1989; 121: 827–838. PMID:17246493
7. Winkler RG, Freeling M. Physiological genetics of the dominant gibberellin-nonresponsive maize dwarfs,Dwarf8andDwarf9. Planta. 1994; 193: 341–348.
8. Berger DK, Carstens M, Korsman JN, Middleton F, Kloppers FJ, Tongoona P, et al. Mapping QTL con-ferring resistance in maize to gray leaf spot disease caused byCercospora zeina. BMC Genet. 2014; 15: 60. doi:10.1186/1471-2156-15-60PMID:24885661
9. Tao Y, Jiang L, Liu Q, Zhang Y, Zhang R, Ingvardsen CR, et al. Combined linkage and association mapping reveals candidates forScmv1, a major locus involved in resistance to sugarcane mosaic virus (SCMV) in maize. BMC Plant Biol. 2013; 13: 162. doi:10.1186/1471-2229-13-162PMID:24134222
10. Gassmann AJ, Petzold-Maxwell JL, Clifton EH, Dunbar MW, Hoffmann AM, Ingber DA, et al. Field-evolved resistance by western corn rootworm to multipleBacillus thuringiensis toxinsin transgenic maize. P Natl Acad Sci USA. 2014; 111: 5141–5146. doi:10.1073/pnas.1317179111PMID:24639498
11. Mansfield BD, Mumm RH. Survey of plant density tolerance in US maize germplasm. Crop Sci. 2014; 54: 157–173.
12. Sangoi L. Understanding plant density effects on maize growth and development: an important issue to maximize grain yield. Ciência Rural. 2001; 31: 159–168.
13. Tollenaar M, Wu J. Yield improvement in temperate maize is attributable to greater stress tolerance. Crop Sci. 1999; 39: 1597–1604.
14. Raun WR, Johnson GV. Improving nitrogen use efficiency for cereal production. Agron J. 1999; 91: 357–363.
15. Hirel B, Bertin P, Quilleré I, Bourdoncle W, Attagnant C, Dellay C, et al. Towards a better understanding of the genetic and physiological basis for nitrogen use efficiency in maize. Plant Physiol. 2001; 125: 1258–1270. PMID:11244107
17. Peng B, Li Y, Wang Y, Liu C, Liu Z, Tan W, et al. QTL analysis for yield components and kernel-related traits in maize across multi-environments. Theor Appl Genet. 2011; 122: 1305–1320. doi:10.1007/ s00122-011-1532-9PMID:21286680
18. Yan J, Tang H, Huang Y, Zheng Y, Li J. Quantitative trait loci mapping and epistatic analysis for grain yield and yield components using molecular markers with an elite maize hybrid. Euphytica. 2006; 149: 121–131.
19. Zhang G, Wang X, Wang B, Tian Y, Li M, Nie Y, et al. Fine mapping a major QTL for kernel number per row under different phosphorus regimes in maize (Zea maysL.). Theor Appl Genet. 2013; 126: 1545–1553. doi:10.1007/s00122-013-2072-2PMID:23494393
20. Liu XH, He SL, Zheng ZP, Huang YB, Tan ZB, Wu X. QTL identification for row number per ear and grain number per row in maize. Maydica. 2010; 55: 127.
21. Li M, Guo X, Zhang M, Wang X, Zhang G, Tian Y, et al. Mapping QTLs for grain yield and yield compo-nents under high and low phosphorus treatments in maize (Zea maysL.). Plant Sci. 2010; 178: 454–462.
22. Messmer R, Fracheboud Y, Bänziger M, Vargas M, Stamp P, Ribaut J. Drought stress and tropical maize: QTL-by-environment interactions and stability of QTLs across environments for yield compo-nents and secondary traits. Theor Appl Genet. 2009; 119: 913–930. doi:10.1007/s00122-009-1099-x PMID:19597726
23. Doebley JF, Gaut BS, Smith BD. The molecular genetics of crop domestication. Cell. 2006; 127: 1309– 1321. PMID:17190597
24. Revilla P, Butrón A, Malvar RA, Ordás RA. Relationship among kernel weight, early vigor, and growth in maize. Crop Sci. 1999; 39: 654–658.
25. Guo T, Yang N, Tong H, Pan Q, Yang X, Tang J, et al. Genetic basis of grain yield heterosis in an "im-mortalized F2" maize population. Theor Appl Genet. 2014; 127: 2149–2158. doi: 10.1007/s00122-014-2368-xPMID:25104328
26. Li C, Li Y, Sun B, Peng B, Liu C, Liu Z, et al. Quantitative trait loci mapping for yield components and kernel-related traits in multiple connected RIL populations in maize. Euphytica. 2013; 193: 303–316.
27. Qiu X, Gong R, Tan Y, Yu S. Mapping and characterization of the major quantitative trait locus qSS7 as-sociated with increased length and decreased width of rice seeds. Theor Appl Genet. 2012; 125: 1717– 1726. doi:10.1007/s00122-012-1948-xPMID:22864386
28. Wan X, Weng J, Zhai H, Wang J, Lei C, Liu X, et al. Quantitative trait loci (QTL) analysis for rice grain width and fine mapping of an identified QTL allelegw-5in a recombination hotspot region on chromo-some 5. Genetics. 2008; 179: 2239–2252. doi:10.1534/genetics.108.089862PMID:18689882
29. Ramya P, Chaubal A, Kulkarni K, Gupta L, Kadoo N, Dhaliwal HS, et al. QTL mapping of 1000-kernel weight, kernel length, and kernel width in bread wheat (Triticum aestivumL.). J Appl Genet. 2010; 51: 421–429. PMID:21063060
30. Sun X, Wu K, Zhao Y, Kong F, Han G, Jiang H, et al. QTL analysis of kernel shape and weight using re-combinant inbred lines in wheat. Euphytica. 2009; 165: 615–624.
31. Breseghello F, Sorrells ME. QTL analysis of kernel size and shape in two hexaploid wheat mapping populations. Field Crop Res. 2007; 101: 172–179.
32. Williams K, Sorrells ME. Three-dimensional seed size and shape QTL in hexaploid wheat (Triticum aestivumL.) populations. Crop Sci. 2014; 54: 98–110.
33. Xu Y, Li H, Li G, Wang X, Cheng L, Zhang Y. Mapping quantitative trait loci for seed size traits in soy-bean (Glycine max L. Merr.). Theor Appl Genet. 2011; 122: 581–594. doi:10.1007/s00122-010-1471-x PMID:20981403
34. Han Y, Li D, Zhu D, Li H, Li X, Teng W, et al. QTL analysis of soybean seed weight across multi-genetic backgrounds and environments. Theor Appl Genet. 2012; 125: 671–683. doi: 10.1007/s00122-012-1859-xPMID:22481120
35. Zhang Z, Liu Z, Hu Y, Li W, Fu Z, Ding D, et al. QTL Analysis of Kernel-Related Traits in Maize Using an Immortalized F2 Population. PLoS ONE. 2014; 9: e89645. doi:10.1371/journal.pone.0089645PMID: 24586932
36. Liu Y, Wang L, Sun C, Zhang Z, Zheng Y, Qiu F. Genetic analysis and major QTL detection for maize kernel size and weight in multi-environments. Theor Appl Genet. 2014; 127: 1019–1037. doi:10.1007/ s00122-014-2276-0PMID:24553962
37. Kearsey MJ, Jinks JL. A general method of detecting additive, dominance and epistatic variation for metrical traits. Heredity. 1968; 23: 403. PMID:5250122
39. Kusterer B, Piepho H, Utz HF, Schön CC, Muminovic J, Meyer RC, et al. Heterosis for biomass-related traits in Arabidopsis investigated by quantitative trait loci analysis of the triple testcross design with re-combinant inbred lines. Genetics. 2007; 177: 1839–1850. PMID:18039885
40. Li L, Lu K, Chen Z, Mu T, Hu Z, Li X. Dominance, overdominance and epistasis condition the heterosis in two heterotic rice hybrids. Genetics. 2008; 180: 1725–1742. doi:10.1534/genetics.108.091942 PMID:18791236
41. Frascaroli E, CanèMA, Landi P, Pea G, Gianfranceschi L, Villa M, et al. Classical genetic and
quantita-tive trait loci analyses of heterosis in a maize hybrid between two elite inbred lines. Genetics. 2007; 176: 625–644. PMID:17339211
42. Tanabata T, Shibaya T, Hori K, Ebana K, Yano M.SmartGrain: high-throughput phenotyping software for measuring seed shape through image analysis. Plant Physiol. 2012; 160: 1871–1880. doi:10.1104/ pp.112.205120PMID:23054566
43. Lee M, Sharopova N, Beavis WD, Grant D, Katt M, Blair D, et al. Expanding the genetic map of maize with the intermated B73 x Mo17 (IBM) population. Plant Mol Biol. 2002; 48: 453–461. PMID:11999829
44. Li L, Petsch K, Shimizu R, Liu S, Xu WW, Ying K, et al. Mendelian and non-mendelian regulation of gene expression in maize. PLoS Genet. 2013; 9: e1003202. doi:10.1371/journal.pgen.1003202PMID: 23341782
45. Wu Y, Bhat PR, Close TJ, Lonardi S. Efficient and accurate construction of genetic linkage maps from the minimum spanning tree of a graph. PLoS Genet. 2008; 4: e1000212. doi:10.1371/journal.pgen. 1000212PMID:18846212
46. Melchinger AE, Utz HF, Piepho H, Zeng Z, Schön CC. The role of epistasis in the manifestation of het-erosis: a systems-oriented approach. Genetics. 2007; 177: 1815–1825. PMID:18039883
47. Zeng ZB. Precision mapping of quantitative trait loci. Genetics. 1994; 136: 1457–1468. PMID:8013918
48. Jansen RC, Stam P. High resolution of quantitative traits into multiple loci via interval mapping. Genet-ics. 1994; 136: 1447–1455. PMID:8013917
49. Wang DL, Zhu J, Li Z, Paterson AH. Mapping QTLs with epistatic effects and QTL× environment inter-actions by mixed linear model approaches. Theor Appl Genet. 1999; 99: 1255–1264.
50. Qi H, Huang J, Zheng Q, Huang Y, Shao R, Zhu L, et al. Identification of combining ability loci for five yield-related traits in maize using a set of testcrosses with introgression lines. Theor Appl Genet. 2013; 126: 369–377. doi:10.1007/s00122-012-1985-5PMID:23011316
51. Peng B, Li Y, Wang Y, Liu C, Liu Z, Zhang Y, et al. Correlations and comparisons of quantitative trait loci with family per se and testcross performance for grain yield and related traits in maize. Theor Appl Genet. 2013; 126: 773–789. doi:10.1007/s00122-012-2017-1PMID:23183923
52. Li L, Sun C, Chen Y, Dai Z, Qu Z, Zheng X, et al. QTL mapping for combining ability in different popula-tion-based NCII designs: a simulation study. J Genet. 2013; 92: 529–543. PMID:24371174
53. Li YL, Niu SZ, Dong YB, Cui DQ, Wang YZ, Liu YY, et al. Identification of trait-improving quantitative trait loci for grain yield components from a dent corn inbred line in an advanced backcross BC2F2 popu-lation and comparison with its F2: 3 popupopu-lation in popcorn. Theor Appl Genet. 2007; 115: 129–140. PMID:17492267
54. Li YL, Li XH, Li JZ, Fu JF, Wang YZ, Wei MG. Dent corn genetic background influences QTL detection for grain yield and yield components in high-oil maize. Euphytica. 2009; 169: 273–284.
55. Ma XQ, Tang JH, Teng WT, Yan JB, Meng YJ, Li JS. Epistatic interaction is an important genetic basis of grain yield and its components in maize. Mol Breeding. 2007; 20: 41–51.
56. Tang J, Yan J, Ma X, Teng W, Wu W, Dai J, et al. Dissection of the genetic basis of heterosis in an elite maize hybrid by QTL mapping in an immortalized F2 population. Theor Appl Genet. 2010; 120: 333–340. doi:10.1007/s00122-009-1213-0PMID:19936698