The Impact of Company-Level ART Provision
to a Mining Workforce in South Africa: A
Cost
–
Benefit Analysis
Gesine Meyer-Rath1,2,3*, Jan Pienaar4, Brian Brink5, Andrew van Zyl6, Debbie Muirhead6, Alison Grant7, Gavin Churchyard6,7, Charlotte Watts8, Peter Vickerman9
1Department of Health Services Research and Policy, London School of Hygiene & Tropical Medicine,
London, United Kingdom,2Center for Global Health and Development, Boston University, Boston,
Massachusetts, United States of America,3Health Economics and Epidemiology Research Office,
Department of Internal Medicine, Faculty of Health Sciences, University of the Witwatersrand, Johannesburg, South Africa,4Highveld Hospital, Anglo American Coal, Emalahleni, South Africa,5Anglo American,
Johannesburg, South Africa,6The Aurum Institute, Johannesburg, South Africa,7Department of Clinical
Research, London School of Hygiene & Tropical Medicine, London, United Kingdom,8Department of Global
Health and Development, London School of Hygiene & Tropical Medicine, London, United Kingdom,
9School of Social and Community Medicine, University of Bristol, Bristol, United Kingdom
Abstract
Background
HIV impacts heavily on the operating costs of companies in sub-Saharan Africa, with many companies now providing antiretroviral therapy (ART) programmes in the workplace. A full cost–benefit analysis of workplace ART provision has not been conducted using primary
data. We developed a dynamic health-state transition model to estimate the economic impact of HIV and the cost–benefit of ART provision in a mining company in South Africa
between 2003 and 2022.
Methods and Findings
A dynamic health-state transition model, called the Workplace Impact Model (WIM), was parameterised with workplace data on workforce size, composition, turnover, HIV inci-dence, and CD4 cell count development. Bottom-up cost analyses from the employer per-spective supplied data on inpatient and outpatient resource utilisation and the costs of absenteeism and replacement of sick workers. The model was fitted to workforce HIV prev-alence and separation data while incorporating parameter uncertainty; univariate sensitivity analyses were used to assess the robustness of the model findings. As ART coverage increases from 10% to 97% of eligible employees, increases in survival and retention of HIV-positive employees and associated reductions in absenteeism and benefit payments lead to cost savings compared to a scenario of no treatment provision, with the annual cost of HIV to the company decreasing by 5% (90% credibility interval [CrI] 2%–8%) and the
mean cost per HIV-positive employee decreasing by 14% (90% CrI 7%–19%) by 2022. This
translates into an average saving of US$950,215 (90% CrI US$220,879–US$1.6 million) OPEN ACCESS
Citation:Meyer-Rath G, Pienaar J, Brink B, van Zyl A, Muirhead D, Grant A, et al. (2015) The Impact of Company-Level ART Provision to a Mining Workforce in South Africa: A Cost–Benefit Analysis. PLoS Med 12(9): e1001869. doi:10.1371/journal.pmed.1001869
Academic Editor:Joshua A. Salomon, Harvard School of Public Health, UNITED STATES
Received:August 15, 2014
Accepted:July 17, 2015
Published:September 1, 2015
Copyright:© 2015 Meyer-Rath et al. This is an open access article distributed under the terms of the
Creative Commons Attribution License, which permits unrestricted use, distribution, and reproduction in any medium, provided the original author and source are credited.
Data Availability Statement:The fully
parameterised model which incorporates all data and which was used to produce all projections within this paper can be downloaded from OpenBU viahttp:// hdl.handle.net/2144/10817.
per year; 80% of these cost savings are due to reductions in benefit payments and inpatient care costs. Although findings are sensitive to assumptions regarding incidence and absen-teeism, ART is cost-saving under considerable parameter uncertainty and in all tested sce-narios, including when prevalence is reduced to 1%—except when no benefits were paid
out to employees leaving the workforce and when absenteeism rates were half of what data suggested. Scaling up ART further through a universal test and treat strategy doubles sav-ings; incorporating ART for family members reduces savings but is still marginally cost-sav-ing compared to no treatment. Our analysis was limited to the direct cost of HIV to
companies and did not examine the impact of HIV prevention policies on the miners or their families, and a few model inputs were based on limited data, though in sensitivity analysis our results were found to be robust to changes to these inputs along plausible ranges.
Conclusions
Workplace ART provision can be cost-saving for companies in high HIV prevalence settings due to reductions in healthcare costs, absenteeism, and staff turnover. Company-spon-sored HIV counselling and voluntary testing with ensuing treatment of all HIV-positive employees and family members should be implemented universally at workplaces in coun-tries with high HIV prevalence.
Introduction
HIV disease hits adults in the prime of their working lives. Companies therefore take a heavy toll in countries with high HIV prevalence [1,2]. To counter this, some companies provide their workforce with a number of HIV services, ranging from prevention activities to HIV test-ing and antiretroviral therapy (ART).
While several companies in sub-Saharan Africa started ART programmes from 2002 onwards [3–5], quantifying these programmes’costs and benefits has proven difficult [3]. Even in sophisticated in-house medical programmes, longitudinal data collection is fraught with dif-ficulty, and the relationship between costs and benefits, such as regained productivity, can be hard to establish [3]. This makes it hard for companies to plan and budget for additional HIV-specific health programmes, and impossible to ascertain the programme’s impact on the com-pany’s operations and profits.
HIV disease increases rates of absenteeism, labour force turnover, and, ultimately, the costs of company operations in sub-Saharan Africa. A number of studies have quantified the impact of HIV on labour forces in the region, with the cost of HIV ranging from 0.7% of wages [6] or 1% of labour cost [7] to 1%–9% of profits [8]. Only one study, amongst Kenyan tea pluckers, has estimated the impact of HIV on the productivity of a single worker, finding an 18% decrease in earnings in the year before termination amongst HIV-positive workers [9], in a set-ting where earnings are directly related to productivity.
South Africa is the sub-Saharan African country with the largest number of people living with HIV [10,11], with 18.8% of the working-age population (15–49 y old) being HIV infected [12]. In the last large-scale survey of 22 companies in South Africa, between 1999 and 2005, the workforce HIV prevalence in a non-representative sample averaged 11% [13], though estimates varied over time and between industries [3,13]. Similarly, the costs of HIV vary, with the esti-mated increase due to HIV in the cost of doing business (termed AIDS“tax”[1]) ranging from
Competing Interests:GC is employed by the Aurum Institute, which received a small donation over the past few years from the Anglo American Chairman’s fund. At the time of conception and design, acquisition of data, analysis and interpretation of data as well as at the time of the drafting of the article and revising it critically for important intellectual content, BB was employed by Anglo American as their Chief Medical Officer (previously designated Senior Vice President: Medical and/or Group Medical Consultant). He retired from Anglo American on 31st December 2014, but continued to have a part-time consultancy contract with the Company. The research work was carried out through the health services of Anglo American Coal mines in South Africa, for which BB was responsible for overarching professional oversight as Chief Medical Officer of Anglo American plc. The research work was partly funded by Anglo American Operations Limited, through a budget for which he was responsible. BB is an independent non-executive director of Right to Care (nonprofit company), which has a close working relationship with GMR’s Health Economics and Epidemiology Research Office through shared directors.
0.4% to 5.9% of the annual wage bill of six South African companies in 2001 [1,2], or a 0.6%– 10.8% increase in labour costs amongst companies from six countries in sub-Saharan Africa [3]. The cost per employee also varies considerably by skill level [2]. None of these studies, however, included the impact of workplace ART provision.
HIV care, including ART, has been provided by mining companies in South Africa since 2002, predating ART provision in the public sector [4,5]. While there are numerous estimates of the cost [14–27] and cost-effectiveness [28–45] of public sector ART provision in South Africa, the cost and impact of private sector ART provision at the workplace level have not yet been established. And while some aspects of this impact have been estimated in other coun-tries, such as Kenya [46–50], Botswana [50], and Uganda [51], none of these estimates included productivity as well as healthcare costs, and none was a full cost–benefit analysis based on real-world programme data. In order to provide evidence for company management and policy-makers alike, we evaluated the impact and cost of both HIV and ART in a mining company in South Africa, and analysed the incremental cost–benefit balance of the company’s ART pro-gramme compared to no ART provision.
Methods
Workplace under Study
We report on the ART programme of a coal mining company operating at a number of collier-ies in Mpumalanga province since 2002. The programme is run from the mines’own clinics and hospitals and provides care for employees, contractors, and employees’dependants. Annual anonymous HIV counselling and testing (HCT) campaigns in the mines provide easy access to testing. HIV-positive employees are enrolled in an HIV wellness programme that pro-vides CD4 cell count testing every 3 mo and interventions, such as isoniazid and cotrimoxazole prophylaxis, for the prevention and treatment of opportunistic infections. Employees were ini-tiated on ART once their CD4 cell count was at or below 250 cells/mm3during the period 2003–2007, or at or below 350 cells/mm3during 2008–2010, or if presenting with WHO stage 3/4 disease, and their CD4 cell count and viral load (VL) were monitored twice annually there-after. By the end of 2010, out of 9,252 employees, 1,149 had tested HIV positive in confirma-tory tests and had been enrolled in the company’s wellness programme. Since 2002, 629 employees have been initiated on ART, with 555 employees retained on ART by the end of 2010.
Model Description
employees, and the incremental costs of the ART programme itself, of additional outpatient and inpatient healthcare, and of absenteeism and workforce turnover (Fig 1).
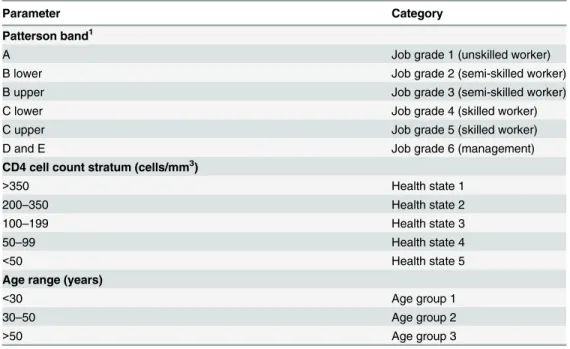
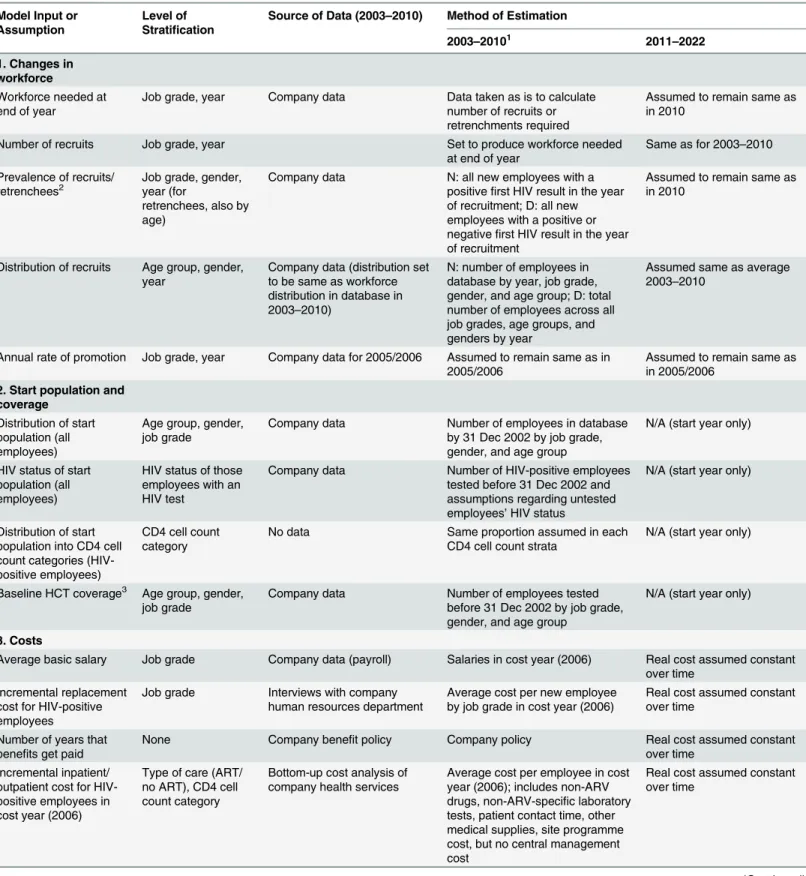
In order to capture important differences in survival and/or in healthcare and absenteeism costs, the HIV-infected workforce is divided into two genders, three age groups, six job grades, and five CD4-cell-count-defined health states, although not every parameter is differentiated by all four categories.Table 1summarises the population categories used in the model;Table 2 gives more detail on the stratification levels.
Due to the difficulty in capturing the programme’s benefit to dependants, this analysis is limited to employees. The model incorporates HIV incidence in the workforce but does not model HIV transmission from the workforce or the effect of ART on HIV transmission. Sepa-rations, i.e., losses to the workforce other than through retirement or retrenchment, most often due to ill-health or death, are differentiated into three categories (death, ill-health/disability, and other) in the model and are further differentiated by HIV status, job grade for HIV-nega-tive employees, and CD4 cell count stratum for HIV-posiHIV-nega-tive employees. More details on the methods used in estimating each parameter are given in Tables2–4and inS1 Text, which also gives the model equations.
Model Parameterisation
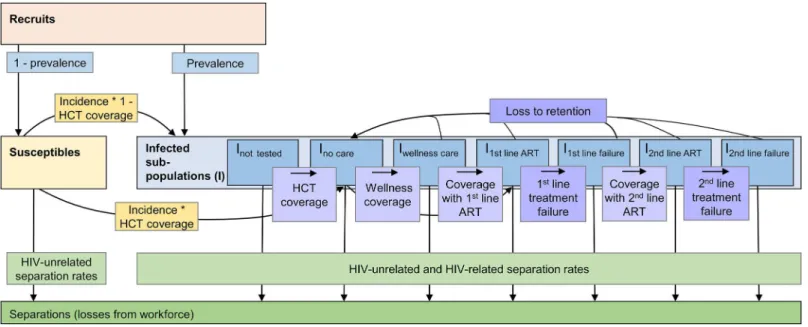
The model was parameterised with company data on the size, composition, and turnover of the workforce at the mines obtained from the company employee database of 9,211 employees, covering the period January 2003 to December 2010 and including job grade, gender, engage-ment and termination dates, and the coverage and results of the serial HCT campaigns. Annual coverage with linked workplace HCT campaigns increased from 40% of all employees in 2003 Fig 1. Population model of changes within the workforce.Recruits join the susceptible or infected (I) workforce depending on their HIV status at first
employment. Employees move from the susceptible to the infected population according to prevalence and incidence. In the infected population, employees change between sub-populations representing different types of care (not tested, tested but not yet in care, wellness care, successful first- or second-line ART, and first-line or second-line treatment failure) according to coverage rates and, in case of treatment failure, to failure rates. Employees can drop out of care, i.e., be lost to retention, at any time and go back to the no care sub-population according to loss-to-retention rates; they can also leave the workforce for reasons related or unrelated to HIV (separations). Within each of the sub-populations, additional unidirectional changes due to ageing and promotion rates apply (not shown here); within each of the infected sub-populations, additional bi-directional changes due to transitions between CD4-cell-count-defined health states apply.
to 86% in 2008, enabling a reliable estimation of HIV incidence in later years. A separate data-base documenting the 1,149 employees who tested HIV positive and were enrolled in the com-pany’s HIV care programme over the same period of time provided inputs regarding coverage of wellness care and ART, retention in care, development of treatment failure, and employees’ CD4 cell counts over time. The two databases were anonymously linked for this analysis.
We parameterised the model with annual HCT and ART coverage, HIV prevalence in new employees joining the workforce, as well as the incidence of treatment failure and loss to reten-tion in the programme as reported in these databases. Based on these data, HCT coverage was set to reach 92% by 2010 and to remain constant thereafter. The HCT data were also used to estimate the HIV incidence and prevalence amongst all employees. Incidence was estimated for those employees with two or more HIV tests, with HIV conversion assumed to be at the midpoint between the first positive and the last prior negative HIV test [53]. These data sug-gested that HIV incidence varied between 1.2 and 2.6 per 100 employee-years in the workforce throughout and that prevalence increased from 11% in 2005 to 16% in 2010. ART coverage of those eligible was calibrated to increase from 11% in 2003 to 68% in 2010, as suggested by the workforce data, and was modelled to reach 88% by 2013 and 100% by 2022. First-line treat-ment failure was set to vary between 8% and 11% per year, and loss to follow-up between 6% and 12% per year, likely including some migration to ART programmes outside the workforce. The values of important model parameters are summarised in Tables3and4; the remainder of the parameters and their 95% confidence intervals are available inS1 Text.
Transition Probabilities
A detailed electronic register including the results of all CD4 cell count measurements (every 3 mo) from all HIV-positive employees for the same period as the workforce database (January 2003–December 2010) was used to estimate the transition probabilities between CD4-cell-count-defined health states for the wellness care and ART populations (Table 5). The database Table 1. Job grade, health state, and age group categories used in model.
Parameter Category
Patterson band1
A Job grade 1 (unskilled worker)
B lower Job grade 2 (semi-skilled worker)
B upper Job grade 3 (semi-skilled worker)
C lower Job grade 4 (skilled worker)
C upper Job grade 5 (skilled worker)
D and E Job grade 6 (management)
CD4 cell count stratum (cells/mm3)
>350 Health state 1
200–350 Health state 2
100–199 Health state 3
50–99 Health state 4
<50 Health state 5
Age range (years)
<30 Age group 1
30–50 Age group 2
>50 Age group 3
1South African system of grading jobs according to the level of skill required for a certain job.
Table 2. Details of parameter estimation, level of stratification, and data sources.
Model Input or Assumption
Level of Stratification
Source of Data (2003–2010) Method of Estimation
2003–20101 2011–2022
1. Changes in workforce
Workforce needed at end of year
Job grade, year Company data Data taken as is to calculate number of recruits or retrenchments required
Assumed to remain same as in 2010
Number of recruits Job grade, year Set to produce workforce needed
at end of year Same as for 2003–2010 Prevalence of recruits/
retrenchees2 Job grade, gender,year (for
retrenchees, also by age)
Company data N: all new employees with a positivefirst HIV result in the year of recruitment; D: all new employees with a positive or negativefirst HIV result in the year of recruitment
Assumed to remain same as in 2010
Distribution of recruits Age group, gender,
year Company data (distribution setto be same as workforce distribution in database in 2003–2010)
N: number of employees in database by year, job grade, gender, and age group; D: total number of employees across all job grades, age groups, and genders by year
Assumed same as average 2003–2010
Annual rate of promotion Job grade, year Company data for 2005/2006 Assumed to remain same as in
2005/2006 Assumed to remain same asin 2005/2006
2. Start population and coverage
Distribution of start population (all employees)
Age group, gender,
job grade Company data Number of employees in databaseby 31 Dec 2002 by job grade, gender, and age group
N/A (start year only)
HIV status of start population (all employees)
HIV status of those employees with an HIV test
Company data Number of HIV-positive employees tested before 31 Dec 2002 and assumptions regarding untested employees’HIV status
N/A (start year only)
Distribution of start population into CD4 cell count categories (HIV-positive employees)
CD4 cell count category
No data Same proportion assumed in each CD4 cell count strata
N/A (start year only)
Baseline HCT coverage3 Age group, gender,
job grade Company data Number of employees testedbefore 31 Dec 2002 by job grade, gender, and age group
N/A (start year only)
3. Costs
Average basic salary Job grade Company data (payroll) Salaries in cost year (2006) Real cost assumed constant over time
Incremental replacement cost for HIV-positive employees
Job grade Interviews with company
human resources department Average cost per new employeeby job grade in cost year (2006) Real cost assumed constantover time
Number of years that benefits get paid
None Company benefit policy Company policy Real cost assumed constant
over time Incremental inpatient/
outpatient cost for HIV-positive employees in cost year (2006)
Type of care (ART/ no ART), CD4 cell count category
Bottom-up cost analysis of
company health services Average cost per employee in costyear (2006); includes non-ARV drugs, non-ARV-specific laboratory tests, patient contact time, other medical supplies, site programme cost, but no central management cost
Real cost assumed constant over time
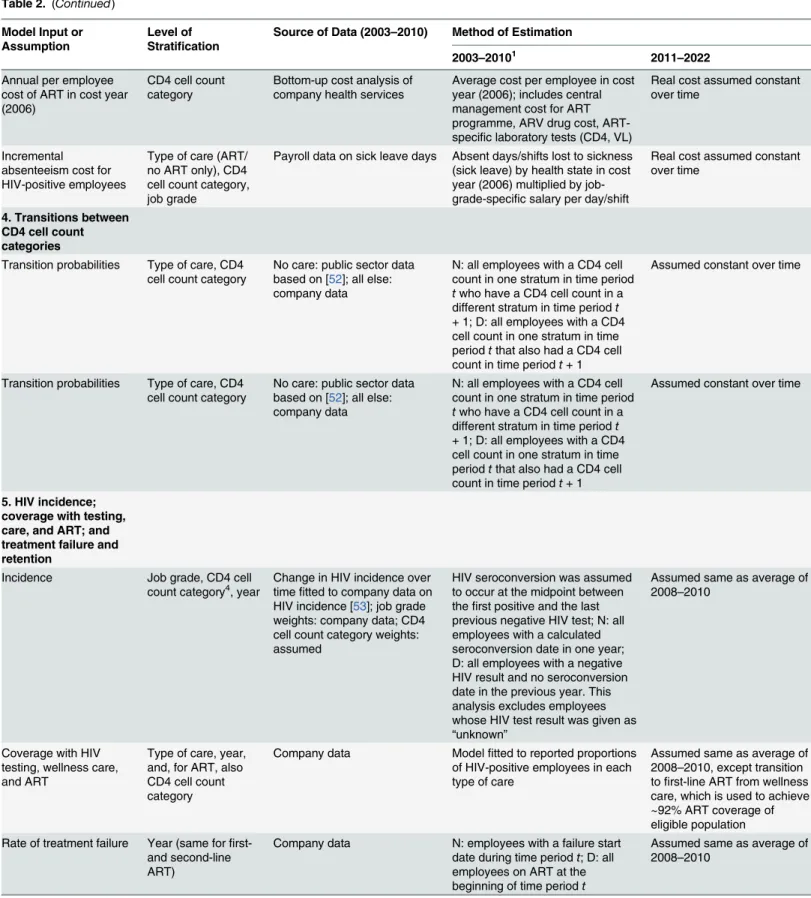
Table 2. (Continued)
Model Input or Assumption
Level of Stratification
Source of Data (2003–2010) Method of Estimation
2003–20101 2011–2022
Annual per employee cost of ART in cost year (2006)
CD4 cell count
category Bottom-up cost analysis ofcompany health services Average cost per employee in costyear (2006); includes central management cost for ART programme, ARV drug cost, ART-specific laboratory tests (CD4, VL)
Real cost assumed constant over time
Incremental absenteeism cost for HIV-positive employees
Type of care (ART/ no ART only), CD4 cell count category, job grade
Payroll data on sick leave days Absent days/shifts lost to sickness (sick leave) by health state in cost year (2006) multiplied by job-grade-specific salary per day/shift
Real cost assumed constant over time
4. Transitions between CD4 cell count categories
Transition probabilities Type of care, CD4 cell count category
No care: public sector data based on [52]; all else: company data
N: all employees with a CD4 cell count in one stratum in time period
twho have a CD4 cell count in a
different stratum in time periodt
+ 1; D: all employees with a CD4 cell count in one stratum in time periodtthat also had a CD4 cell
count in time periodt+ 1
Assumed constant over time
Transition probabilities Type of care, CD4
cell count category No care: public sector databased on [52]; all else: company data
N: all employees with a CD4 cell count in one stratum in time period
twho have a CD4 cell count in a
different stratum in time periodt
+ 1; D: all employees with a CD4 cell count in one stratum in time periodtthat also had a CD4 cell
count in time periodt+ 1
Assumed constant over time
5. HIV incidence; coverage with testing, care, and ART; and treatment failure and retention
Incidence Job grade, CD4 cell
count category4, year Change in HIV incidence overtime fitted to company data on
HIV incidence [53]; job grade weights: company data; CD4 cell count category weights: assumed
HIV seroconversion was assumed to occur at the midpoint between thefirst positive and the last previous negative HIV test; N: all employees with a calculated seroconversion date in one year; D: all employees with a negative HIV result and no seroconversion date in the previous year. This analysis excludes employees whose HIV test result was given as
“unknown”
Assumed same as average of 2008–2010
Coverage with HIV testing, wellness care, and ART
Type of care, year, and, for ART, also CD4 cell count category
Company data Modelfitted to reported proportions of HIV-positive employees in each type of care
Assumed same as average of 2008–2010, except transition tofirst-line ART from wellness care, which is used to achieve ~92% ART coverage of eligible population Rate of treatment failure Year (same forfi
rst-and second-line ART)
Company data N: employees with a failure start date during time periodt; D: all
employees on ART at the beginning of time periodt
Assumed same as average of 2008–2010
contained a total of 10,972 CD4 cell count test results, with a mean patient follow-up of 961 d (maximum 2,822 d). Since almost all employees who test HIV positive in the workplace testing programme immediately enter care, we used historic data from the South African public sector to parameterise the transitions for the undiagnosed and no care populations [52]. Because of insufficient data, these transitions were also applied to the treatment failure population.
Each employee’s available CD4 cell count data were allocated to each type of care in 3-mo time periods from the start date for this type of care up until the time period including the stop date for this type of care. If CD4 cell counts were missing for one or two consecutive time peri-ods, they were linearly interpolated from the CD4 cell counts of the two adjacent time periods. These CD4 cell counts were then allocated to five different CD4 cell count strata, which in turn defined the model health states (seeTable 1).
For the calculation of transition probabilities, in order to differentiate between patients in wellness care and those accessing ART outside the company healthcare system, CD4 cell counts were considered to be wellness care CD4 cell counts only if any VL measured during the same 3-mo time period was unsuppressed (>50 copies/ml). If a suppressed VL count was found
before the date of ART initiation in the workforce programme, the patient was deleted from Table 2. (Continued)
Model Input or Assumption
Level of Stratification
Source of Data (2003–2010) Method of Estimation
2003–20101 2011–2022
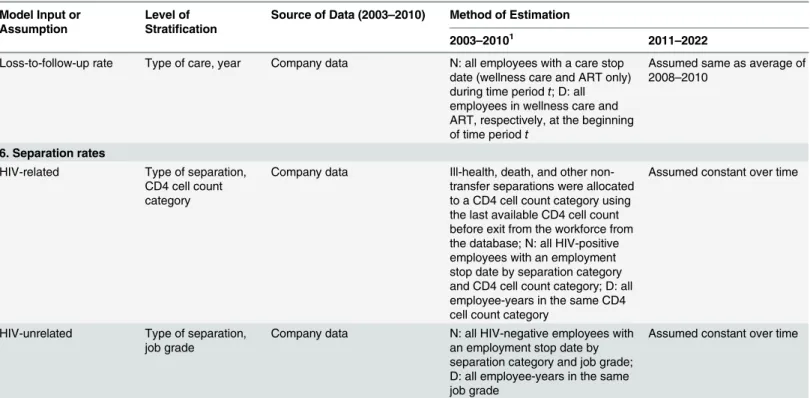
Loss-to-follow-up rate Type of care, year Company data N: all employees with a care stop date (wellness care and ART only) during time periodt; D: all
employees in wellness care and ART, respectively, at the beginning of time periodt
Assumed same as average of 2008–2010
6. Separation rates
HIV-related Type of separation, CD4 cell count category
Company data Ill-health, death, and other non-transfer separations were allocated to a CD4 cell count category using the last available CD4 cell count before exit from the workforce from the database; N: all HIV-positive employees with an employment stop date by separation category and CD4 cell count category; D: all employee-years in the same CD4 cell count category
Assumed constant over time
HIV-unrelated Type of separation,
job grade Company data N: all HIV-negative employees withan employment stop date by separation category and job grade; D: all employee-years in the same job grade
Assumed constant over time
“Company data”refers to the mine company’s employee database of 9,211 employees and a separate database documenting the 1,149 employees who tested HIV positive and were enrolled in the company’s HIV care programme. The databases cover the period January 2003 to December 2010.
1Details of analysis are given if a parameter was analysed from the company
’s employee database. D, denominator; N, numerator.
2If the workforce is set to be reduced during one year, the resulting number of recruits will be negative, signifying the number of people who will be
retrenched, rather than recruited, during that year.
3Coverage with all other care is set to zero at baseline. 4Incidence is strati
fied by CD4 cell count category to allow the distribution of newly incident members of the infected population into CD4 cell count categories. The values of the weights are 0.1, 0.2, 0.3, 0.5, and 1 for the categories>350, 200–350, 100–199, 50–99, and<50 cells/mm3, respectively.
ARV, antiretroviral; N/A, not applicable.
the wellness care CD4 analysis. In order to exclude patients in treatment failure, CD4 cell counts were considered to be ART CD4 cell counts only if any VL measured during the same time period was suppressed (50 copies/ml), though the patient could still contribute other (i.e., earlier or later) CD4 cell counts to the ART CD4 population if they coincided with a sup-pressed VL.
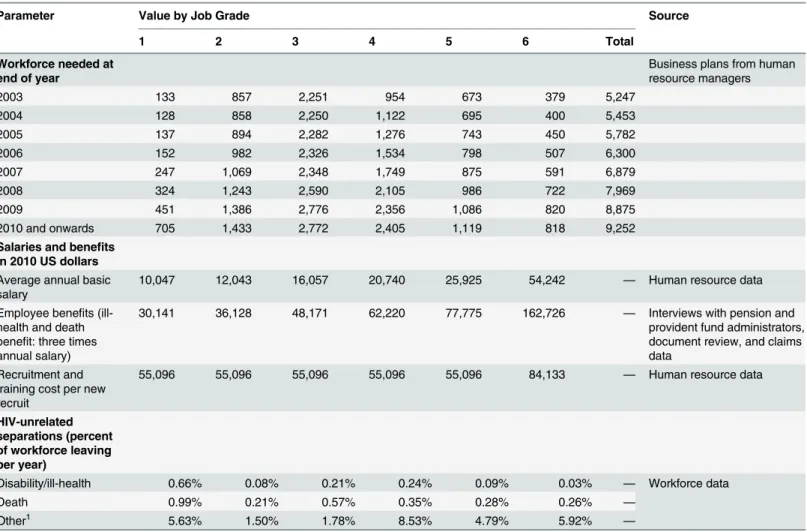
Table 3. Values and sources of main model inputs and assumptions.
Parameter Value by Job Grade Source
1 2 3 4 5 6 Total
Workforce needed at end of year
Business plans from human resource managers
2003 133 857 2,251 954 673 379 5,247
2004 128 858 2,250 1,122 695 400 5,453
2005 137 894 2,282 1,276 743 450 5,782
2006 152 982 2,326 1,534 798 507 6,300
2007 247 1,069 2,348 1,749 875 591 6,879
2008 324 1,243 2,590 2,105 986 722 7,969
2009 451 1,386 2,776 2,356 1,086 820 8,875
2010 and onwards 705 1,433 2,772 2,405 1,119 818 9,252
Salaries and benefits in 2010 US dollars
Average annual basic salary
10,047 12,043 16,057 20,740 25,925 54,242 — Human resource data
Employee benefits
(ill-health and death benefit: three times annual salary)
30,141 36,128 48,171 62,220 77,775 162,726 — Interviews with pension and
provident fund administrators, document review, and claims data
Recruitment and training cost per new recruit
55,096 55,096 55,096 55,096 55,096 84,133 — Human resource data
HIV-unrelated separations (percent of workforce leaving per year)
Disability/ill-health 0.66% 0.08% 0.21% 0.24% 0.09% 0.03% — Workforce data
Death 0.99% 0.21% 0.57% 0.35% 0.28% 0.26% —
Other1 5.63% 1.50% 1.78% 8.53% 4.79% 5.92%
—
1Other separations include dismissals in absentia.
doi:10.1371/journal.pmed.1001869.t003
Table 4. Values and sources of main model inputs and assumptions (HIV-related separations only).
HIV-Related Separations (Incremental to HIV-Unrelated Separations) CD4 Cell Count (cells/mm3)
>350 200–350 100–199 50–99 <50
Disability/ill-health 1.20% 1.80% 2.10% 2.70% 14.00%
Death 3.00% 4.70% 9.20% 24.80% 67.10%
Other1 6.90% 8.20% 8.60% 9.00% 12.90%
Source: workforce data.
1Other separations include dismissals in absentia.
Cost Data
A bottom-up patient-level analysis of economic costs from the employer perspective was con-ducted in 2006 to quantify all costs of HIV/AIDS to the company. The analysis, which has been described in detail elsewhere [54,55], included the cost of the ART programme, including the cost of antiretroviral drugs, ART-specific laboratory tests such as CD4 cell count and VL, and management and training costs within and above the facility level, as well as any other HIV-related cost such as inpatient and outpatient resource utilisation and costs, and the costs of absenteeism and replacing a sick or deceased worker, including the benefits paid to the worker or his/her family and the costs of recruiting and training a replacement. Healthcare resource use, quantified as the number of inpatient days and outpatient visits, was abstracted from record systems at the company health centres and averaged by CD4 cell count stratum, based on the employee’s most recent CD4 cell count. Absenteeism was calculated as the median num-ber of days of sick leave of patients in wellness care and on ART by CD4 cell count stratum, based on the company’s payroll data. Both healthcare and absenteeism costs were calculated incrementally to that of HIV-negative employees.
Due to the choice of an employer perspective, costs to the employee and the broader soci-ety were excluded, but since most employees of the mining company seek care at the work-place clinics and hospitals, resource use captured for this analysis is unusually complete. Cost inputs are summarised inTable 6. Cost data were collected in South African rands (ZAR) during 2006/2007, adjusted for inflation to 2010, and converted to US dollars (USD) using the 2010 average conversion rate of 8 ZAR/1 USD (S1 Textcontains an explanation of the time period for inflation adjustment). Costs are presented undiscounted and discounted at 5% per annum, the repurchase rate of the South African Reserve Bank during most of the analysis period [56].
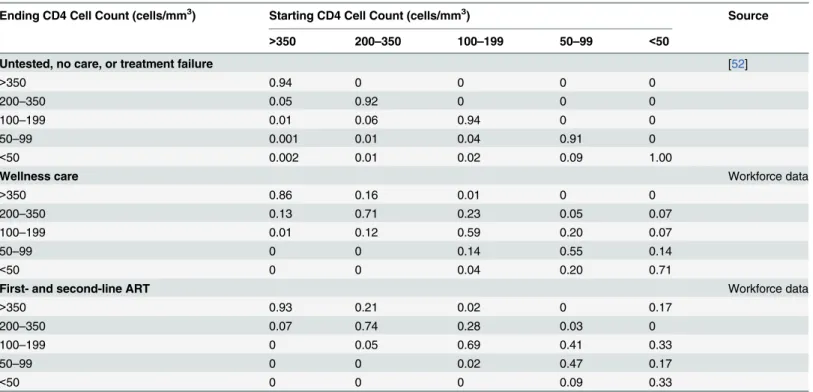
Table 5. Model 3-mo transition probabilities between CD4-cell-count-defined health states by type of care.
Ending CD4 Cell Count (cells/mm3) Starting CD4 Cell Count (cells/mm3) Source
>350 200–350 100–199 50–99 <50
Untested, no care, or treatment failure [52]
>350 0.94 0 0 0 0
200–350 0.05 0.92 0 0 0
100–199 0.01 0.06 0.94 0 0
50–99 0.001 0.01 0.04 0.91 0
<50 0.002 0.01 0.02 0.09 1.00
Wellness care Workforce data
>350 0.86 0.16 0.01 0 0
200–350 0.13 0.71 0.23 0.05 0.07
100–199 0.01 0.12 0.59 0.20 0.07
50–99 0 0 0.14 0.55 0.14
<50 0 0 0.04 0.20 0.71
First- and second-line ART Workforce data
>350 0.93 0.21 0.02 0 0.17
200–350 0.07 0.74 0.28 0.03 0
100–199 0 0.05 0.69 0.41 0.33
50–99 0 0 0.02 0.47 0.17
<50 0 0 0 0.09 0.33
Model Calibration and Sensitivity Analysis
Because sampling uncertainty surrounds many of the important model parameters, we defined probability distributions around the main inputs, with the distributions based on the primary workforce, absenteeism, and cost data used in this analysis. Some parameters were also strati-fied by CD4 cell count or job grade (separation rates) or were time dependent (treatment fail-ure probability). Statistical distributions were assigned to these parameters based on standard practice in economic evaluations [57], with specific details included inS1 Text.
To calibrate the model while accounting for this sampling uncertainty, 20,000 parameter sets were randomly sampled (using Latin hypercube sampling) from the parameter distribu-tions, and the resulting model runs were compared to see if they fit within the uncertainty range for the observed HIV prevalence of the workforce in 2010 (12.8%–19.2%) and the aver-age annual number of separations in HIV-positive (50–150) and HIV-negative (200–500) employees during 2005–2009. The 998 model runs that fit these data were then used to assess the uncertainty around our main outcomes (total costs, cost savings, and HIV prevalence), with medians and 90% credibility intervals (CrIs) being produced for each outcome. In addi-tion, an analysis of co-variance was undertaken to quantify the contribution of different parameters to the uncertainty in the projected undiscounted savings due to ART.
Additionally, we undertook univariate sensitivity analyses on selected parameters, examin-ing the impact of the followexamin-ing: reducexamin-ing all absenteeism by half; assumexamin-ing the same absentee-ism on ART as off ART; assuming the same ART cost and health-state transition probabilities as found in analyses of public sector ART provision in South Africa using similar methodology [58,59]; changing inpatient and outpatient costs by ±50% (note that in each instance only the extremes of the range were considered); changing the number of annual salary equivalents paid out as benefits to 0, 1, or 2 y instead of 3; changing HIV-dependent separation rates by ±20%; changing incidence by ±50%; and, in order to examine the generalisability of results to a setting with low HIV prevalence, reducing incidence to an extremely low value of 0.0001 and preva-lence in the start population and amongst new recruits each to a tenth of the baseline values. For each of these sensitivity analyses, the effect of the parameter change was evaluated on all the baseline model fits so that an average effect could be estimated.
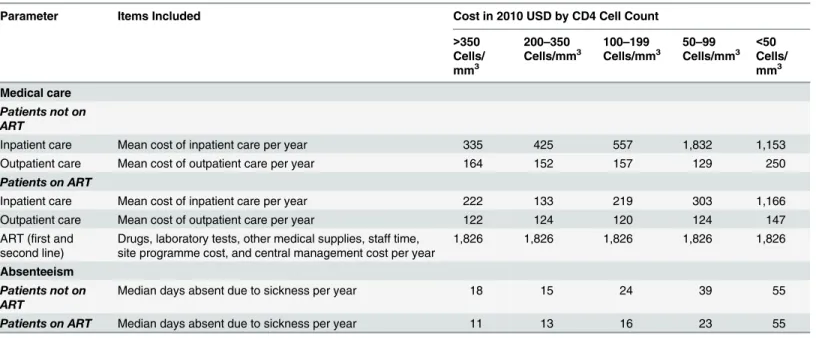
Table 6. Annual per employee cost and frequency of absenteeism by CD4 cell count category, incremental to that of HIV-negative employees.
Parameter Items Included Cost in 2010 USD by CD4 Cell Count
>350 Cells/ mm3
200–350 Cells/mm3
100–199 Cells/mm3
50–99 Cells/mm3
<50 Cells/ mm3
Medical care
Patients not on ART
Inpatient care Mean cost of inpatient care per year 335 425 557 1,832 1,153
Outpatient care Mean cost of outpatient care per year 164 152 157 129 250
Patients on ART
Inpatient care Mean cost of inpatient care per year 222 133 219 303 1,166
Outpatient care Mean cost of outpatient care per year 122 124 120 124 147
ART (first and
second line) Drugs, laboratory tests, other medical supplies, staff time,site programme cost, and central management cost per year 1,826 1,826 1,826 1,826 1,826
Absenteeism
Patients not on ART
Median days absent due to sickness per year 18 15 24 39 55
Patients on ART Median days absent due to sickness per year 11 13 16 23 55
Lastly, in order to analyse the future impact of changes in treatment policies, we parame-terised the model for two additional scenarios to be implemented from 2013 onwards. First, we considered a universal test and treat scenario in which HCT coverage was 100% each year, and 100% of employees who tested HIV-positive initiated ART within 6 mo, regardless of CD4 cell count or clinical status. We conservatively assumed no impact of this high-level ART coverage on HIV incidence since the intervention would cover only employees and not their sexual part-ners. In a second scenario (“family treatment”), we incorporated the extension of ART to those family members of employees who were eligible for ART, with an assumed average of one ART-eligible dependant per HIV-positive employee on ART.
Ethics Approval
The study was reviewed and approved by the following ethics committees: the London School of Hygiene & Tropical Medicine Ethics Committee (application number 962), the Anglogold Health Service Research Ethics Committee (AHS REC 004/02), and the University of Kwa-Zulu-Natal Biomedical Research Ethics Committee (BE093/08). Employees’consent to partici-pation in this study was waived as we used only data that were collected for routine care purposes and, as in most other routine care settings, employees did not give written consent for this care.
Data Availability
The fully parameterised model that incorporates all data and that was used to produce all pro-jections within this paper can be downloaded from OpenBU viahttp://hdl.handle.net/2144/ 10817.
Results
Patient-Level Cost and Resource Use and Absenteeism of Employees
on and off ART
The results of our bottom-up cost analyses in HIV-positive employees show that regardless of ART status, average annual outpatient and inpatient employee costs both increase with decreasing CD4 cell count, and, in contrast to analyses of the cost of public sector ART provi-sion in South Africa [26–29], inpatient costs are higher than outpatient costs per patient-year (Table 6). Once employees initiate ART, these costs of care decrease dramatically across all CD4 cell count strata. However, when considering the healthcare cost of the HIV programme only, and excluding other HIV-related costs such as absenteeism and the cost of staff turnover, the addition of ART renders the HIV programme more expensive than without ART.
HIV-positive employees not on ART have between 11 and 40 sick leave days annually over and above the average number of sick leave days in HIV-negative employees (Table 6). For spe-cific CD4 strata, the level of absenteeism decreases by 16%–42% after ART initiation, except in employees with a CD4 cell count of<50 cells/mm3. As with healthcare costs, the most
absen-teeism is seen in the lowest CD4 cell count stratum, whether on or off ART.
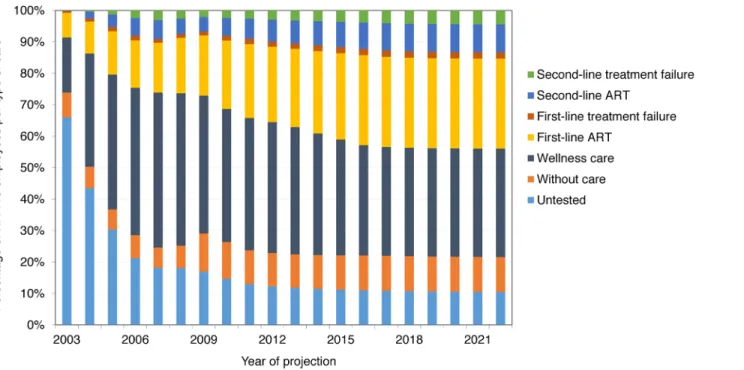
wellness care and, if eligible, onto ART, and the proportion of employees on second-line ART slowly increasing. From 2012, only 35%–44% of HIV-positive employees are on ART, because many are not eligible for ART; however, 75%–97% of employees with CD4 cell count<350
cells/mm3are on ART.
Across all available model fits, projections suggest that an HIV-infected employee with a current CD4 cell count>350 cells/mm3will have a 39% (90% CrI 35%–43%), 57% (50%–
62%), or 78% (73%–82%) probability of surviving the following 10 y if they are in no care, in wellness care, or on ART, respectively. (Note that this survival does not take into account deaths in employees once they have left the workforce.) However, survival in the workforce at 10 y is much lower, as a result of death as well as disability and other separations: 16% (90% CrI 13%–19%), 23% (20%–27%), and 35% (31%–39%) for employees in no care, in wellness care, and on ART, respectively.
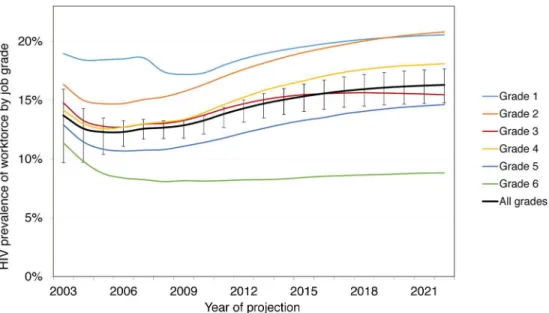
Without ART, these survival rates lead to a total of 22,274 (90% CrI 20,887–24,086) HIV-positive employee-years (or life-years in employment) at the mines between 2003 and 2022, with HIV prevalence increasing from 13.3% (90% CrI 12.8%–14.4%) in 2010 to 14.3% (13.0%– 15.9%) in 2022. With ART coverage increasing from 10% of eligible HIV-positive employees in 2003 to 97% in 2020, the number of deaths amongst employees due to HIV over 20 y decreases by 16% (90% CrI 11%–21%) from 1,583 (90% CrI 1,406–1,791) without ART to 1,336 (1,183– 1,497) with ART. Survival in employment increases by 8% (90% CrI 6%–12%) to 24,134 (90% CrI 22,848–25,841) HIV-positive life-years. This increase is not larger because on average only 34% of infected employees are on ART at any given time (since only a fraction of HIV-infected employees are eligible for ART), only a portion of these would have left the workforce or died in absence of ART over this period, and some leave the workforce before realising the full benefit of treatment. The increase in survival leads to an increase in HIV prevalence from 14.3% (90% CrI 13.0%–15.9%) in 2022 without ART to 16.3% (14.9%–17.8%) with ART. HIV prevalence is always higher in the lower job grades: 21% (90% CrI 19%–22%) in job grade 1 and 21% (18%–24%) in job grade 2 in 2022 with ART (Fig 3).
Fig 2. Distribution of HIV-positive employees into types of HIV care, 2003–2022 (ART scenario).
Changes in Workforce Turnover, Absenteeism, and Separations
With workplace ART provision, other changes are experienced by the workforce between 2003 and 2022. The total number of absent days due to HIV are estimated to be reduced by 8% (90% CrI 6%–10%), from 330,172 (90% CrI 297,729–367,723) to 303,897 (277,147–335,776) days, with 33% (90% CrI 26%–40%) fewer absenteeism days amongst employees with CD4 cell counts below 100 (Fig 4). The number of employees leaving employment for HIV-related rea-sons is estimated to decrease by 5% (90% CrI 3%–7%) to 3,626 (90% CrI 3,403–3,815) over 20 y, and the number of recruits is estimated to decrease by 2% (1%–3%) to 17,201 (16,454– 17,912). Recruitment does not decrease further because of the large expansion of the company over this period (from 5,247 to 9,252 employees) and the considerable separations in the HIV-uninfected workforce.
Total and Average Cost with and without ART
Without workplace ART provision, the undiscounted total cost of HIV to the company (including all healthcare, absenteeism, and turnover costs) over 20 y is estimated at US$296 million (90% CrI US$274–US$320 million) (Table 7), with the mean annual cost estimated to increase from US$13 million (90% CrI US$12–US$15 million) in the first 10 y to US$15 mil-lion (US$14–US$16 milmil-lion) over 20 y, mostly due to increasing HIV prevalence. This trans-lates to a mean annual cost per HIV-positive employee of US$13,271 (90% CrI US$12,101–US $14,522) over 20 y. With ART, over 98% of model projections suggest that these costs decrease: the total and mean annual costs are estimated to decrease by 5% (90% CrI 2%–8%) over 20 y, and the mean annual cost per HIV-positive employee by 9% (5%–13%). These savings are esti-mated to accrue from the first year of the ART programme onwards and to increase as the average CD4 cell count of HIV-positive employees on ART rises. Similar changes are seen with the discounted cost (S1 Fig). Moreover, ART is estimated to be cost-saving at even the lowest coverage level, as each employee on ART saves absenteeism, healthcare, and turnover costs that are greater than the per employee cost of ART.
Fig 3. Prevalence by job grade, 2003–2022, with workplace ART provision.Job grade 1: unskilled
worker; grades 2 and 3: semi-skilled worker; grades 4 and 5: skilled worker; grade 6: management.
Average Cost and Savings by Item
Without ART provision, the largest components of the mean undiscounted annual cost of HIV to the company over 20 y are estimated to be benefit payments (53% of mean annual cost) and medical care costs (24%), followed by absenteeism (15%), and training and recruitment (8%) (Table 8). The cost of medical care is dominated by inpatient care (78% of medical care costs). Once ART is introduced, we estimate that benefit payments and medical care costs remain the largest contributors to the annual HIV costs (46% and 21%, respectively), whereas the cost of the ART programme itself is estimated to be comparatively small, at just 7% of the total.
Overall, the average undiscounted annual savings from scaling up ART coverage over 20 y are estimated to be US$950,215 (90% CrI US$220,879–US$1,616,104). The largest contribution to these estimated savings (52% of total savings) is the 13% decrease in benefit payments, fol-lowed by the 15% decrease in medical care costs (27% of total savings) (Table 8). Although the cost of training and recruitment is estimated to fall by 15% with ART, this makes up only 9% of annual savings, whilst the cost of absenteeism, which falls by 11%, is estimated to contribute 12% of savings. Without ART, the total undiscounted annual cost of HIV to the company is estimated to make up 3.6% (90% CrI 3.3%–3.9%) of total company payroll between 2003 and 2022, whereas with ART, this falls to 3.4% (3.1%–3.7%).
Sensitivity and Uncertainty Analysis and Additional Scenarios
The univariate sensitivity analysis showed that total costs over 20 y are very sensitive to reduc-tions in benefits paid for death and disability (−33%/66%) and changes in HIV incidence
(±50%), as well as to using public sector data for CD4 cell count transition probabilities, Fig 4. Total number of days absent due to HIV per CD4-cell-count-defined health state, 2003–2022.
Scenario No ART ART Savings from ART By 2012 By 2022 By 2012 By 2022 By 2012 By 2022 Cost of HIV to company: median
(90% CrI) from probabilistic sensitivity analysis
Undiscounted
Total cost (millions 2010 USD) 131 (118–147) 296 (274–320) 124 (112–140) 278 (256–299) 5% (2%–8%) 6% (1%–11%)
Mean annual cost (millions 2010
USD) 13 (12–15) 15 (14–16) 12 (11–14) 14 (13–15) 5% (2%–8%) 6% (1%–11%)
Mean annual cost per HIV-positive
employee (2010 USD) 14,208 (12,982–15,509) 13,271 (12,101–14,522) 12,893 (11,903–13,862) 11,488 (10,601–12,218) 9% (5%–13%) 14% (7%–19%)
Discounted
Total cost (millions 2010 USD) 155 (140–178) 269 (247–293) 148 (133–170) 253 (233–275) 5% (2%–7%) 6% (2%–10%)
Mean annual cost (millions 2010
USD) 16 (14–18) 13 (12–15) 15 (13–17) 13 (12–14) 5% (2%–7%) 6% (2%–10%)
Mean annual cost per HIV-positive
employee (2010 USD) 16,936 (15,383–18,624) 12,045 (10,948–13,242) 15,409 (14,137–16,780) 10,492 (9,614–11,287) 9% (5%–13%) 13% (8%–18%)
Sensitivity analysis: percent relative change in total undiscounted cost
Absenteeism reduced by 50% −9% −11% −0.4% −1% −5% −4%
Same absenteeism on ART as not
on ART1 3% 3% 3% 4% 5% 5%
Same ART transition probabilities
as public sector2 10% 13% 7% 9% 8% 10%
Same ART cost as public sector3 3% 3%
−1% −4% 8% 12%
Change in inpatient cost:−50% −6% −7% −6% −6% 5% 5%
Change in inpatient cost: +50% 11% 12% 10% 10% 6% 8%
Change in outpatient cost:−50% 0.4% −0.1% −0.2% −1% 6% 7%
Change in outpatient cost: +50% 5% 6% 5% 5% 5% 6%
Change in benefits: two times
annual salary paid −
17% −15% −17% −14% 5% 5%
Change in benefits: one times
annual salary paid −36% −34% −35% −31% 4% 3%
Change in benefits: no benefits paid
out −56% −52% −54% −48% 1% −2%
Change in HIV-dependent separation rates:−20%
0.1% 3% −1% 2% 6% 8%
Change in HIV-dependent
separation rates: +20% 5% 2% 5% 2% 5% 6%
Change in HIV incidence:−50% −17% −22% −17% −22% 5% 6%
Change in HIV incidence: +50% 21% 26% 20% 25% 6% 7%
Cost
–
Benefit
Analysis
of
Workplace
ART
in
South
Medicin
e
|DOI:10.137
1/journal.p
med.1001869
September
1,
Scenario No ART ART Savings from ART By 2012 By 2022 By 2012 By 2022 By 2012 By 2022
Change HIV incidence to 0.0001 and lower prevalence in starting population and recruits
−94% −95% −94% −95% 5% 4%
Additional scenarios: percent relative change in total undiscounted cost, 2013–2022 Test and treat4
— — — 0.2% — 9%
Family treatment5
— — — 9% — 1%
1By CD4-cell-count-de
fined health state.
2Based on [58] (public sector transition probabilities for
first-line ART andfirst-line treatment failure only).
3US$277, the average per patient annual cost of adult ART in the public sector for 2015/2016, with 7.5% of patients assumed on second-line ART (based on [59], updated using
April 2015 government tender drug costs).
4100% coverage with HCT; 100% initiation on ART regardless of CD4 cell count and clinical status; 100% retention on ART; no impact on HIV incidence.
5For every employee known to be HIV-positive, treatment is offered to one additional HIV-positive dependant on average.
doi:10.1371/journal.pmed.1001869.t007
Cost
–
Benefit
Analysis
of
Workplace
ART
in
South
Africa
Medicin
e
|DOI:10.137
1/journal.p
med.1001869
September
1,
2015
Table 8. Annual undiscounted cost and savings by cost item, 2003–2022.
Cost Item Annual Cost (Millions 2010 USD) Savings from ART
No ART ART Total (Compared to No
ART) (Millions 2010 USD)
Relative (Compared to No ART)
Percent of Total Saving1
Cost Percent of Total Cost Percent of Total
Medical care 3.6 (3.3–3.9) 24% (22%–27%) 3.0 (2.7–3.4) 21% (15%–26%) 0.57 (0.28 to 0.78) 15% (−7% to 34%) 27% (8% to 37%) Inpatient care 2.8 (2.6–3.0) 19% (17%–20%) 2.2 (2.0–2.4) 15% (11%–18%) 0.55 (0.41 to 0.68) 19% (−1% to 38%) 27% (11% to 35%) Outpatient care 0.8 (0.6–1.1) 6% (4%–7%) 0.8 (0.6–1.1) 6% (4%–8%) 0.03 (−0.26 to 0.19) 2% (−41% to 32%) 0% (−14% to 11%)
Absenteeism 2.2 (2.0–2.4) 15% (13%–16%) 1.9 (1.8–2.1) 13% (10%–16%) 0.25 (0.20 to 0.30) 11% (−11% to 32%) 12% (4% to 22%)
Benefits 7.8 (7.1–8.7) 53% (50%–56%) 6.8 (6.1–7.5) 46% (33%–54%) 1.06 (0.69 to 1.52) 13% (−2% to 39%) 52% (8% to 66%)
Training and recruitment 1.2 (1.0–1.3) 8% (7%–8%) 1.0 (0.9–1.1) 6% (5%–8%) 0.19 (0.13 to 0.25) 15% (0.1% to 41%) 9% (0.1% to 12%)
ART programme cost — — 1.1 (0.7–1.6) 7% (4%–11%) −1.10 (−1.61 to−0.71) — —
Total 14.8 (13.7–16.0) 13.9 (12.8–15.0) 0.95 (0.22 to 1.62) 14% (5% to 24%) Values are median (90% CrI) from the probabilistic sensitivity analysis.
1The values presented here are the mean (rather than median) (90% CrI) from the probabilistic sensitivity analysis.
doi:10.1371/journal.pmed.1001869.t008 Cost
–
Benefit
Analysis
of
Workplace
ART
in
South
Medicin
e
|DOI:10.137
1/journal.p
med.1001869
September
1,
reductions in absenteeism (−50%), and changes in inpatient cost (±50%) (Table 7). However,
total costs do not change much if absenteeism by CD4 cell count category are assumed to be the same with and without ART or if the HIV-dependent separation rates (±20%) or outpatient costs (±50%) are changed. Equally, there is little change when ART costs from recent analyses of public sector ART provision are used [59]. Importantly, the only assumptions under which ART provision stops being cost-saving are if absenteeism is reduced by 50% (over both 10 and 20 y) or if no benefits are paid out (over 20 y only); under all other assumptions tested, ART still saves between 3% and 12% of total costs over 20 y. Finally, reducing HIV incidence as well as HIV prevalence in the starting population and recruits to low levels results in a much reduced HIV prevalence (1%) by 2022, representative of a low prevalence setting; in this sce-nario, the cost of HIV to the company reduces by 95% both without and with ART, with ART still saving 4% of costs.
The overall findings of the probabilistic sensitivity analysis agreed with the findings of the univariate sensitivity analysis, despite the wide ranges assigned to many model parameters, with over 98% of all model fits predicting that ART provision was cost-saving (Table 7). The analysis also reinforced the relative contribution of individual cost items to total cost (Table 8). The analysis of co-variance revealed that 69% of the variability in the total savings achieved with ART in the probabilistic sensitivity analysis (after 20 y and undiscounted) were explained by uncertainty in the costs of ART (64%), as well as in the difference between the upwards CD4-cell-count-defined health-state transition probabilities on ART compared to with well-ness care (21%) (seeS2andS3Figs), and in the outpatient costs on ART (15%). Interestingly, although the cost of ART is always a relatively small component of the total cost of HIV (5%– 11%), it can contribute significantly to offsetting the cost savings achieved with ART, with the cost of ART cancelling out 53% (90% CrI 32%–87%) of all potential savings. Importantly, the model projections suggest ART will always be cost-saving if it costs less than US$2,057 per patient-year. The large dependence of the estimated cost savings on the difference between the ART and wellness care health-state transition probabilities suggests that ART will not be cost-saving if it has little benefit for disease progression on top of what is already achieved with well-ness care.
The cost of HIV in the test and treat sensitivity scenario over 10 y (2013–2022) increases only marginally, by 0.2%, because of increased savings in terms of inpatient care, absenteeism, and benefit payments, which almost offsets the cost of the additional treatment occurring (Table 7). In the family treatment scenario, total cost with ART provision between 2013 and 2022 increases by 9%, but ART provision is still marginally cost-saving.
Discussion
employee healthcare use. This finding that ART is cost-saving is robust to the uncertainty around the model parameters as well as to other changes in numerous parameters or assump-tions, including if absenteeism is the same for employees on and off ART, if there are large reductions in benefit payments, and if HIV prevalence in the workforce is decreased to below 1%. The only instance where ART does not save costs over 20 y is if absenteeism in HIV-posi-tive employees is reduced by 50% or if no benefits are paid out—though the latter strategy still saves costs over 10 y. In addition, a strategy of offering HIV testing to all employees and imme-diate ART to all HIV-positive employees also results in savings to the cost of the HIV pro-gramme, suggesting test and treat be recommended as a powerful intervention for companies trying to preserve their employees’productivity. Offering ART to one family member for each HIV-positive employee, a generous assumption, reduces savings but is still cost-saving com-pared to no workplace ART provision.
Previous work has shown a heterogeneous impact of HIV on absenteeism and replacement cost. In a study of nearly a thousand firms operating in Africa in 1997, the impact of HIV on staff turnover was minimal, probably because of the lower HIV prevalence at that time, with difficulties in replacing professional staff being the most significant problem companies were facing [60]. In another study, the total cost per HIV infection to South African companies was estimated at US$2,094 to US$15,000 for an unskilled worker (in 2001 prices) and US$8,736 to US$65,000 for a manager [2]. A study of a Natal sugar mill found that on average 28 d were lost in each of the 2 y preceding retirement on grounds of ill-health and estimated that the cost of each HIV infection was roughly three times the employee’s annual salary per year [61]. Simi-larly, a large part of the savings in our analysis were due to a policy of benefits being paid to the employee or their family in the case of disability or death, which might not apply to other workplaces and might limit the generalisability of the results across workplaces and countries.
While our analysis adds to the body of knowledge on the economic impact of HIV and ART—through the use of detailed modelling incorporating a wealth of data on costs of HIV and ART outcomes from the same setting—our study nonetheless has limitations. First, it was limited to the direct cost of HIV to companies. In a previous study, the life insurer Metropoli-tan predicted that the indirect costs of HIV to business (including costs due to a loss in morale, legal costs, management costs, and labour consultation costs) could add up to 15% of the wage and salary budget by 2010 [62]. The provision of ART could improve morale and retention of skilled employees [5] as well as help safeguard the company’s license to mine [63]. Including this added indirect benefit of ART would have increased our savings from workplace ART pro-vision. Second, we used an average drug cost for first-line and second-line ART that slightly underestimated the cost of ART in the later years of the projection, when more employees needed second-line ART, and did not stratify ART cost by time on treatment. However, since few HIV-positive employees were on second-line treatment throughout the projection period and the cost of ART was a small proportion of total costs, this underestimation is unlikely to change our findings. Third, data for some of the model inputs, such as transitions between cer-tain CD4-cell-count-defined health states, was limited, resulting in uncercer-tainty around some estimates. The effect of this uncertainty was included in our model projections as well as tested in our sensitivity analysis, and our results were found to be robust to changes along plausible ranges for these parameters. However, the deterministic nature of the model prevented it from capturing the full inherent variability present in this workforce. Lastly, we did not examine the impact of HIV prevention policies on the miners or their families.
[63]. Finally, given our finding of the importance of the cost of ART in influencing cost savings, further reductions in the private sector cost of antiretroviral drugs remain crucial.
Conclusion
Providing HIV care, including ART, in a workforce with high HIV prevalence and high result-ing absenteeism and turnover can be cost-savresult-ing for the employer, with savresult-ings beresult-ing greater at higher ART coverage, and might provide respite to the strained resources of large-scale pub-lic sector programmes. Beyond making good business sense, a company-level HIV care pro-gramme including ART could go a long way towards improving the strained labour relations in the South African mining sector, especially when improved access to healthcare extends to the entire community [64]. It is crucial that strategies such as those under study here are repli-cated in other companies in similar settings.
Supporting Information
S1 Fig. Total annual cost with and without ART (discounted and undiscounted), 2003–
2022 (2010 USD). (TIF)
S2 Fig. Results of analysis of co-variance: yearly cost of ART. (TIF)
S3 Fig. Results of analysis of co-variance: difference between wellness care and ART transi-tion probabilities.
(TIF)
S1 Text. Details on parameter estimation, probabilistic sensitivity analysis, and model cal-culations.
(PDF)
Acknowledgments
The authors are grateful to Salome Charalambous for her contribution to the clinical pro-gramme at the workplace, to Craig Innes for facilitating access to clinical datasets, to Thia Gro-bler, Sue Ingle, Margaret May, and Amy Huber for providing additional model inputs, and to the staff at the mines included in this study. This paper is dedicated to Wim Richter.
Author Contributions
Conceived and designed the experiments: GMR BB DM CW PV. Performed the experiments: GMR AvZ DM PV. Analyzed the data: GMR JP DM AvZ. Contributed reagents/materials/ analysis tools: GMR JP GC AG PV. Wrote the first draft of the manuscript: GMR. Contributed to the writing of the manuscript: GMR JP BB DM AvZ AG GC CW PV. Agree with the manu-script’s results and conclusions: GMR JP BB DM AvZ AG GC CW PV. Built the model: GMR PV AvZ. All authors have read, and confirm that they meet, ICMJE criteria for authorship.
References
1. Rosen S, Simon J, MacLeod W, Fox M, Thea DM. AIDS is your business. Harv Bus Rev. 2003; 81:5–
11.
3. Rosen S, Feeley F, Connelly P, Simon J. The private sector and HIV/AIDS in Africa: taking stock of 6 years of applied research. AIDS. 2007; 21 Suppl 3:S41–S51. PMID:17666961
4. Rajak D.‘HIV/AIDS is our business’: the moral economy of treatment in a transnational mining com-pany. J R Anthropol Inst. 2010; 16:551–571.
5. Brink B, Pienaar J. Business and HIV/AIDS: the case of Anglo American. AIDS. 2007; 21 Suppl 3:S79–
S84. PMID:17666965
6. Greener R. Impact of HIV/AIDS and options for intervention: results of a five company pilot study. Work-ing Paper No. 10. Gaborone: Botswana Institute of Development Policy Analysis; 1997.
7. Feeley F, Bukuluki P, Collier A, Fox M. The impact of HIV/AIDS on productivity and labor costs in two Ugandan corporations. Boston: Center for International Health and Development, Boston University; 2004.
8. AIDS Control and Prevention Project. Private sector AIDS policy: African workplace profiles. Washing-ton (District of Columbia): Family Health International; 1995.
9. Fox MP, Rosen S, MacLeod WB, Wasunna M, Bii M, Foglia G, et al. The impact of HIV/AIDS on labour productivity in Kenya. Trop Med Int Health. 2004; 9:318–324. PMID:14996359
10. Joint United Nations Programme on HIV/AIDS. Global report: UNAIDS report on the global AIDS
epi-demic 2013. Geneva: Joint United Nations Programme on HIV/AIDS; 2013.
11. Shisana O, Rehle T, Simbayi LC, Zuma K, Jooste S, Pillay-van-Wyk V, et al. South African national HIV prevalence, incidence, behaviour and communication survey, 2008: a turning tide among teenagers? Cape Town: HSRC Press; 2009.
12. Shisana O, Rehle T, Simbayi LC, Zuma K, Jooste S, Zungu N, et al. South African national HIV preva-lence, incidence and behaviour survey, 2012. Cape Town: HSRC Press; 2014.
13. Evian C, Fox M, MacLeod B, Slotow S, Rosen S. Prevalence of HIV in workforces in southern Africa, 2000–2001. S Afr Med J. 2004; 94:125–130. PMID:15034992
14. Harling G, Wood R. The evolving cost of HIV in South Africa: changes in health care cost with duration on antiretroviral therapy for public sector patients. J Acquir Immune Defic Syndr. 2007; 45:348–354.
15. Rosen S, Ketlhapile M, Sanne I, Bachman DeSilva M. Cost to patients of obtaining treatment for HIV/
AIDS in South Africa. S Afr Med J. 2007; 97:524–529. PMID:17805455
16. Rosen S, Long L, Sanne I. The outcomes and outpatient costs of different models of antiretroviral treat-ment delivery in South Africa. Trop Med Int Health. 2008; 13:1005–1015. doi:10.1111/j.1365-3156.
2008.02114.xPMID:18631314
17. Rosen S, Long L, Fox M, Sanne I. Cost and cost-effectiveness of switching from stavudine to tenofovir in first-line antiretroviral regimens in South Africa. J Acquir Immune Defic Syndr. 2008; 48:334–344. 18. Stearns BK, Evans DK, Lutung P, Wagner G, Ryan G, Aledort JE. Primary estimates of the costs of
ART care at 5 AHF clinics in sub-Saharan Africa. Abstract MOPE0706. XVIIth International AIDS Con-ference; 3–8 Aug 2008; Mexico City, Mexico.
19. Leisegang R, Cleary S, Hislop M, Davidse A, Regensberg L, Little F, et al. Early and late direct costs in a Southern African antiretroviral treatment programme: a retrospective cohort analysis. PLoS Med. 2009; 6:e1000189. doi:10.1371/journal.pmed.1000189PMID:19956658
20. Martinson N, Mohapi L, Bakos D, Gray LE, McIntyre JA, Holmes CB. Costs of providing care for HIV-infected adults in an urban HIV clinic in Soweto, South Africa. J Acquir Immune Defic Syndr. 2009; 50:327–330.
21. Kevany S, Meintjes G, Rebe K, Maartens G, Cleary S. Clinical and financial burdens of secondary level care in a public sector antiretroviral roll-out setting (G F Jooste Hospital). S Afr Med J. 2009; 99:320–
325. PMID:19588792
22. Long L, Fox M, Sanne I, Rosen S. The high cost of second-line antiretroviral therapy for HIV/AIDS in South Africa. AIDS. 2010; 24:915–919. doi:10.1097/QAD.0b013e3283360976PMID:20042849
23. Long L, Brennan A, Fox MP, Ndibongo B, Jaffray I, Sanne I, et al. Treatment outcomes and
cost-effec-tiveness of shifting management of stable ART to nurses in South Africa: an observational cohort. PLoS Med. 2011; 8:e1001055. doi:10.1371/journal.pmed.1001055PMID:21811402
24. Cleary S, Blecher M, Boulle A, Dorrington R, Darkoh E, Bogopane-Zulu H. The costs of the National Strategic Plan on HIV and AIDS & STIs 2007–2011. Cape Town: University of Cape Town, National Treasury, Broadreach Health Care, and South African Parliament; 2007. doi:10.1080/17441692.2013. 790461PMID:23651436
26. Meyer-Rath G, Miners A, Santos A, Variava E, Venter F. Cost and resource use of patients on antiretro-viral therapy in the urban and semi-urban public sectors of South Africa. J Acquir Immune Defic Syndr. 2012; 61:e25–e32. doi:10.1097/QAI.0b013e31826cc575PMID:22895437
27. Meyer-Rath G, Brennan A, Fox MP, Modisenyane T, Tshabangu N, Mohapi L, et al. Rates and cost of hospitalisation before and after initiation of antiretroviral therapy in the urban and rural public sector of South Africa. J Acquir Immune Defic Syndr. 2013; 62:322–328. PMID:23187948
28. Leisegang R, Maartens G, Hislop M, Sargent J, Darkoh E, Cleary S. A novel Markov model projecting costs and outcomes of providing antiretroviral therapy to public patients in private practices versus pub-lic clinics in South Africa. PLoS ONE. 2013; 8:e53570. doi:10.1371/journal.pone.0053570PMID: 23405073
29. Cleary S, McIntyre D, Boulle A. The cost-effectiveness of antiretroviral treatment in Khayelitsha, South Africa—a primary data analysis. Cost Eff Resour Alloc. 2006; 4:20. PMID:17147833
30. Badri M, Maartens G, Mandalia S, Bekker L-G, Penrod JR, Platt RW, et al. Cost-effectiveness of highly active antiretroviral therapy in South Africa. PLoS Med. 2006; 3:e4. PMID:16318413
31. Bachmann MO. Effectiveness and cost effectiveness of early and late prevention of HIV/AIDS progres-sion with antiretrovirals or antibiotics in Southern African adults. AIDS Care. 2006; 18:109–120. PMID: 16338768
32. Holmes CB, Zheng H, Martinson NA, Freedberg KA, Walensky RP. Optimizing treatment for HIV-infected South African women exposed to single-dose nevirapine: balancing efficacy and cost. Clin Infect Dis. 2006; 42:1772–1780. PMID:16705586
33. Granich RM, Gilks CF, Dye C, De Cock KM, Williams BG. Universal voluntary HIV testing with immedi-ate antiretroviral therapy as a strimmedi-ategy for elimination of HIV transmission: a mathematical model. Lan-cet. 2009; 373:48–57. doi:10.1016/S0140-6736(08)61697-9PMID:19038438
34. Cleary S, Mooney G, McIntyre D. Equity and efficiency in HIV-treatment in South Africa: the contribution of mathematical programming to priority setting. Health Econ. 2009; 19:1166–1180.
35. Cleary S, McIntyre D. Financing equitable access to antiretroviral treatment in South Africa. BMC
Health Serv Res. 2010; 10 Suppl 1:S2. doi:10.1186/1472-6963-10-S1-S2PMID:20594368
36. Walensky RP, Wolf LL, Wood R, Fofana MO, Freedberg KA, Martinson NA, et al. When to start antire-troviral therapy in resource-limited settings. Ann Int Med. 2009; 151:157–166. PMID:19620143 37. Walensky RP, Wood R, Ciaranello AL, Paltiel AD, Lorenzana SB, Anglaret X, et al. Scaling up the 2010
World Health Organization HIV treatment guidelines in resource-limited settings: a model-based analy-sis. PLoS Med. 2010; 7:e1000382. doi:10.1371/journal.pmed.1000382PMID:21209794
38. Wagner B, Blower S. Costs of eliminating HIV in South Africa have been underestimated. Lancet. 2010; 376:953. doi:10.1016/S0140-6736(10)61442-0PMID:20851250
39. Hontelez JAC, de Vlas SJ, Tanser F, Bakker R, Bärnighausen T, Newell ML, et al. The impact of the new WHO antiretroviral treatment guidelines on HIV epidemic dynamics and cost in South Africa. PLoS ONE. 2011; 6:e21919. doi:10.1371/journal.pone.0021919PMID:21799755
40. Bendavid E, Grant P, Talbot A, Owens DK, Zolopa A. Cost-effectiveness of antiretroviral regimens in
the World Health Organization’s treatment guidelines: a South African analysis. AIDS. 2011; 25:211–
220. doi:10.1097/QAD.0b013e328340fdf8PMID:21124202
41. Ciaranello AL, Lockman S, Freedberg KA, Hughes M, Chu J, Currier J, et al. First-line antiretroviral ther-apy after single-dose nevirapine exposure in South Africa: a cost-effectiveness analysis of the OCTANE trial. AIDS. 2011; 25:479–492. doi:10.1097/QAD.0b013e3283428cbePMID:21293199
42. Hallett TB, Baeten JM, Heffron R, Barnabas R, de Bruyn G, Cremin Í, et al. Optimal uses of antiretrovi-rals for prevention in HIV-1 serodiscordant heterosexual couples in South Africa: a modelling study. PLoS Med. 2011; 8:e1001123. doi:10.1371/journal.pmed.1001123PMID:22110407
43. Eaton JW, Menzies NA, Stover J, Cambiano V, Chindelevitch L, Cori A, et al. Health benefits, costs, and cost-effectiveness of earlier eligibility for adult antiretroviral therapy and expanded treatment cover-age: a combined analysis of 12 mathematical models. Lancet Glob Health. 2013; 2:23–34. doi:10. 1016/S2214-109X(13)70172-4PMID:25083415
44. Granich R, Kahn JG, Bennett R, Holmes CB, Garg N, Serenata C, et al. Expanding ART for treatment and prevention of HIV in South Africa: estimated cost and cost-effectiveness 2011–2050. PLoS ONE. 2012; 7:e30216. doi:10.1371/journal.pone.0030216PMID:22348000
45. Alistar SS, Grant PM, Bendavid E. Comparative effectiveness and cost-effectiveness of antiretroviral therapy and pre-exposure prophylaxis for HIV prevention in South Africa. BMC Med. 2014; 12:46. doi: 10.1186/1741-7015-12-46PMID:24629217
47. Larson BA, Fox MP, Rosen S, Bii M, Sigei C, Shaffer D, et al. Do the socioeconomic impacts of antire-troviral therapy vary by gender? A longitudinal study of Kenyan agricultural worker employment out-comes. BMC Public Health. 2009; 9:240. doi:10.1186/1471-2458-9-240PMID:19604381
48. Thirumurthy H, Zivin JG, Goldstein M. The economic impact of AIDS treatment: labor supply in western Kenya. J Hum Resour. 2008; 43:511–552. PMID:22180664
49. Fox MP, McCoy K, Larson BA, Rosen S, Bii M, Sigei C, et al. Improvements in physical wellbeing over
the first two years on antiretroviral therapy in western Kenya. AIDS Care. 2010; 22:137–145. doi:10. 1080/09540120903038366PMID:20390492
50. Habariyamana J, Mbakile B, Pop-Eleches C. The impact of HIV/AIDS and ARV treatment on worker absenteeism- implications for African firms. J Hum Resour. 2010; 45:809–839.
51. Marseille E, Saba J, Muyingo S, Kahn JG. The costs and benefits of private sector provision of
treat-ment to HIV-infected employees in Kampala, Uganda. AIDS. 2006; 20:907–914. PMID:16549976
52. Ingle SM. Modelling waiting times for HIV antiretroviral therapy in South Africa: patient management, outcomes and treatment rationing strategies in the Free State Province. PhD dissertation. University of Bristol. 2010.
53. Huber A, Pienaar J, Innes C, Felix M, Churchyard GJ, Hoffmann CJ, et al. Impact of universal VCT on population HIV incidence within a cohort of South African coal miners. International AIDS Society Con-ference; 17–20 July 2011; Rome, Italy.
54. Muirhead D, Kumaranayake L, Pozo-Martin F, Charalambous S, Pemba L, Grant A. Early savings resulting from employer-sponsored ART in a large South African workforce setting. Abstract 652. 2nd South African AIDS Conference; 7–10 June 2005; Durban, South Africa.
55. Charalambous S, Innes C, Muirhead D, Kumaranayake L, Fielding K, Pemba L, et al. Evaluation of a workplace HIV treatment programme in South Africa. AIDS. 2007; 21 Suppl 3:S73–S78. PMID:
17666964
56. South African Reserve Bank. Repo rate. Available:http://www.resbank.co.za/Research/Rates/Pages/ Repo%20Rate.aspx. Accessed 29 July 2015.
57. Briggs AH, Sculpher MJ, Claxton K. Decision modelling for health economic evaluation. 1st ed. Oxford: Oxford University Press; 2006.
58. Meyer-Rath G, Brennan A, Long L, Rosen S, Fox MP. Survival in care and CD4 cell count gain on first‐
line ART depend on prior CD4 cell count and time on treatment: evidence from a large South African cohort. Abstract Z-148. 17th Conference on Retroviruses and Opportunistic Infections; 16–19 February 2010; San Francisco, US.
59. Meyer-Rath G, Pillay Y, Blecher M, Brennan A, Long L, Johnson LF, et al: Total cost and potential cost savings of the national antiretroviral treatment (ART) programme in South Africa 2010 to 2017. Abstract WEAE0201. XVIII International AIDS Conference; 18–23 July 2010; Vienna, Austria.
60. Biggs T, Shah M. The impact of the AIDS epidemic on African firms. RPED Discussion Paper #72. Washington (District of Columbia): World Bank, Africa Region; 1997.
61. Morris C, Burdge D, Cheevers E. Economic impact of HIV infection in a cohort of sugar mill workers in
South Africa. S Afr J Econ. 2000; 68:413–419.
62. Moore D. The AIDS threat and the private sector. AIDS Anal Afr. 1999; 9:1–2. PMID:12349149 63. Republic of South Africa Department of Mineral Resources. Amendment of the broad-based
socio-eco-nomic empowerment charter for the South African mining and minerals industry. Pretoria: Republic of South Africa Department of Mineral Resources; 2010.