HESSD
7, 9599–9630, 2010Macroinvertebrate responses to a dewatering gradient
J. D. Muehlbauer et al.
Title Page
Abstract Introduction
Conclusions References
Tables Figures
◭ ◮
◭ ◮
Back Close
Full Screen / Esc
Printer-friendly Version Interactive Discussion
Discussion
P
a
per
|
Dis
cussion
P
a
per
|
Discussion
P
a
per
|
Discussio
n
P
a
per
|
Hydrol. Earth Syst. Sci. Discuss., 7, 9599–9630, 2010 www.hydrol-earth-syst-sci-discuss.net/7/9599/2010/ doi:10.5194/hessd-7-9599-2010
© Author(s) 2010. CC Attribution 3.0 License.
Hydrology and Earth System Sciences Discussions
This discussion paper is/has been under review for the journal Hydrology and Earth System Sciences (HESS). Please refer to the corresponding final paper in HESS if available.
Macroinvertebrate community responses
to a dewatering disturbance gradient in a
restored stream
J. D. Muehlbauer1, M. W. Doyle1,2, and E. S. Bernhardt3
1
Curriculum for the Environment and Ecology, University of North Carolina, Chapel Hill, NC, USA
2
Department of Geography, University of North Carolina, Chapel Hill, NC, USA
3
Biology Department, Duke University, Durham, NC, USA Received: 22 November 2010 – Accepted: 10 December 2010
– Published: 17 December 2010
Correspondence to: J. D. Muehlbauer ([email protected])
HESSD
7, 9599–9630, 2010Macroinvertebrate responses to a dewatering gradient
J. D. Muehlbauer et al.
Title Page
Abstract Introduction
Conclusions References
Tables Figures
◭ ◮
◭ ◮
Back Close
Full Screen / Esc
Printer-friendly Version Interactive Discussion
Discussion
P
a
per
|
Dis
cussion
P
a
per
|
Discussion
P
a
per
|
Discussio
n
P
a
per
Abstract
Dewatering disturbances are common in aquatic systems and represent a relatively un-tapped field of disturbance ecology, yet studying dewatering events along gradients in non-dichotomous (i.e., wet/dry) terms is often difficult. Because many stream restora-tions can essentially be perceived as planned hydrologic manipularestora-tions, such systems 5
can make ideal test-cases for understanding processes of hydrological disturbance. In this study we used an experimental drawdown in a 440 ha stream/wetland restoration site to assess aquatic macroinvertebrate community responses to dewatering and sub-sequent rewetting. The geomorphic nature of the site and the design of the restoration allowed dewatering to occur predictably along a gradient and decoupled the hydrologic 10
response from any geomorphic (i.e., habitat heterogeneity) effects. In the absence of such heterogeneous habitat refugia, reach-scale wetted perimeter and depth condi-tions exerted a strong control on community structure. The community exhibited an incremental response to dewatering severity over the course of this disturbance, which was made manifest not as a change in community means but as an increase in commu-15
nity variability, or dispersion, at each site. The dewatering also affected inter-species abundance and distributional patterns, as dewatering and rewetting promoted alternate species groups with divergent habitat tolerances. Finally, our results indicate that rapid rewetting – analogous to a hurricane breaking a summer drought – may represent a recovery process rather than an additional disturbance and that such processes, even 20
in newly restored systems, may be rapid.
1 Introduction
Community response to disturbance has long been of central interest to ecologists, and the frequency, type, magnitude, and timing of disturbance can be critical in under-standing how communities are able to respond to these events (e.g., Clements, 1936; 25
HESSD
7, 9599–9630, 2010Macroinvertebrate responses to a dewatering gradient
J. D. Muehlbauer et al.
Title Page
Abstract Introduction
Conclusions References
Tables Figures
◭ ◮
◭ ◮
Back Close
Full Screen / Esc
Printer-friendly Version Interactive Discussion
Discussion
P
a
per
|
Dis
cussion
P
a
per
|
Discussion
P
a
per
|
Discussio
n
P
a
per
|
from less-disturbed areas within the same ecosystem type (Collins, 2000), and dis-turbance can act as a filter limiting diversity and community composition (Lepori and Malmqvist, 2009). Threshold responses to disturbance are also possible, such that a disturbance of sufficient magnitude may allow communities to transition to a new or alternative stable state (Suding et al., 2004). Many of these community response stud-5
ies emphasize how disturbance initiates a change in the community mean or centroid, whereby different taxa are present pre- and post-disturbance. However, another pos-sible response is for communities to simply become more variable with respect to their relative species composition and abundances (i.e. exhibit an increase in community dispersion across sites) over the course of a disturbance, without necessarily affecting 10
the mean of the community ordination (Warwick and Clarke, 1993; Houseman et al., 2008). Yet, to our knowledge, such assessments of dispersion are rare, especially in stream ecosystems.
In streams, Lake (2000) characterized disturbances as falling into 3 classes: (1) rapid, “pulse” disturbances, such as floods; (2) chronic, “press” disturbances, such 15
as persistent toxicant additions; and (3) “ramp” disturbances that increase in severity over time, such as most droughts. Both pulse and ramp-type disturbances are implicitly linked to stream flow and the hydrologic regime, with floods, in particular, having re-ceived substantial emphasis from stream ecologists (Resh et al., 1988; Poffand Ward, 1989). Macroinvertebrates and other groups of stream biota often depend on particu-20
lar hydrologic conditions (Hart and Finelli, 1999), and stream flow characteristics can limit biotic assemblages on both seasonal and interannual timescales (Konrad et al., 2008). Extreme flow alterations can induce regime shifts in communities (Robinson and Uehlinger, 2008) and may reduce diversity and lead to alterations in species dom-inance (Rader and Belish, 1999). The magnitude of a flow disturbance, rather than 25
HESSD
7, 9599–9630, 2010Macroinvertebrate responses to a dewatering gradient
J. D. Muehlbauer et al.
Title Page
Abstract Introduction
Conclusions References
Tables Figures
◭ ◮
◭ ◮
Back Close
Full Screen / Esc
Printer-friendly Version Interactive Discussion
Discussion
P
a
per
|
Dis
cussion
P
a
per
|
Discussion
P
a
per
|
Discussio
n
P
a
per
Bunn and Arthington (2002) have noted that a unified theory for biotic response to flow alteration is still lacking, and have argued for a more theoretical approach.
In comparison to floods, dewaterings (including droughts, agricultural withdrawals, dam diversions, etc.) have been historically understudied in stream ecology (Lake, 2003). This is most likely due to the constraints inherent in designing a sampling 5
strategy to capture fairly unpredictable, drought-type disturbances rather than a lack of interest in these phenomena. In general, studies that have focused on biotic responses to dewatering disturbances have shown recovery to be rapid (Boulton, 2003), but these have strongly emphasized the importance of habitat heterogeneity in providing refugia that allow a subset of organisms to persist in severely dry conditions (Dewson et al., 10
2007a; Bond et al., 2008; James et al., 2008). However, one study showed that there was often no change in invertebrate densities after droughts (Suren and Jowett, 2006), and another found that invertebrate density actually increased during water abstraction because drying forced invertebrates to congregate in a smaller area, although species richness and evenness did decrease (Dewson et al., 2007b). Most of these studies 15
also cast dewatering disturbances in dichotomous terms (e.g. the stream is experi-encing drought or it is not). In the few studies where aquatic community responses along a gradient of dewatering severity have been described, changes in community abundance, density, richness, etc. have been proportional to the magnitude of flow re-duction (Miller et al., 2007), although decreases in abundance may only be observed 20
in the least tolerant taxa (James and Suren, 2009).
In the face of climate change and human development increasing the incidence of such extreme hydrologic events (i.e. floods and droughts) as well as habitat loss and fragmentation (including stream channelization and burial), and water quality concerns (eutrophication, sediment and chemical pollution) worldwide, stream and river restora-25
HESSD
7, 9599–9630, 2010Macroinvertebrate responses to a dewatering gradient
J. D. Muehlbauer et al.
Title Page
Abstract Introduction
Conclusions References
Tables Figures
◭ ◮
◭ ◮
Back Close
Full Screen / Esc
Printer-friendly Version Interactive Discussion
Discussion
P
a
per
|
Dis
cussion
P
a
per
|
Discussion
P
a
per
|
Discussio
n
P
a
per
|
(Palmer et al., 2005). They also pose a challenge to practitioners in that they require an explicit synthesis of hydrology and ecology, and many ecohydrological questions per-tinent to restoration success remain unanswered (Palmer and Bernhardt, 2006). But stream restoration can contribute fundamentally to basic ecology as well: Restoration projects often involve massive disturbances, channel creation, or other changes in en-5
vironmental and biological conditions that are predictable and relatively controlled. As such, stream restoration sites can make ideal test sites for improving our understand-ing of many ecological principles, includunderstand-ing disturbance, connectivity, and ecosystem functional response (Lake et al., 2007).
In this study, we characterize the spatio-temporal changes in aquatic macroinverte-10
brate communities along an experimental dewatering gradient. This research opportu-nity was made possible by a stream restoration at the site, which allowed conditions to be manipulated and ecological principles to be tested in a fairly rigorous fashion: The nature of the dewatering gradient and the predictable manipulation and timing of the dewatering allowed us to compare community responses to drought-like conditions at 15
sites that became nearly dry simultaneously with nearby sites that were only minimally affected, and to do so at several intervals pre-, during-, and post-dewatering. Due to the unique geomorphology and history of the site, microhabitat refugia formation during the dewatering was minimal, so community responses would be due strictly to changes in metrics like channel depth or water quality.
20
2 Methods
2.1 Site description
This study was conducted at the Timberlake mitigation site, located Carolina (Fig. 1). Timberlake is a 1000 ha former corn/soybean near the Albemarle Sound estuary on the outer coastal plain of North field, and has been a site of riverine/wetland restora-25
HESSD
7, 9599–9630, 2010Macroinvertebrate responses to a dewatering gradient
J. D. Muehlbauer et al.
Title Page
Abstract Introduction
Conclusions References
Tables Figures
◭ ◮
◭ ◮
Back Close
Full Screen / Esc
Printer-friendly Version Interactive Discussion
Discussion
P
a
per
|
Dis
cussion
P
a
per
|
Discussion
P
a
per
|
Discussio
n
P
a
per
5.1 m a.s.l. and few naturally-occurring (non-agricultural) channels for water flow (Ard ´on et al., 2010). Restoration activities included digging new channels beginning in 2004 to enhance the lotic character of the site and turning off or closing the downstream pump/flapgate complex that had previously drained or dewatered the site to allow for agriculture. Turning offthese pumps allowed 440 ha of the site to re-flood with fresh-5
water to an average depth of 1 m in 2007; this area is the focus of this study. Under typical conditions, Timberlake is visually like a wetland; nonetheless, it maintains lotic character via downstream flowpaths and wind tides (Ard ´on et al., 2010; Fig. 1). Un-der dewatered conditions the flooded wetland mostly drained, emphasizing these lotic conditions because the only remaining water was located within the dug channel. 10
As part of ongoing research at Timberlake, an experimental drawdown of the water level was conducted on 18 August 2008. This dewatering was initiated by opening the downstream flapgates, turning the downstream pumps back on, and allowing them to operate as they had during agricultural operations, which dewatered the site in<1 day. Rewetting occurred after 15 days of dewatered conditions by turning the pumps 15
offagain, re-flooding the site over<1 day on 2 September 2008. Hurricane Hanna also passed over the area on 5 September 2008 (3 days post-rewetting), exposing the site to additional water inputs from precipitation in addition to wind disturbance.
Not all wetted areas across the site were equally affected by this dewatering. When the primary channel was created during the restoration, a geomorphic invert was en-20
countered where the grade of the land prevented a channel from being dug upstream past that region (Fig. 1). Whereas the main channels carrying water downstream below the geomorphic invert were fairly distinct, flowpaths above the invert were more diffuse and unchannelized (Bogardus, B., unpublished data). Following the initial re-flooding a beaver also created a dam in the geomorphic invert region, further segregating the 25
HESSD
7, 9599–9630, 2010Macroinvertebrate responses to a dewatering gradient
J. D. Muehlbauer et al.
Title Page
Abstract Introduction
Conclusions References
Tables Figures
◭ ◮
◭ ◮
Back Close
Full Screen / Esc
Printer-friendly Version Interactive Discussion
Discussion
P
a
per
|
Dis
cussion
P
a
per
|
Discussion
P
a
per
|
Discussio
n
P
a
per
|
Our sampling design consisted of intensive repeat sampling at 6 sites along this dewatering gradient. Five sites were located along the major gradient. An additional 6th site was far upstream of the geomorphic invert, at a location that was not strongly hydrologically-connected to the other sites and that was meant to serve as an undis-turbed control (Fig. 1). Each of these sites was sampled 7 times: 1 day pre-dewatering 5
at day 0, during the dewatering at days 4, 7, and 14, and post-dewatering and rewetting at days 20, 26, and 32 (the pumps were turned offon day 15).
2.2 Channel cross sections and water quality
The effect of the dewatering on riparian and channel habitat was quantified in part as change in wetted perimeter (WP) and depth using channel cross sections at all 6 sites. 10
Cross sections were surveyed using a total station (Trimble, Sunnyvale, CA, USA) at the first during-dewatering sample when the water level was at its lowest. Water level was also noted pre-dewatering by placing pin flags, which were then surveyed in with the rest of the cross section in addition to the dewatered water levels. The post-dewatering (rewetting) water level was similar to pre-dewatering, so no additional 15
points were surveyed and water level at these 2 conditions is assumed to be equal for the analysis.
A suite of water quality parameters, including water temperature, specific conductiv-ity (SpC, and correlated salinconductiv-ity), pH, and oxidation-reduction potential (redox potential, ORP) were measured at the time of each sampling using a YSI 556 multiprobe (Yel-20
low Springs, Ohio, USA). Most samples were taken in repeated locations under similar conditions at the same time of day; however, this was not always the case for every sample. As such, fluctuations in some measurements (especially temperature) did oc-cur, as measurements between adjacent sample dates could be separated by as much as 2 h in terms of time of day of sampling.
HESSD
7, 9599–9630, 2010Macroinvertebrate responses to a dewatering gradient
J. D. Muehlbauer et al.
Title Page
Abstract Introduction
Conclusions References
Tables Figures
◭ ◮
◭ ◮
Back Close
Full Screen / Esc
Printer-friendly Version Interactive Discussion
Discussion
P
a
per
|
Dis
cussion
P
a
per
|
Discussion
P
a
per
|
Discussio
n
P
a
per
2.3 Macroinvertebrate sampling
Macroinvertebrates were collected at every site for every sampling event using a mod-ification of the North Carolina Division of Water Quality “Swamp Method,” which was designed for use in outer coastal plain ecosystems (like Timberlake) with little apprecia-ble flow (NCDWQ, 2006). Our particular sampling strategy involved standing in a fixed 5
location in the channel 1 m offthe bank and sampling all habitats – including both the channel thalweg (deepest point) and bank macrophyte vegetation – within reach of a D-frame dip net (500-m mesh) with a 1.2 m handle. These samples were then field-picked exhaustively for 30 min, which we estimate was sufficient to remove>95% of macroin-vertebrates from each sample. In rare cases where collected abundances were high 10
enough to require more picking time, the sample remaining after 30 min was stored and picked to completion later under a magnifying glass in the laboratory. This type of sampling strategy is “semi-quantitative,” but nonetheless allows reasonable estimates of macroinvertebrate abundance and density to be made and is standard practice for biomonitoring in NC state agencies (NCDWQ, 2006). All collected macroinvertebrates 15
were stored in 95% ethanol and were identified using dichotomous keys (e.g., Merritt et al., 2008). To improve the strength of our community-level inferences, macroinverte-brates were identified to the highest resolution possible given our identification facilities. This was generally to the genus or species level, with the exception of someDiptera
and non-Insecta that were identified to the family level or higher. 20
Macroinvertebrate communities were analyzed primarily using a non-metric multi-dimensional scaling (NMS) ordination approach (Shepard, 1962; Kruskal, 1964) with a Bray-Curtis distance measure (Bray and Curtis, 1957; McCune and Grace, 2002). All data were analyzed using R statistical software (R Development Core Team, 2009), especially within the contributed packagevegan (Oksanen et al., 2009). After prelimi-25
HESSD
7, 9599–9630, 2010Macroinvertebrate responses to a dewatering gradient
J. D. Muehlbauer et al.
Title Page
Abstract Introduction
Conclusions References
Tables Figures
◭ ◮
◭ ◮
Back Close
Full Screen / Esc
Printer-friendly Version Interactive Discussion
Discussion
P
a
per
|
Dis
cussion
P
a
per
|
Discussion
P
a
per
|
Discussio
n
P
a
per
|
removed from the macroinvertebrate portion of the analysis. To facilitate the interpreta-tion of relainterpreta-tionships between samples and to minimize apparently large dissimilarities based on rare taxa, only taxa present in 3 or more (≥5%) of samples were kept in the dataset. Because samples and individual taxon abundances often varied by more than an order of magnitude, the data were log-transformed (log(x+1)) to minimize the 5
effect of this spread (McCune and Grace, 2002). Although another transformation (e.g. square root) may not have required this monotonic (i.e.x+1) addition, we felt that the ecological rationale for the log distribution in nature (Limpert et al., 2001) made the log transformation the best choice. The appropriate number of axes for the ordination was determined using a step-down procedure from 6 axes, each with a maximum of 100 10
random starts to find a stable solution using the function metaMDS invegan(McCune and Grace, 2002; Oksanen et al., 2009). Comparing a scree plot of stress values from these 6 ordinations suggested that the stable 3-axis solution with a stress of 14.51 was best, and was used for the rest of the analysis.
Significance tests for differences between community groups (i.e. groupings at a site 15
over time or at one time over all sites) were carried out using permutational MANOVA tests (Anderson, 2001), again using Bray-Curtis similarity (McCune and Grace, 2002) and theveganpackage in R (Oksanen et al., 2009; R Development Core Team, 2009). Overall and pairwise differences in community variability (dispersion from the commu-nity centroid in ordination space) were assessed by permutational analysis of disper-20
HESSD
7, 9599–9630, 2010Macroinvertebrate responses to a dewatering gradient
J. D. Muehlbauer et al.
Title Page
Abstract Introduction
Conclusions References
Tables Figures
◭ ◮
◭ ◮
Back Close
Full Screen / Esc
Printer-friendly Version Interactive Discussion
Discussion
P
a
per
|
Dis
cussion
P
a
per
|
Discussion
P
a
per
|
Discussio
n
P
a
per
3 Results
3.1 Wetted perimeter, depth, and water quality
Due to the geomorphic invert, dewatering-initiated changes in wetted perimeter were linearly-related to each site’s proximity to the downstream pumps; although wetted perimeter at the most upstream site was nearly unaffected by dewatering, the change 5
in wetted perimeter at the most downstream (extreme effect) site was dramatic (Fig. 1). The change in depth from pre/post- to during-dewatering followed the same pattern with an exception at the moderate effect site, where depth changed less than at any other site. The width:depth ratio of this site was higher than elsewhere, so while wetted perimeter changed consistently with the site’s position along the dewatering gradient, 10
most of this change was in the width, and depth was not as strongly affected.
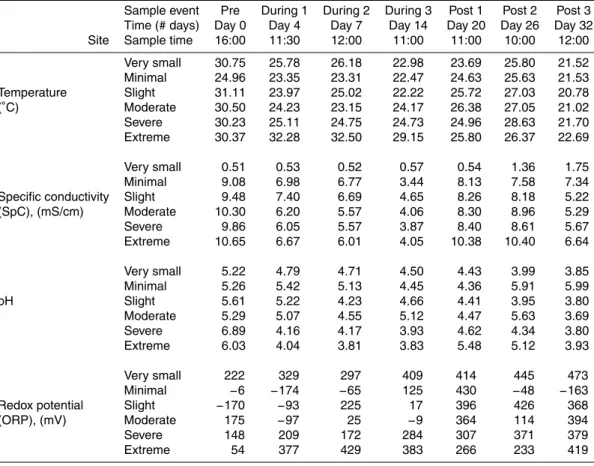
Water temperatures varied somewhat over the course of the study, partially in re-sponse to variability in the time of day in which measurements were taken (Table 1). Additionally, temperature decreased over the course of the dewatering, increased for 12 days post-rewetting, then fell again. Measured values for pH varied from neutral 15
to very acidic and did not follow a consistent pattern over time, although the water at all sites was more acidic at the time of the last post-dewatering sample than pre-dewatering. Finally, specific conductivity results divided into 2 groups: the site with a very small dewatering effect had low, relatively stable SpC values throughout the study while SpC at the remaining 5 sites decreased throughout the dewatering, in-20
creased for 12 days post-rewetting, then dropped again by the last sample.
3.2 Community responses
HESSD
7, 9599–9630, 2010Macroinvertebrate responses to a dewatering gradient
J. D. Muehlbauer et al.
Title Page
Abstract Introduction
Conclusions References
Tables Figures
◭ ◮
◭ ◮
Back Close
Full Screen / Esc
Printer-friendly Version Interactive Discussion
Discussion
P
a
per
|
Dis
cussion
P
a
per
|
Discussion
P
a
per
|
Discussio
n
P
a
per
|
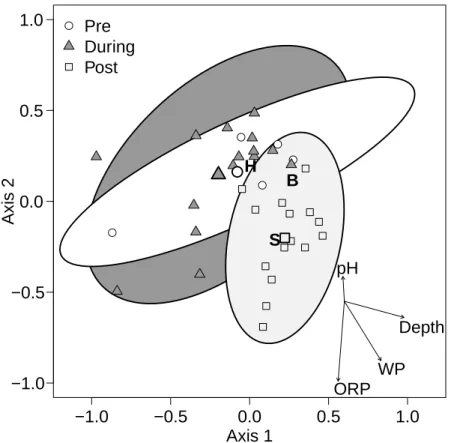
to the axes (Table 2). Most notably, wetted perimeter and depth were correlated with the first axis, while ORP, wetted perimeter, and, to a lesser extent, pH and depth, were correlated with the second axis.
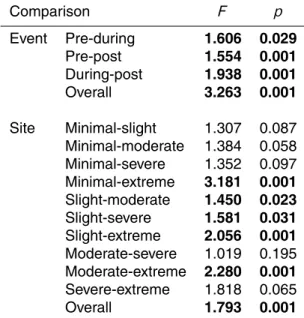
When samples from the 5 dewatering gradient sites were grouped together accord-ing to samplaccord-ing event (pre-, duraccord-ing-, or post-dewateraccord-ing; Fig. 2), results from permuta-5
tional MANOVA tests suggested that each of these 3 communities differed from each other (Table 3). Because there was so little change in mean community composition (based on the group’s centroid) from pre- to during-dewatering, the difference between these 2 communities may be inferred to be due to a change in community variability, or dispersion (Fig. 2). However, although a PERMDISP test showed an increase in 10
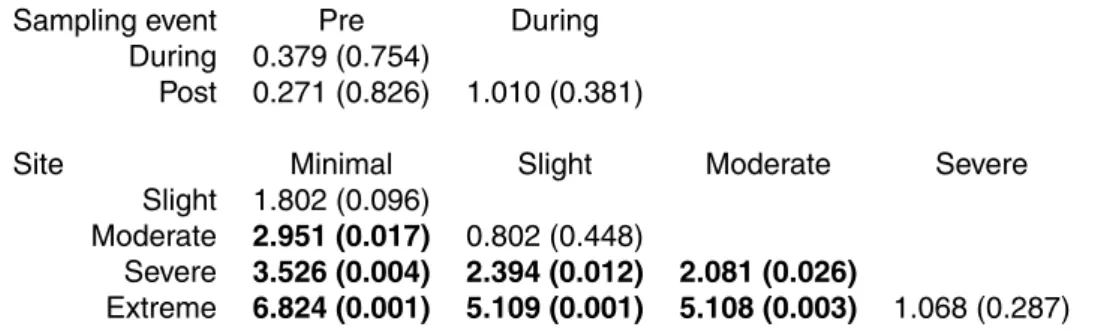
dispersion from a value of 33.79 pre- to 35.65 during-dewatering, this difference was not significant (Table 4). In contrast, the difference between either the pre- or during-dewatering communities and the community that succeeded them post-rewetting was much more apparent as a change in the location of the community centroid, and the dis-persions were again equal in pairwise comparisons (post-rewetting dispersion=32.39; 15
Table 4).
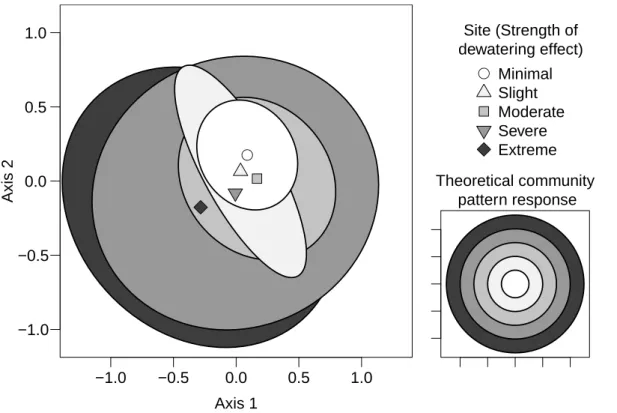
Distinguishable macroinvertebrate community patterns also emerged in ordination space when samples across time (sampling event) were grouped according to sam-ple site (Fig. 3). Samsam-ples at the minimal dewatering effect site were the least variable through time, and variability increased incrementally along the dewatering gradient 20
such that the community at the extreme dewatering effect site had greater dispersion over the course of the study (occupied more ordination space) than any other site grouping (statistically significant for 3 of 4 comparisons; Table 4). There was little dif-ference in the centroids between any of these groups, and likely as a result only half of the pairwise combinations of these groups were significantly different based on per-25
HESSD
7, 9599–9630, 2010Macroinvertebrate responses to a dewatering gradient
J. D. Muehlbauer et al.
Title Page
Abstract Introduction
Conclusions References
Tables Figures
◭ ◮
◭ ◮
Back Close
Full Screen / Esc
Printer-friendly Version Interactive Discussion
Discussion
P
a
per
|
Dis
cussion
P
a
per
|
Discussion
P
a
per
|
Discussio
n
P
a
per
between these groups were significant using PERMDISP, with the non-significant dif-ferences coming from comparisons between adjacent sites (Table 4).
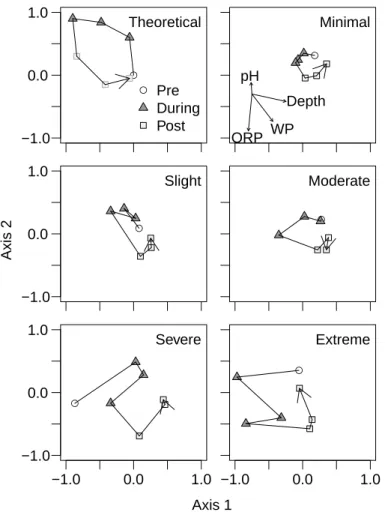
Using succession vectors to track the macroinvertebrate community through time at each dewatering gradient site revealed consistent patterns in the ordination across the 5 sites (Fig. 4). In general, large community changes took place between the pre- and 5
first during-dewatering samples (days 0 and 4, respectively), but only at the sites where wetted perimeter and depth were most affected by the dewatering. Some community change continued to occur at all sites during the course of the dewatering, but then a large change occurred between the last dewatered and first post-rewetting samples at all sites; this was the largest (or equal to the largest) community change observed 10
at 4 out of the 5 sites. Following this shift, the communities at those 4 sites all began a trajectory back to their initial (pre-dewatering) community structure that continued over the course of the rewetting, virtually achieving a return to pre-dewatering commu-nity similarity by the end of the study. The exception was the severely dewatered site, which seemed to change more stochastically through time.
15
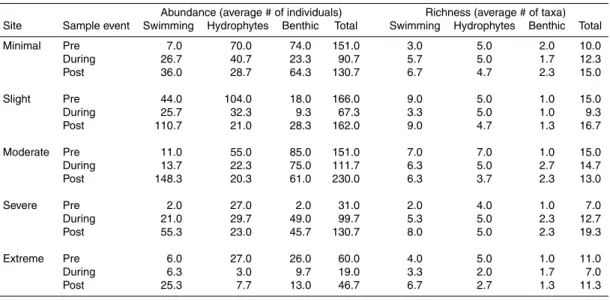
The relative proportions of collected macroinvertebrates native to distinct habitats also changed throughout the course of the study and especially at the extreme ing site, although the patterns were similar across all sites (Fig. 5). Prior to the dewater-ing, the community across all 5 gradient sites was dominated by hydrophyte-associated and benthic macroinvertebrate predators (e.g.,Odonataand manyHemipterataxa; Ta-20
ble 5). Pelagic or near-surface, swimming taxa (e.g. someDipteraandHemiptera, but mostly the Coleopteran families Dytiscidae and Hydrophilidae) also contributed sub-stantially to taxon richness pre-dewatering, but were low in abundance. Finally, benthic taxa pre-dewatering (e.g., Diptera, especially Chironomidae), in contrast, were fairly abundant at most sites, but contributed few taxa to richness counts.
25
HESSD
7, 9599–9630, 2010Macroinvertebrate responses to a dewatering gradient
J. D. Muehlbauer et al.
Title Page
Abstract Introduction
Conclusions References
Tables Figures
◭ ◮
◭ ◮
Back Close
Full Screen / Esc
Printer-friendly Version Interactive Discussion
Discussion
P
a
per
|
Dis
cussion
P
a
per
|
Discussion
P
a
per
|
Discussio
n
P
a
per
|
even post-rewetting, while swimmer abundance and richness increased. In fact, swim-mer abundance post-rewetting increased by roughly an order of magnitude across all sites in comparison to pre-dewatered levels, and became a more obvious component of the post-rewetting community (Fig. 2). Finally, overall macroinvertebrate abundance and richness across all groups at the 5 gradient sites also increased from during- to 5
post-dewatering.
4 Discussion
Macroinvertebrate community responses to the dewatering and subsequent rewetting differed, altering our initial conceptualization of the rewetting as a continuation of a per-sistent drought-type ramp disturbance (Lake, 2000). The pre-dewatering community 10
incorporated aspects of both the during- and post-dewatering communities; however, these latter 2 communities emphasized different components of that initial community structure. The macroinvertebrate community seemed to be more dispersed during de-watered conditions relative to pre-dewatering (although this was not significant), which would be expected following a pulse-type, large disturbance event that substantially 15
disrupts habitat availability on a short time scale (Lake, 2000; Biggs et al., 2005). How-ever, the community did not continue to become even more variable following rewet-ting. We had predicted the rewetting, due to its rapid nature, would serve as another disturbance and therefore might initiate a similar community change to that observed during the dewatering (Kelsch, 1994; Smock et al., 1994), but this did not occur. It 20
is conceivable that this response might be because the community had been so re-tracted compositionally (i.e. to only the most resistant taxa; Miller and Golladay, 1996) during the dewatering that further changes post-rewetting would have been minor rel-ative to the initial, dewatering-induced change. But, in fact, overall taxon abundance and richness actually returned to or even increased above pre-dewatering levels after 25
HESSD
7, 9599–9630, 2010Macroinvertebrate responses to a dewatering gradient
J. D. Muehlbauer et al.
Title Page
Abstract Introduction
Conclusions References
Tables Figures
◭ ◮
◭ ◮
Back Close
Full Screen / Esc
Printer-friendly Version Interactive Discussion
Discussion
P
a
per
|
Dis
cussion
P
a
per
|
Discussion
P
a
per
|
Discussio
n
P
a
per
community composition at most sites. Thus, rewetting seems to have provided a rapid reset mechanism for the aquatic macroinvertebrate community at Timberlake.
Community change along the dewatering gradient was relative to the magnitude of habitat (primarily wetted perimeter) change exerted by the dewatering, which is sup-ported by research in other stream systems (Miller et al., 2007; James and Suren, 5
2009). One hypothesis regarding drought-type disturbances could be that communi-ties respond according to threshold changes: below some threshold of habitat change the community remains relatively unperturbed, but then collapses or shifts to a new stable state (community mean) as the drought persists and removes some key habi-tat component (Chase, 2003; Suding et al., 2004). In streams, these thresholds may 10
be directly related to water level, with stepped faunal changes when water levels drop below both banks, then below the bed surface, etc. (Boulton, 2003); however, this may not be the case when dewatering occurs rapidly. Such a threshold pattern also has not been supported by other stream dewatering studies (Suren et al., 2003; Dewson et al., 2007b; James and Suren, 2009) and does not seem to have been the case at 15
Timberlake either. This assumes that there were no lag effects, whereby other species may have gradually disappeared if the dewatering had persisted more long-term (Boul-ton and Lake, 2008). However, we suspect that the magnitude of dewatering severity and the presence of “indirect effects” (Miller et al., 2007) resulting from very acidic pH values likely would have precluded any such lag response.
20
Rather than affecting the community mean, increasing severity of disturbance led to increasing community variability between samples at a site. When comparing all the sites, the magnitude of community change (as a function of variability) during the dewa-tering and rewetting could be viewed as a series of concentric rings in ordination space (Fig. 3). In this representation, sites that underwent the most dramatic changes in 25
HESSD
7, 9599–9630, 2010Macroinvertebrate responses to a dewatering gradient
J. D. Muehlbauer et al.
Title Page
Abstract Introduction
Conclusions References
Tables Figures
◭ ◮
◭ ◮
Back Close
Full Screen / Esc
Printer-friendly Version Interactive Discussion
Discussion
P
a
per
|
Dis
cussion
P
a
per
|
Discussion
P
a
per
|
Discussio
n
P
a
per
|
of self-similarity to their initial condition (i.e. the community mean changed minimally; Warwick and Clarke, 1993), the sites most affected by dewatered conditions supported communities that emphasized more of the fringe of this community composition.
Wetted perimeter and depth exerted a strong control on the macroinvertebrate com-munities over the course of this study. Of course, wetted perimeter is interrelated to 5
many other hydrological variables (Clausen and Biggs, 2000), but we chose to focus on this one, principal hydrologic driver as is common in such gradient effect research (Lancaster and Belyea, 2006). It is not surprising to find that a hydrologic variable con-trolled community composition over the course of this study given the wealth of previous research to support such a result (Poffand Ward, 1989). However, most other drought-10
type studies have particularly emphasized the importance of micro-scale refugia (e.g. small rock pools), rather than channel reach-scale hydrological variables like wetted perimeter, in maintaining vestiges of community structure during severe drought con-ditions (Dewson et al., 2007a). In fact, recovery from dewatering following rewetting is thought to be quite common in drought-type disturbances, but this is predicated mostly 15
on the presence of hyporheic habitat and large woody debris that remain moist (Boul-ton, 2003; but see James and Suren, 2009). As a former agricultural field that has been restored to wetland/stream-like conditions but nonetheless lacks woody debris and maintains a homogeneous silt-sand bed (i.e. no heterogeneous water pooling and limited hyporheic habitat), refugia of this form were largely unavailable to the aquatic 20
biota at Timberlake. Thus, hydrologic conditions, rather than a heterogeneous geomor-phic mosaic (Pringle et al., 1988), had a large influence on the localized presence of aquatic biotic. We suggest that wetted perimeter may be a good analogue for available habitat under such conditions.
The emphasis on the presence of water in providing habitat – rather than water 25
HESSD
7, 9599–9630, 2010Macroinvertebrate responses to a dewatering gradient
J. D. Muehlbauer et al.
Title Page
Abstract Introduction
Conclusions References
Tables Figures
◭ ◮
◭ ◮
Back Close
Full Screen / Esc
Printer-friendly Version Interactive Discussion
Discussion
P
a
per
|
Dis
cussion
P
a
per
|
Discussion
P
a
per
|
Discussio
n
P
a
per
hydrophyte-associated macroinvertebrates lost their optimal habitat and many appar-ently died, as indicated by declines in their abundance and richness that continued even post-rewetting (Fig. 5). This response is similar to that shown in English chalk streams, where maintaining submerged macrophytes is critical to minimizing the eco-logical effects of droughts (Wright and Berrie, 1987; Wright and Symes, 1999). In con-5
trast to the hydrophyte-associated taxa, however, the most mobile, swimming taxa at Timberlake actually responded positively to the dewatering. Available habitat for these taxa (i.e. the pelagic zone) was decreased by the experimental dewatering, but this stress was not lethal to the entire population. Thus, when wetted conditions returned, swimmers were able to rapidly re-colonize (perhaps from the unaffected areas of Tim-10
berlake, such as those areas near or above the geomorphic invert) and to dominate post-rewetting. Such rapid re-colonization is possible when a nearby source population is present (Williams and Hynes, 1977; Malmqvist et al., 1991; Fowler, 2004), although in the case of severe droughts that persist for long periods of time (e.g. currently in Australia), this may be unlikely (Boulton, 2003; Boulton and Lake, 2008). Finally, be-15
cause benthic macroinvertebrate (prey) abundances did not continue to decrease from during- to post-dewatering, hydrologic (dewatering/rewetting) control seems to have had an overriding influence on the abundance of these benthic prey as well.
5 Conclusions
Stream restoration sites, as locations of intentional manipulations to an ecosystem, can 20
represent opportunities for research in basic ecological principles (Lake et al., 2007). In this study, the predictable nature of an experimental dewatering post-restoration al-lowed rigorous, structured sampling to occur pre-, during-, and post-dewatering, which is difficult in systems not controlled by an electric pump and flap gates. This dewater-ing itself was clearly experimental and occurred over a fairly short timescale. However, 25
HESSD
7, 9599–9630, 2010Macroinvertebrate responses to a dewatering gradient
J. D. Muehlbauer et al.
Title Page
Abstract Introduction
Conclusions References
Tables Figures
◭ ◮
◭ ◮
Back Close
Full Screen / Esc
Printer-friendly Version Interactive Discussion
Discussion
P
a
per
|
Dis
cussion
P
a
per
|
Discussion
P
a
per
|
Discussio
n
P
a
per
|
can occur regionally in late summer-early fall, so this experimental manipulation was not without natural climatic precedent (Smock et al., 1994). Hurricane Hanna, which passed over the site 3 days post-rewetting, was a serendipitous reminder of this fact. In addition, the main drivers of community change induced by the dewatering- decrease in wetted perimeter and loss of bankside hydrophytes- are path-independent endpoints 5
of any severe dewatering (including droughts, agricultural withdrawals, etc.), regardless of whether the disturbance itself is pulsed or ramps up in intensity. Thus, we believe it may be possible to extrapolate the conclusions of this study to natural droughts occur-ring at least on seasonal timescales.
We particularly note that hydrologic conditions (e.g. wetted perimeter) should not be 10
de-emphasized in favor of discussing species migration to micro-scale areas of geo-morphic refugia. In fact, wetted perimeter in the absence of geogeo-morphic heterogeneity was a fairly good analog for available habitat in this study. Thus, we suggest a dual-istic approach in future dewatering studies that incorporates both the hydrologic and geomorphic aspects of habitat alteration may be most beneficial. Also, rewetting (even 15
rapid rewetting) at Timberlake seemed to represent an end to the dewatering distur-bance, rather than a continuation of it. Nonetheless, community recovery to a fully pre-disturbed condition may take longer than initial response to dewatering, as the bal-ance between displaced taxa and open-niche opportunists is slowly restored. Finally, we note that dewaterings may not always represent a threshold-type disturbance for 20
biota; rather, biotic response in our study varied incrementally with dewatering severity. This was predominantly in the form of increases in community variability (dispersion), rather than a shift in the community mean. Thus, we suggest that explicit characteri-zation of dispersion may be important in understanding the impacts of disturbance on ecological communities.
25
HESSD
7, 9599–9630, 2010Macroinvertebrate responses to a dewatering gradient
J. D. Muehlbauer et al.
Title Page
Abstract Introduction
Conclusions References
Tables Figures
◭ ◮
◭ ◮
Back Close
Full Screen / Esc
Printer-friendly Version Interactive Discussion
Discussion
P
a
per
|
Dis
cussion
P
a
per
|
Discussion
P
a
per
|
Discussio
n
P
a
per
References
Anderson, M.: A new method for non-parametric multivariate analysis of variance, Austral. Ecol., 26, 32–46, doi:10.1111/j.1442-9993.2001.tb00081.x, 2001. 9607
Anderson, M.: Distance-based tests for homogeneity of multivariate dispersions, Biometrics, 62, 245–253, doi:10.1111/j.1541-0420.2005.00440.x, 2006. 9607
5
Anderson, M. J.: PERMDISP: a FORTRAN computer program for permutational analysis of multivariate dispersions (for any two-factor ANOVA design) using permutation tests, available at: http://www.stat.auckland.ac.nz/∼mja/Programs.htm#Mine, last access: 12 April 2010, De-partment of Statistics, University of Auckland, Auckland, 2004. 9607
Ard ´on, M., Morse, J. L., Doyle, M. W., and Bernhardt, E. S.: The water quality consequences 10
of restoring wetland hydrology to a large agricultural watershed in the southeastern coastal plain, Ecosystems, 13, 1060–1078, doi:10.1007/s10021-010-9374-x, 2010. 9604
Bernhardt, E. S., Palmer, M. A., Allan, J. D., Alexander, G., Barnas, K., Brooks, S., Carr, J., Clay-ton, S., Dahm, C., Follstad-Shah, J., Galat, D., Gloss, S., Goodwin, P., Hart, D., Hassett, B., Jenkinson, R., Katz, S., Kondolf, G. M., Lake, P. S., Lave, R., Meyer, J. L., O’Donnell, T. K., 15
Pagano, L., Powell, B., and Sudduth, E.: Synthesizing US river restoration efforts, Science, 308, 636–637, doi:10.1126/science.1109769, 2005. 9602
Biggs, B. J. F., Nikora, V. I., and Snelder, T. H.: Linking scales of flow variability to lotic ecosys-tem structure and function, River Res. Appl., 21, 283–298, doi:10.1002/rra.847, 2005. 9611 Bond, N. R., Lake, P. S., and Arthington, A. H.: The impacts of drought on freshwater ecosys-20
tems: an Australian perspective, Hydrobiologia, 600, 3–16, doi:10.1007/s10750-008-9326-z, 2008. 9602
Boulton, A. J.: Parallels and contrasts in the effects of drought on stream macroinvertebrate as-semblages, Freshwater Biol., 48, 1173–1185, doi:10.1046/j.1365-2427.2003.01084.x, 2003. 9602, 9612, 9613, 9614
25
Boulton, A. J. and Lake, P. S.: Effects of drought on stream insects and its ecological conse-quences, in: Aquatic Insects: Challenges to Populations: Proceedings of the Royal Entomo-logical Society’s 24th Symposium, edited by: Lancaster, J. and Briers, R. A., CAB Interna-tional, Oxfordshire, 81–102, 2008. 9612, 9614
Bray, J. R. and Curtis, J. T.: An ordination of the upland forest communities of Southern Wis-30
consin, Ecol. Monogr., 27, 325–349, 1957. 9606
HESSD
7, 9599–9630, 2010Macroinvertebrate responses to a dewatering gradient
J. D. Muehlbauer et al.
Title Page
Abstract Introduction
Conclusions References
Tables Figures
◭ ◮
◭ ◮
Back Close
Full Screen / Esc
Printer-friendly Version Interactive Discussion
Discussion
P
a
per
|
Dis
cussion
P
a
per
|
Discussion
P
a
per
|
Discussio
n
P
a
per
|
flow regimes for aquatic biodiversity, Environ. Manage., 30, 492–507, doi:10.1007/s00267-002-2737-0, 2002. 9602
Chase, J. M.: Community assembly: when should history matter?, Oecologia, 136, 489–498, doi:10.1007/s00442-003-1311-7, 2003. 9612
Clausen, B. and Biggs, B. J. F.: Flow variables for ecological studies in temperate 5
streams: groupings based on covariance, J. Hydrol., 237, 184–197, doi:10.1016/s0022-1694(00)00306-1, 2000. 9601, 9613
Clements, F. E.: Nature and structure of the climax, J. Ecol., 24, 252–284, 1936. 9600
Collins, S. L.: Disturbance frequency and community stability in native tallgrass prairie, Am. Nat., 155, 311–325, 2000. 9601
10
Connell, J. H.: Diversity in tropical rain forests and coral reefs, Science, 199, 1302–1310, 1978. 9600
Dewson, Z. S., James, A. B. W., and Death, R. G.: A review of the consequences of decreased flow for instream habitat and macroinvertebrates, J. N. Am. Benthol. Soc., 26, 401–415, doi:10.1899/06-110.1, 2007a. 9602, 9613
15
Dewson, Z. S., James, A. B. W., and Death, R. G.: Invertebrate responses to short-term water abstraction in small New Zealand streams, Freshwater Biol., 52, 357–369, doi:10.1111/j.1365-2427.2006.01682.x, 2007b. 9602, 9612
Fowler, R. T.: The recovery of benthic invertebrate communities following dewatering in two braided rivers, Hydrobiologia, 523, 17–28, doi:10.1023/B:HYDR.0000033077.13139.7f, 20
2004. 9614
Gislason, J. C.: Aquatic insect abundance in a regulated stream under fluctuating and stable diel flow patterns, N. Am. J. Fish. Manage., 5, 39–46, doi:10.1577/1548-8659(1985)5<39:AIAIAR>2.0.CO;2, 1985. 9601
Hart, D. D. and Finelli, C. M.: Physical-biological coupling in streams: the perva-25
sive effects of flow on benthic organisms, Annu. Rev. Ecol. Syst., 30, 363–395, doi:10.1146/annurev.ecolsys.30.1.363, 1999. 9601
Houseman, G. R., Mittelbach, G. G., Reynolds, H. L., and Gross, K. L.: Perturbations alter community convergence, divergence, and formation of multiple community states, Ecology, 89, 2172–2180, doi:10.1890/07-1228.1, 2008. 9601, 9612
30
HESSD
7, 9599–9630, 2010Macroinvertebrate responses to a dewatering gradient
J. D. Muehlbauer et al.
Title Page
Abstract Introduction
Conclusions References
Tables Figures
◭ ◮
◭ ◮
Back Close
Full Screen / Esc
Printer-friendly Version Interactive Discussion
Discussion
P
a
per
|
Dis
cussion
P
a
per
|
Discussion
P
a
per
|
Discussio
n
P
a
per
James, A. B. W., Dewson, Z. S., and Death, R. G.: Do stream macroinvertebrates use in-stream refugia in response to severe short-term flow reduction in New Zealand in-streams?, Freshwater Biol., 53, 1316–1334, doi:10.1111/j.1365-2427.2008.01969.x, 2008. 9602 Kelsch, S. W.: Lotic fish-community structure following transition from severe drought to high
discharge, J. Freshwater Ecol., 9, 331–342, 1994. 9611 5
Konrad, C. P., Brasher, A. M. D., and May, J. T.: Assessing streamflow characteristics as limiting factors on benthic invertebrate assemblages in streams across the Western United States, Freshwater Biol., 53, 1983–1998, doi:10.1111/j.1365-2427.2008.02024.x, 2008. 9601 Kruskal, J. B.: Multidimensional scaling by optimizing goodness of fit to a nonmetric hypothesis,
Psychometrika, 29, 1–27, 1964. 9606 10
Lake, P. S.: Disturbance, patchiness, and diversity in streams, J. N. Am. Benthol. Soc., 19, 573–592, 2000. 9601, 9611
Lake, P. S.: Ecological effects of perturbation by drought in flowing waters, Freshwater Biol., 48, 1161–1172, doi:10.1046/j.1365-2427.2003.01086.x, 2003. 9602
Lake, P. S., Bond, N., and Reich, P.: Linking ecological theory with stream restoration, Fresh-15
water Biol., 52, 597–615, doi:10.1111/j.1365-2427.2006.01709.x, 2007. 9603, 9614
Lancaster, J. and Belyea, L. R.: Defining the limits to local density: alternative views of abundance-environment relationships, Freshwater Biol., 51, 783–796, doi:10.1111/j.1365-2427.2006.01518.x, 2006. 9613
Lepori, F. and Malmqvist, B.: Deterministic control on community assembly peaks at inter-20
mediate levels of disturbance, Oikos, 118, 471–479, doi:10.1111/j.1600-0706.2008.16989.x, 2009. 9601
Limpert, E., Stahel, W. A., and Abbt, M.: Log-normal distributions across the sciences: keys and clues, Bioscience, 51, 341–352, doi:10.1641/0006-3568(2001)051[0341:LNDATS]2.0.CO;2, 2001. 9607
25
Malmqvist, B., Rundle, S., Br ¨onmark, C., and Erlandsson, A.: Invertebrate colonization of a new, man-made stream in Southern Sweden, Freshwater Biol., 26, 307–324, doi:10.1111/j.1365-2427.1991.tb01737.x, 1991. 9614
McCune, B. and Grace, J. B.: Analysis of Ecological Communities, MjM Software Design, Gleneden Beach, 2002. 9606, 9607
30
Merritt, R., Cummins, K., and Berg, M.: An Introduction to the Aquatic Insects of North America, 4th edition, Kendall Hunt, Dubuque, 2008. 9606
HESSD
7, 9599–9630, 2010Macroinvertebrate responses to a dewatering gradient
J. D. Muehlbauer et al.
Title Page
Abstract Introduction
Conclusions References
Tables Figures
◭ ◮
◭ ◮
Back Close
Full Screen / Esc
Printer-friendly Version Interactive Discussion
Discussion
P
a
per
|
Dis
cussion
P
a
per
|
Discussion
P
a
per
|
Discussio
n
P
a
per
|
assemblages of an intermittent and a perennial prairie stream, J. N. Am. Benthol. Soc., 15, 670–689, 1996. 9611
Miller, S. W., Wooster, D., and Li, J.: Resistance and resilience of macroinvertebrates to irrigation water withdrawals, Freshwater Biol., 52, 2494–2510, doi:10.1111/j.1365-2427.2007.01850.x, 2007. 9602, 9612
5
North Carolina Division of Water Quality Biological Assessment Unit: Standard operating pro-cedures for benthic macroinvertebrates, Report, Raleigh, 2006. 9606
Oksanen, J., Kindt, R., Legendre, P., O’Hara, B., Simpson, G. L., Solymos, P., Stevens, M. H. H., and Wagner, H.: Vegan: Community Ecology Package, version 1.15, available at: http:// CRAN.R-project.org/package=vegan last access: 28 May 2009, R Foundation for Statistical 10
Computing, Vienna, 2009. 9606, 9607
Palmer, M., Allan, J. D., Meyer, J., and Bernhardt, E. S.: River restoration in the twenty-first century: data and experiential knowledge to inform future efforts, Restor. Ecol., 15, 472– 481, doi:10.1111/j.1526-100X.2007.00243.x, 2007. 9602
Palmer, M. A. and Bernhardt, E. S.: Hydroecology and river restoration: ripe for research and 15
synthesis, Water Resour. Res., 42, W03S07, doi:10.1029/2005wr004354, 2006. 9603 Palmer, M. A., Bernhardt, E. S., Allan, J. D., Lake, P. S., Alexander, G., Brooks, S., Carr, J.,
Clayton, S., Dahm, C. N., Follstad Shah, J., Galat, D. L., Loss, S. G., Goodwin, P., Hart, D. D., Hassett, B., Jenkinson, R., Kondolf, G. M., Lave, R., Meyer, J. L., O’Donnell, T. K., Pagano, L., and Sudduth, E.: Standards for ecologically successful river restoration, J. Appl. Ecol., 42, 20
208–217, doi:10.1111/j.1365-2664.2005.01004.x, 2005. 9603
Palmer, M. A., Menninger, H. L., and Bernhardt, E.: River restoration, habitat heterogene-ity and biodiversheterogene-ity: a failure of theory or practice?, Freshwater Biol., 55, 205–222, doi:10.1111/j.1365-2427.2009.02372.x, 2010. 9602
Poff, N. L. and Ward, J. V.: Implications of streamflow variability and predictability for lotic 25
community structure: a regional analysis of streamflow patterns, Can. J. Fish. Aquat. Sci., 46, 1805–1818, 1989. 9601, 9613
Poff, N. L., Allan, J. D., Bain, M. B., Karr, J. R., Prestegaard, K. L., Richter, B. D., Sparks, R. E., and Stromberg, J. C.: The natural flow regime, Bioscience, 47, 769–784, 1997. 9602 Pringle, C. M., Naiman, R. J., Bretschko, G., Karr, J. R., Oswood, M. W., Webster, J. R., Wel-30
comme, R. L., and Winterbourn, M. J.: Patch dynamics in lotic systems: the stream as a mosaic, J. N. Am. Benthol. Soc., 7, 503–524, 1988. 9613
HESSD
7, 9599–9630, 2010Macroinvertebrate responses to a dewatering gradient
J. D. Muehlbauer et al.
Title Page
Abstract Introduction
Conclusions References
Tables Figures
◭ ◮
◭ ◮
Back Close
Full Screen / Esc
Printer-friendly Version Interactive Discussion
Discussion
P
a
per
|
Dis
cussion
P
a
per
|
Discussion
P
a
per
|
Discussio
n
P
a
per
http://www.R-project.org last access: 28 May 2009, R Foundation for Statistical Computing, Vienna, 2009. 9606, 9607
Rader, R. B. and Belish, T. A.: Influence of mild to severe flow alterations on inverte-brates in three mountain streams, Regul. River., 15, 353–363, doi:10.1002/(SICI)1099-1646(199907/08)15:4<353::AID-RRR551>3.0.CO;2-U, 1999. 9601
5
Resh, V. H., Brown, A. V., Covich, A. P., Gurtz, M. E., Li, H. W., Minshall, G. W., Reice, S. R., Sheldon, A. L., Wallace, J. B., and Wissmar, R. C.: The role of disturbance in stream ecology, J. N. Am. Benthol. Soc., 7, 433–455, 1988. 9601
Robinson, C. T. and Uehlinger, U.: Experimental floods cause ecosystem regime shift in a reg-ulated river, Ecol. Appl., 18, 511–526, doi:10.1890/07-0886.1, 2008. 9601
10
Shepard, R. N.: The analysis of proximities: multidimensional scaling with an unknown distance function, II, Psychometrika, 27, 219–246, 1962. 9606
Smock, L. A., Smith, L. C., Jones, J. B., and Hooper, S. M.: Effects of drought and a hurricane on a coastal headwater stream, Arch. Hydrobiol., 131, 25–38, 1994. 9611, 9615
Suding, K. N., Gross, K. L., and Houseman, G. R.: Alternative states and positive feedbacks 15
in restoration ecology, Trends Ecol. Evol., 19, 46–53, doi:10.1016/j.tree.2003.10.005, 2004. 9601, 9612
Suren, A. M. and Jowett, I. G.: Effects of floods versus low flows on invertebrates in a New Zealand gravel-bed river, Freshwater Biol., 51, 2207–2227, doi:10.1111/j.1365-2427.2006.01646.x, 2006. 9602
20
Suren, A. M., Biggs, B. J. F., Duncan, M. J., Bergey, L., and Lambert, P.: Benthic community dynamics during summer low-flows in two rivers of contrasting enrichment 2. Invertebrates, New Zeal. J. Mar. Fresh., 37, 71–83, doi:10.1080/00288330.2003.9517147, 2003. 9612 Warwick, R. M. and Clarke, K. R.: Increased variability as a symptom of stress in marine
communities, J. Exp. Mar. Biol. Ecol., 172, 215–226, 1993. 9601, 9613 25
Williams, D. D. and Hynes, H. B. N.: Benthic community development in a new stream, Can. J. Zoolog., 55, 1071–1076, 1977. 9614
Wright, J. F. and Berrie, A. D.: Ecological effects of groundwater pumping and a nat-ural drought on the upper reaches of a chalk stream, Regul. River., 1, 145–160, doi:10.1002/rrr.3450010205, 1987. 9614
30
HESSD
7, 9599–9630, 2010Macroinvertebrate responses to a dewatering gradient
J. D. Muehlbauer et al.
Title Page
Abstract Introduction
Conclusions References
Tables Figures
◭ ◮
◭ ◮
Back Close
Full Screen / Esc
Printer-friendly Version Interactive Discussion
Discussion
P
a
per
|
Dis
cussion
P
a
per
|
Discussion
P
a
per
|
Discussio
n
P
a
per
|
Table 1.Water quality measurements pre-, during-, and post-dewatering.
Sample event Pre During 1 During 2 During 3 Post 1 Post 2 Post 3
Time (# days) Day 0 Day 4 Day 7 Day 14 Day 20 Day 26 Day 32
Site Sample time 16:00 11:30 12:00 11:00 11:00 10:00 12:00
Very small 30.75 25.78 26.18 22.98 23.69 25.80 21.52
Minimal 24.96 23.35 23.31 22.47 24.63 25.63 21.53
Temperature Slight 31.11 23.97 25.02 22.22 25.72 27.03 20.78
(◦
C) Moderate 30.50 24.23 23.15 24.17 26.38 27.05 21.02
Severe 30.23 25.11 24.75 24.73 24.96 28.63 21.70
Extreme 30.37 32.28 32.50 29.15 25.80 26.37 22.69
Very small 0.51 0.53 0.52 0.57 0.54 1.36 1.75
Minimal 9.08 6.98 6.77 3.44 8.13 7.58 7.34
Specific conductivity Slight 9.48 7.40 6.69 4.65 8.26 8.18 5.22
(SpC), (mS/cm) Moderate 10.30 6.20 5.57 4.06 8.30 8.96 5.29
Severe 9.86 6.05 5.57 3.87 8.40 8.61 5.67
Extreme 10.65 6.67 6.01 4.05 10.38 10.40 6.64
Very small 5.22 4.79 4.71 4.50 4.43 3.99 3.85
Minimal 5.26 5.42 5.13 4.45 4.36 5.91 5.99
pH Slight 5.61 5.22 4.23 4.66 4.41 3.95 3.80
Moderate 5.29 5.07 4.55 5.12 4.47 5.63 3.69
Severe 6.89 4.16 4.17 3.93 4.62 4.34 3.80
Extreme 6.03 4.04 3.81 3.83 5.48 5.12 3.93
Very small 222 329 297 409 414 445 473
Minimal −6 −174 −65 125 430 −48 −163
Redox potential Slight −170 −93 225 17 396 426 368
(ORP), (mV) Moderate 175 −97 25 −9 364 114 394
Severe 148 209 172 284 307 371 379
HESSD
7, 9599–9630, 2010Macroinvertebrate responses to a dewatering gradient
J. D. Muehlbauer et al.
Title Page
Abstract Introduction
Conclusions References
Tables Figures
◭ ◮
◭ ◮
Back Close
Full Screen / Esc
Printer-friendly Version Interactive Discussion
Discussion
P
a
per
|
Dis
cussion
P
a
per
|
Discussion
P
a
per
|
Discussio
n
P
a
per
Table 2. Vector lengths of environmental and habitat variables to the ordination axes and variable correlation to the ordination. Statistically-significant correlations are in bold.
Axis 1 Axis 2 r2 p Temperature −0.892 −0.451 0.120 0.080 Specific conductivity (SpC) 0.562 −0.374 0.179 0.093
pH −0.025 0.365 0.250 0.028
Redox potential (ORP) −0.076 −0.849 0.476 0.001
Wetted perimeter (WP) 0.547 −0.770 0.319 0.005
HESSD
7, 9599–9630, 2010Macroinvertebrate responses to a dewatering gradient
J. D. Muehlbauer et al.
Title Page
Abstract Introduction
Conclusions References
Tables Figures
◭ ◮
◭ ◮
Back Close
Full Screen / Esc
Printer-friendly Version Interactive Discussion
Discussion
P
a
per
|
Dis
cussion
P
a
per
|
Discussion
P
a
per
|
Discussio
n
P
a
per
|
Table 3. Results of permutational MANOVA tests for comparisons of macroinvertebrate com-munities grouped by event (pre-, during-, post-dewatering) and site (strength of dewatering impact). Statistically-significant community differences are in bold.
Comparison F p
Event Pre-during 1.606 0.029
Pre-post 1.554 0.001
During-post 1.938 0.001
Overall 3.263 0.001
Site Minimal-slight 1.307 0.087 Minimal-moderate 1.384 0.058 Minimal-severe 1.352 0.097 Minimal-extreme 3.181 0.001 Slight-moderate 1.450 0.023 Slight-severe 1.581 0.031 Slight-extreme 2.056 0.001 Moderate-severe 1.019 0.195 Moderate-extreme 2.280 0.001 Severe-extreme 1.818 0.065
HESSD
7, 9599–9630, 2010Macroinvertebrate responses to a dewatering gradient
J. D. Muehlbauer et al.
Title Page
Abstract Introduction
Conclusions References
Tables Figures
◭ ◮
◭ ◮
Back Close
Full Screen / Esc
Printer-friendly Version Interactive Discussion
Discussion
P
a
per
|
Dis
cussion
P
a
per
|
Discussion
P
a
per
|
Discussio
n
P
a
per
Table 4. Results of PERMDISP tests for comparisons of macroinvertebrate communities grouped by event (pre-, during-, post-dewatering) and site (strength of dewatering impact). PERMDISP t-values are shown, with corresponding p-values in parentheses Statistically-significant community dispersion differences are in bold.
Sampling event Pre During
During 0.379 (0.754)
Post 0.271 (0.826) 1.010 (0.381)
Site Minimal Slight Moderate Severe
Slight 1.802 (0.096)
Moderate 2.951 (0.017) 0.802 (0.448)
Severe 3.526 (0.004) 2.394 (0.012) 2.081 (0.026)
HESSD
7, 9599–9630, 2010Macroinvertebrate responses to a dewatering gradient
J. D. Muehlbauer et al.
Title Page
Abstract Introduction
Conclusions References
Tables Figures
◭ ◮
◭ ◮
Back Close
Full Screen / Esc
Printer-friendly Version Interactive Discussion
Discussion
P
a
per
|
Dis
cussion
P
a
per
|
Discussion
P
a
per
|
Discussio
n
P
a
per
|
Table 5.Macroinvertebrate abundance and richness at the 5 dewatered sites, grouped by habit pre-, during-, and post-dewatering.
Abundance (average # of individuals) Richness (average # of taxa) Site Sample event Swimming Hydrophytes Benthic Total Swimming Hydrophytes Benthic Total
Minimal Pre 7.0 70.0 74.0 151.0 3.0 5.0 2.0 10.0
During 26.7 40.7 23.3 90.7 5.7 5.0 1.7 12.3
Post 36.0 28.7 64.3 130.7 6.7 4.7 2.3 15.0
Slight Pre 44.0 104.0 18.0 166.0 9.0 5.0 1.0 15.0
During 25.7 32.3 9.3 67.3 3.3 5.0 1.0 9.3
Post 110.7 21.0 28.3 162.0 9.0 4.7 1.3 16.7
Moderate Pre 11.0 55.0 85.0 151.0 7.0 7.0 1.0 15.0
During 13.7 22.3 75.0 111.7 6.3 5.0 2.7 14.7
Post 148.3 20.3 61.0 230.0 6.3 3.7 2.3 13.0
Severe Pre 2.0 27.0 2.0 31.0 2.0 4.0 1.0 7.0
During 21.0 29.7 49.0 99.7 5.3 5.0 2.3 12.7
Post 55.3 23.0 45.7 130.7 8.0 5.0 2.3 19.3
Extreme Pre 6.0 27.0 26.0 60.0 4.0 5.0 1.0 11.0
During 6.3 3.0 9.7 19.0 3.3 2.0 1.7 7.0
HESSD
7, 9599–9630, 2010Macroinvertebrate responses to a dewatering gradient
J. D. Muehlbauer et al.
Title Page
Abstract Introduction
Conclusions References
Tables Figures
◭ ◮
◭ ◮
Back Close
Full Screen / Esc
Printer-friendly Version Interactive Discussion
Discussion
P
a
per
|
Dis
cussion
P
a
per
|
Discussion
P
a
per
|
Discussio
n
P
a
per
|
−1.0 −0.5 0.0 0.5 1.0 −1.0
−0.5 0.0 0.5 1.0
Axis 1
Axis 2
●
● ●
●
●
●
B H
S
● Pre
During Post
pH
ORP WP
Depth
HESSD
7, 9599–9630, 2010Macroinvertebrate responses to a dewatering gradient
J. D. Muehlbauer et al.
Title Page
Abstract Introduction
Conclusions References
Tables Figures
◭ ◮
◭ ◮
Back Close
Full Screen / Esc
Printer-friendly Version Interactive Discussion
Discussion
P
a
per
|
Dis
cussion
P
a
per
|
Discussion
P
a
per
|
Discussio
n
P
a
per
−1.0 −0.5 0.0 0.5 1.0
−1.0 −0.5 0.0 0.5 1.0
Axis 1
Axis 2
●
●
Site (Strength of dewatering effect)
Minimal Slight Moderate Severe Extreme
Theoretical community pattern response
HESSD
7, 9599–9630, 2010Macroinvertebrate responses to a dewatering gradient
J. D. Muehlbauer et al.
Title Page
Abstract Introduction
Conclusions References
Tables Figures
◭ ◮
◭ ◮
Back Close
Full Screen / Esc
Printer-friendly Version Interactive Discussion
Discussion
P
a
per
|
Dis
cussion
P
a
per
|
Discussion
P
a
per
|
Discussio
n
P
a
per
|
−1.0 0.0 1.0
●
Theoretical
● Pre
During Post
●
Minimal
pH
ORP WP Depth
−1.0 0.0 1.0
●
Slight
Axis 2
Axis 1
●
Moderate
−1.0 0.0 1.0 −1.0
0.0 1.0
●
Severe
−1.0 0.0 1.0
●
Extreme
HESSD
7, 9599–9630, 2010Macroinvertebrate responses to a dewatering gradient
J. D. Muehlbauer et al.
Title Page
Abstract Introduction
Conclusions References
Tables Figures
◭ ◮
◭ ◮
Back Close
Full Screen / Esc
Printer-friendly Version Interactive Discussion
Discussion
P
a
per
|
Dis
cussion
P
a
per
|
Discussion
P
a
per
|
Discussio
n
P
a
per
0 3 6 9 12
Richness (# of taxa)
Hydrophyte−associated Swimming
Benthic
Pre During Post
0 15 30 45 60
Ab
undance (# of individuals)