BGD
8, 11285–11309, 2011
Thresholds for Arctic plankton metabolism
J. M. Holding et al.
Title Page
Abstract Introduction
Conclusions References
Tables Figures
◭ ◮
◭ ◮
Back Close
Full Screen / Esc
Printer-friendly Version Interactive Discussion
Discussion
P
a
per
|
Dis
cussion
P
a
per
|
Discussion
P
a
per
|
Discussio
n
P
a
per
|
Biogeosciences Discuss., 8, 11285–11309, 2011 www.biogeosciences-discuss.net/8/11285/2011/ doi:10.5194/bgd-8-11285-2011
© Author(s) 2011. CC Attribution 3.0 License.
Biogeosciences Discussions
This discussion paper is/has been under review for the journal Biogeosciences (BG). Please refer to the corresponding final paper in BG if available.
Temperature thresholds for Arctic
plankton community metabolism: an
experimental assessment
J. M. Holding1, C. M. Duarte1,2, J. M. Arrieta1, A. Coello1, P. Wassmann3, and S. Agust´ı1,2
1
Department of Global Change Research, IMEDEA (CSIC-UIB) Instituto Mediterr ´aneo de Estudios Avanzados, Esporles, Mallorca, Spain
2
The UWA Oceans Institute, The University of Western Australia, Crawley, WA, Australia
3
Department of Arctic and Marine Biology, Faculty of Bioscience, Fishery and Economy, University of Tromsø, Tromsø, Norway
Received: 3 November 2011 – Accepted: 7 November 2011 – Published: 23 November 2011
Correspondence to: J. M. Holding ([email protected])
BGD
8, 11285–11309, 2011
Thresholds for Arctic plankton metabolism
J. M. Holding et al.
Title Page
Abstract Introduction
Conclusions References
Tables Figures
◭ ◮
◭ ◮
Back Close
Full Screen / Esc
Printer-friendly Version Interactive Discussion
Discussion
P
a
per
|
Dis
cussion
P
a
per
|
Discussion
P
a
per
|
Discussio
n
P
a
per
|
Abstract
Climate warming is especially severe in the Arctic, where the average temperature is increasing 0.4◦C per decade, two to three times higher than the global average rate. Furthermore, the Arctic has lost more than half its summer ice extent since 1980 and predictions suggest that the Arctic will be ice free in the summer as early as 2050, which
5
could increase rate of warming. Predictions based on the metabolic theory of ecology assume that temperature increase will enhance metabolic rates and thus both the rate of primary production and respiration will increase. However, these predictions do not consider the specific metabolic balance of the communities. We tested experimentally the response of Arctic plankton communities to seawater temperature spanning from
10
1◦C to 10◦C. Two types of communities were tested, open-ocean Arctic communities
from water collected in the Barents Sea and Atlantic influenced fjord communities from water collected in the Svalbard fjord system. Metabolic rates did indeed increase as suggested by metabolic theory, however these results suggest a temperature threshold of 5◦C, beyond which the metabolism of plankton communities shifts from autotrophic
15
to heterotrophic. Barents Sea communities showed a much clearer threshold response to temperature manipulations than fjord communities.
1 Introduction
The Barents sea region of the Arctic Ocean is highly influenced by the North Atlantic Current which brings warm waters into the Arctic causing it to be a relatively ice free
20
area and contributing significantly to summer ice melt (Loeng et al., 1997; Schauer et al., 2002). These physical properties are responsible for the high CO2uptake in the mostly ice-free Barents Sea, which is estimated to be 9×10¹²g C yr−1(Fransson et al.,
2001), compared to the entire ice-covered Arctic interior (31×1012g C yr−1; Katlin and
Anderson 2005). This relatively high CO2sinking capability is owed in part to the high
25
BGD
8, 11285–11309, 2011
Thresholds for Arctic plankton metabolism
J. M. Holding et al.
Title Page
Abstract Introduction
Conclusions References
Tables Figures
◭ ◮
◭ ◮
Back Close
Full Screen / Esc
Printer-friendly Version Interactive Discussion
Discussion
P
a
per
|
Dis
cussion
P
a
per
|
Discussion
P
a
per
|
Discussio
n
P
a
per
|
including the Barents Sea, is responsible for about 50 % of the primary production in the entire Arctic Ocean (Sakshaug, 2004; Ellingsen et al., 2008; Pabi et al., 2008) which has been estimated to have primary production rates between<30–>100 g C m−2yr−1 depending on the mixing properties and ice cover of the region (Wassmann et al., 2010). High primary production supports productive fisheries (Pauly and Christensen,
5
1995) and contributes to the high atmospheric CO2uptake in the North Atlantic (Taka-hashi et al., 2002).
Yet, the Arctic region is experiencing rapid climate change, warming three times faster than the global mean (ACIA, 2004; Trenberth et al., 2007). Such a steep rate of warming has resulted in severe reduction in ice cover, exceeding the range of natural
10
variability over the past millennia and creating potentially dangerous positive feedbacks (Walsh, 2008; Duarte et al., 2011). Rapid warming is expected to continue in the future, with up to 6◦C warming throughout the 21st century (ACIA, 2004), and revised fore-casts suggest that the Arctic will be ice free in the summer before 2050 (Holland et al., 2006; Bo ´e et al., 2009; Wang and Overland, 2009; Wadhams, 2011) The ice cover over
15
the Arctic Ocean reached a historical minimum in September 2007 with a reduction of 43 % relative to the ice cover in 1979 (Kerr, 2007). In 2011 ice cover again approached this historical minimum (National Snow and Ice Data Center, nsidc.org). Sea ice is not only changing in extent, but is also decreasing in thickness (Johannessen et al., 1999; Kwok and Rothrock, 2009; Wadhams, 2012) and increasing in duration of the ice melt
20
season (Belchansky et al., 2004). These factors are expected to affect the primary productivity in the region by changing light regimes or affecting the timing of the spring bloom (Wassmann et al., 2006, 2008, 2010; Ellingsen et al., 2008). Indeed, previous studies have reported an increase in primary productivity for the Arctic as a whole for these reasons (Arrigo et al., 2008; Pabi et al., 2008), however closer inspection
actu-25
BGD
8, 11285–11309, 2011
Thresholds for Arctic plankton metabolism
J. M. Holding et al.
Title Page
Abstract Introduction
Conclusions References
Tables Figures
◭ ◮
◭ ◮
Back Close
Full Screen / Esc
Printer-friendly Version Interactive Discussion
Discussion
P
a
per
|
Dis
cussion
P
a
per
|
Discussion
P
a
per
|
Discussio
n
P
a
per
|
by the Metabolic Theory of Ecology (MTE; Brown et al., 2004), which predicts that pri-mary production and respiration rates should increase at different rates with increasing temperature (Harris et al., 2006; Lopez-Urrutia et al., 2006). Noting that metabolic the-ory predicts that the activation energy for respiration should be twice as high as that for photosynthesis, Harris et al. (2006) predicted that a four degree increase in water
5
temperatures should result in a 20 % increase in net primary production and a 43 % increase in heterotrophic metabolism, resulting in a 16 % decrease of the Photosyn-thesis/Respiration ratios (P/R). Moreover, there is evidence that respiration rates show very steep responses to increased temperature at the low ambient temperatures found in Arctic waters (Pomeroy and Wiebe, 2001; Vaquer-Suyner et al., 2010). Indeed, the
10
mean activation energy for community respiration in the Greenland Sea, derived from 13 independent experiments, has been reported to be 1.05±0.3 eV (Vaquer-Suyner
et al., 2010), well above the value of 0.65 eV predicted from theory (L ´opez-Urrutia et al., 2006). On the basis of these results, Vaquer-Suyner et al. (2010) postulated that warming may lead to Arctic communities shifting from acting as an intense sink for
15
atmospheric CO2, as they do at present, to become CO2sources to the atmosphere, due to enhanced respiration rates, and suggest that this shift may occur within 6◦C of
warming, with consequences for the global carbon budget and climate (Duarte et al., 2011).
Here we test the hypothesis (Vaquer-Suyner et al., 2010; Duarte et al., 2011) that
20
Arctic plankton communities shift from acting as CO2sinks to acting as CO2 sources at a temperature threshold within 6◦C of current temperatures. We do so through an experimental examination of the temperature-dependence of response of Arctic com-munity metabolism along the temperature range of 1 to 10◦C, encompassing the range
of seawater temperature expected for the Arctic Ocean along the 21st Century (ACIA,
25
BGD
8, 11285–11309, 2011
Thresholds for Arctic plankton metabolism
J. M. Holding et al.
Title Page
Abstract Introduction
Conclusions References
Tables Figures
◭ ◮
◭ ◮
Back Close
Full Screen / Esc
Printer-friendly Version Interactive Discussion
Discussion
P
a
per
|
Dis
cussion
P
a
per
|
Discussion
P
a
per
|
Discussio
n
P
a
per
|
2 Methods
2.1 Experiment with a Barents Sea community
We designed the experiments to compare the responses of an open-ocean Arctic com-munity and an Arctic comcom-munity already acclimated to warm temperatures. We were conscious of the limitations of experimental manipulations to simulate changes, such
5
as their short temporal scales that do not allow for genetic changes and community restructuring to occur as well as the risk of creating a “shock” treatment resulting in unexpected responses. To rectify these concerns, rather than examine instantaneous responses to warming, we allowed the communities to adjust to the experimentally-imposed temperature regime, by incubating the mesocosms containing the
communi-10
ties for 10 to 15 days, imposing warming rates (◦C day−1) comparable to those observed in nature, thereby allowing the responses to be expressed. Hence, the responses eval-uated here have two components (1) a physiological component, reflecting the effect of temperature on metabolic processes; and (2) a community component, reflecting the effect of temperature on community composition and biomass.
15
Seawater samples were collected in 60 l polypropylene carboys previously treated with HCl for at least 48 h and thoroughly rinsed with the seawater from the sampling site. The experimental evaluation of temperature effects on the community metabolism of an open-sea planktonic community was performed with the plankton community found in water collected on 27 June 2009 at 26 m depth in the Barents Sea, South
20
East of the Svalbard archipelago, using the CTD rosette sampling system available on R/V Jan Mayen (water temperature −1.19◦C, salinity 33.92; Fig. 1). A second
experiment was conducted using fjord water sampled from a boat using a pump at 2 m depth in Isfjorden, the second largest fjord in Svalbard (Fig. 1). In contrast to the first experiment with the Barents Sea plankton community, the community sampled
25
BGD
8, 11285–11309, 2011
Thresholds for Arctic plankton metabolism
J. M. Holding et al.
Title Page
Abstract Introduction
Conclusions References
Tables Figures
◭ ◮
◭ ◮
Back Close
Full Screen / Esc
Printer-friendly Version Interactive Discussion
Discussion
P
a
per
|
Dis
cussion
P
a
per
|
Discussion
P
a
per
|
Discussio
n
P
a
per
|
water temperature at Isfjorden (6.2◦C) on the sampling date (8 July 2009) was much
higher than that of the Barents Sea community, whereas the salinity was comparable (32.73).
2.2 Experimental design and set-up
The experiments were conducted in cold, temperature regulated chambers (set at 4–
5
5◦C) at the University Center in Svalbard (UNIS), Longyearbyen. All plastic and
glass-ware used for the incubations was previously cleaned with HCl and thoroughly rinsed with seawater. Seven experimental temperatures, ranging from 1.5◦C to 10.5◦C, in
1.5◦C increments, were tested, thereby encompassing the full range of temperatures
forecasted for the Arctic over the 21st Century. The water from the 60 l carboys was
10
mixed in 280 l containers and transferred to duplicate acid-washed 20 l polycarbonate bottles. The duplicate bottles for each experimental temperature were submersed in 280 l tanks connected to a temperature control unit (precision±0.1◦C) with an impelling
and expelling pump. Temperature data loggers were submersed in each tank to moni-tor the resulting water temperature. The setup was completed with two fluorescent light
15
tubes per tank as to provide an appropriate, continuous light environment.
The temperature treatments for the Barents Sea community, sampled at−1◦C in situ
temperature, were achieved by gradually warming over three days to reach the target temperature while avoiding a temperature shock response of the communities. We did not raise the temperature gradually for the fjord community as the water was collected
20
at 6.2◦C. Due to the unstable temperature conditions in the cooling rooms, the
temper-atures fluctuated somewhat along both experiments, but the average temperature was successfully maintained in the different tanks (Tables 1 and 2). The experiment was maintained during 15 days for the Barents Sea community and 10 days for the Isfjorden community. The Arctic community was maintained longer due to a slower response
25
BGD
8, 11285–11309, 2011
Thresholds for Arctic plankton metabolism
J. M. Holding et al.
Title Page
Abstract Introduction
Conclusions References
Tables Figures
◭ ◮
◭ ◮
Back Close
Full Screen / Esc
Printer-friendly Version Interactive Discussion
Discussion
P
a
per
|
Dis
cussion
P
a
per
|
Discussion
P
a
per
|
Discussio
n
P
a
per
|
on to day 15. The 7◦C temperature treatment was lost in the middle of the experiment
with the Isfjorden community due to technical problems leading to a sharp increase in temperature. Hence, this treatment was discontinued.
Samples of 50 ml for chlorophyll-a determination were collected daily and filtered through Whatmann GF/F filters. Chlorophyll-a on the filters was extracted in 90 %
5
acetone for 24 h. The concentration was measured fluorometrically following Parsons et al. (1984).
Community metabolism (gross primary production, community respiration and net community production) was determined from changes in oxygen over a 24 h period. During the experiment with the Arctic community, metabolism was sampled once on
10
the first day for only one of each the duplicate replicates, 2 complete times in each replicate mesocosm, and a forth time in after duplicate replicates were pooled. Isfjor-den Communities were sampled twice in each of the replicate mesocosm. Water sam-ples from each of the 14 experimental units were carefully siphoned into narrow-mouth 25–35 ml Winkler bottles. Five replicates were used to determine the initial oxygen
15
concentration, and five replicates bottles were incubated for 24 h in both the “dark” and “light” in the temperature tanks from where the sample was taken. Net community pro-duction (NCP) and community respiration (CR) were measured by monitoring oxygen concentration changes in the light and dark bottles along the incubation (Carpenter, 1965; Carritt and Carpenter, 1966). Oxygen concentrations were analyzed by Winkler
20
titration using a potentiometric electrode and automated endpoint detection (Mettler Toledo, DL28 titrator) following Oudot et al. (1988). CR and NCP were calculated from changes in dissolved oxygen concentration from the initial concentration mea-sured after incubation of samples under “dark” and “light” conditions, respectively and gross primary production (GPP) was calculated by solving the mass balance equation
25
BGD
8, 11285–11309, 2011
Thresholds for Arctic plankton metabolism
J. M. Holding et al.
Title Page
Abstract Introduction
Conclusions References
Tables Figures
◭ ◮
◭ ◮
Back Close
Full Screen / Esc
Printer-friendly Version Interactive Discussion
Discussion
P
a
per
|
Dis
cussion
P
a
per
|
Discussion
P
a
per
|
Discussio
n
P
a
per
|
3 Results
3.1 Response of the Barents Sea community
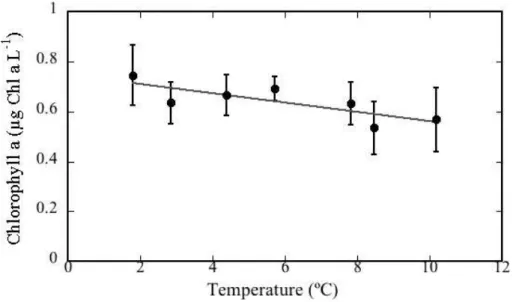
The Barents Sea community showed a significant decline in chlorophyll-a concentra-tions along the temperature range (Fig. 2), as described by a fitted regression equation with a slope of−0.02 µg Chl-al−1(R2=0.68,p=0.02) using mean chlorophyll-a
con-5
centrations for all days sampled.
Community metabolism rates fluctuated greatly throughout the time course of the experiment, as expected as the communities adapted to their new temperature treat-ments. Most notable differences in temperature treatments took place in the last measurement with pooled mesocosms at day 15 (Fig. 3a–c), as clear difference in
10
chlorophyll-a concentrations began to be seen (Fig. 3a). CR for the lowest tempera-tures (1.5, 3 and 4.5◦C) remained low throughout the experiment, while CR for medium temperatures (6 and 7.5◦C) rose throughout reaching their highest rates at day 15
(Fig. 3b). CR for 9◦C appeared to respond positively at day 9, but further incubation resulted in a low CR at day 15. CR for the 10.5◦C treatment decreased throughout
15
the time course (Fig. 3b). Patterns for NCP show similar patters across treatments throughout the time course of the experiment however increasing differences began to emerge as time increased resulting in highest NCP for the 3, 4.5 and 10.5◦C treat-ments (Fig. 3c) at day 15. These treattreat-ments also resulted in autotrophic communities (i.e. where NCP>0; Fig. 3c) by day 15.
20
When measured initially, the replicates of the Barents Sea plankton community samples were different, with one replicate acting strongly heterotrophic (i.e. NCP<0; NCP±SE=−9.31±0.10) and the other acting autotrophic (i.e. NCP>0; NCP±SE=
4.41±0.18). Through the rest of the experiment there was no noticeable difference
between the replicates so further analysis was carried out averaging the replicates
to-25
gether. Community respiration (CR) showed a variable response to experimental tem-perature increase with mean CR rates (±SE). Rates remained low for the lower
BGD
8, 11285–11309, 2011
Thresholds for Arctic plankton metabolism
J. M. Holding et al.
Title Page
Abstract Introduction
Conclusions References
Tables Figures
◭ ◮
◭ ◮
Back Close
Full Screen / Esc
Printer-friendly Version Interactive Discussion
Discussion
P
a
per
|
Dis
cussion
P
a
per
|
Discussion
P
a
per
|
Discussio
n
P
a
per
|
5.8◦C and declining somewhat with additional warming (Fig. 4a; Table 1). Net
commu-nity metabolism was balanced across the experiment (i.e. Ho: NCP=0,t-test,p=0.41) at low temperatures, but the community became net heterotrophic (NCP<0, CR> GPP) at temperatures above 4.2◦C (Fig. 4c; Table 1). The temperature-dependence
of NCP was driven by changes in CR, since GPP was variable and independent of
5
temperature changes (p=0.50; Fig. 4b; Table 1).
Since chlorophyll-aconcentrations declined across temperature treatments (Fig. 2), the responses in community metabolism may reflect changes in community biomass rather than physiological responses forced by temperature treatments. Hence, we examined the response of metabolic rates standardized to chlorophyll-a
concentra-10
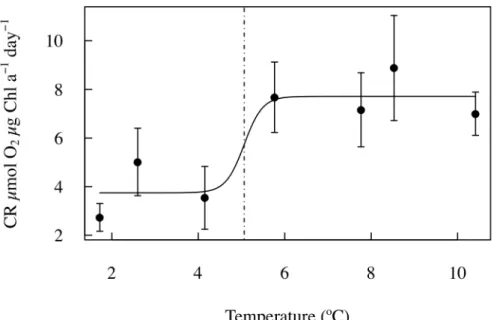
tions measured in each mesocosm on the same sampling day in an attempt to extract any physiological signal from the community responses. Indeed, CR rates standard-ized per unit chlorophyll increased significantly with increasing temperature (R2=0.64, p=0.03). However, inspection of the relationship between CR per unit chlorophyll and experimental temperature suggested that the relationship was best modeled as
15
a logistic relationship (Fig. 5). Indeed, the changes in CR per unit chlorophyll with tem-perature was well described by a logistic regression characterized by low CR per unit chlorophyll-aat low temperatures (3.75±0.90 µmol O2µg Chl-a−1day−1) and an abrupt
increase, to double the rates (7.71±0.74 µmol O2µg Chl-a−1day−1), beyond a mean
(±SE) threshold temperature of 5.06±3.02◦C (R2=0.84,p=0.19; Fig. 5).
20
Specific GPP rates, standardized per unit biomass also showed a lot of varia-tion. Mean (±SE) specific GPP rates per unit chlorophyll-a ranged between 4.14±
0.86 µmol O2µg Chl-a−1day−1 at 2.6◦C and 1.37±0.69 µmol O2µg Chl-a−1day−1 at
7.8◦C, without any clear relationship with the experimental temperature (Table 1).
Thus, the specific NCP per unit chlorophyll-a was also driven by changes in
25
CR and, therefore, also showed a logistic relationship with experimental temper-ature (Fig. 6) with a mean (±SE) threshold temperature at 4.78±1.26◦C (R2=
0.78, p=0.032; Fig. 6) with a mean (±SE) specific NCP rate at colder
BGD
8, 11285–11309, 2011
Thresholds for Arctic plankton metabolism
J. M. Holding et al.
Title Page
Abstract Introduction
Conclusions References
Tables Figures
◭ ◮
◭ ◮
Back Close
Full Screen / Esc
Printer-friendly Version Interactive Discussion
Discussion
P
a
per
|
Dis
cussion
P
a
per
|
Discussion
P
a
per
|
Discussio
n
P
a
per
|
and a strongly heterotrophic community with mean (±SE) specific NCP of −5.52±
1.05 µmol O2µg Chl-a−1day−1developing at warmer temperatures (Table 1; Fig. 6).
3.2 Atlantic-influence fjord water community
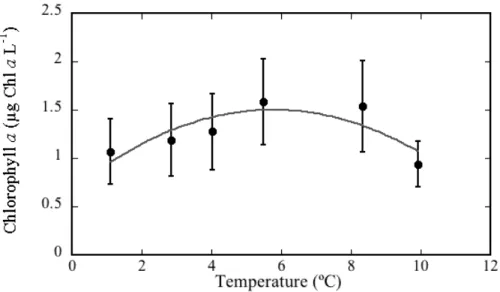
Atlantic community showed no significant trend in chlorophyll-a concentrations along the experimental temperature range (Fig. 7) with the highest mean biomass of about
5
1.5 µg Chl-al−1 developed at the temperature at which the sampled community was growing of 6.2◦C (Table 2). Atlantic communities were originally close to being bal-anced (NCP±SE=−0.73±0.35) while specific community metabolic rates were
het-erotrophic (NCP±SE=−3.49±1.65). Community respiration (CR) for the Atlantic
in-fluenced community showed high variation and no clear relationship with experimental
10
temperature, similar to gross primary production (Table 2), and net community. As a consequence, net community production was independent of experimental temper-ature, with some temperature treatments (i.e. 3 and 8.5◦C) resulting in strong het-erotrophic community metabolism (Table 2).
Since chlorophyll-a concentrations were independent of the experimental
tempera-15
ture, the chlorophyll-aspecific rates showed the same patterns as those of the volumet-ric rates, with no significant relationship with the experimental temperature (Table 2).
4 Discussion
The experimental results presented show that the metabolism of the open-sea Arctic
20
community collected in the Barents Sea was highly sensitive to warming, whereas that of the community already growing in the Atlantic-influenced, warm-water Arctic fjord, showed no clear relationship with experimental temperature across the 1 to 10◦C experimental range.
Consistent with predictions from metabolic theory (Harris et al., 2006; Lopez-Urrutia
25
BGD
8, 11285–11309, 2011
Thresholds for Arctic plankton metabolism
J. M. Holding et al.
Title Page
Abstract Introduction
Conclusions References
Tables Figures
◭ ◮
◭ ◮
Back Close
Full Screen / Esc
Printer-friendly Version Interactive Discussion
Discussion
P
a
per
|
Dis
cussion
P
a
per
|
Discussion
P
a
per
|
Discussio
n
P
a
per
|
from balanced metabolism (NCP=0, GPP=CR) at lower temperatures to a strongly heterotrophic community (NCP<0, GPP<CR), acting as a CO2source. This response was, however, steeper than expected. Whereas the expectations derived from the con-sideration of the temperature-dependence of metabolic processes (Harris et al., 2006; Lopez-Urrutia et al., 2006; Vaquer-Sunyer et al., 2010), the realized responses involved
5
also changes at the community level, particularly a decline in chlorophyll-a concentra-tion. Moreover, the decline in chlorophyll-aconcentration with increasing temperature explains that, unlike the predictions by metabolic theory, gross primary production did not show significant increase with warming for the Barents Sea community, despite a tendency for increased chlorophyll-a-specific GPP at higher temperatures (Table 1).
10
Hence, the increase in CR and decline in NCP for the Barents Sea community with increasing warming compounded physiology-level with community-level responses to yield a much steeper decline in net community metabolism of the community, which be-comes strongly heterotrophic. Previous examinations of the temperature-dependence of community metabolism, available only for respiration rates, used short-term, 24 h
15
to 48 h, experiments (Vaquer-Sunyer et al., 2010), and did not allow, therefore, for responses in community structure to be realized.
Using the Van’t Hoff-Arrhenius relation, we can then estimate the activation energy (Ei) required for the reaction of respiration across experimental temperature treat-ments using the equation: B∼e−E i /kT and the Boltzman’s constant, k (8.617343×
20
10−5eV K−1), where B is the metabolic rate andT the temperature in Kelvin (Gillooly
et al., 2001; Brown et al., 2004). The experiment conducted with the Barents Sea com-munity yields anEi of approximately 0.85 eV, higher than the value of 0.65 eV predicted
from theory (L ´opez-Urrutia et al., 2006), but not different from Ei derived from
short-term experiments of 1.05±0.3 eV (Vaquer-Suyner et al., 2010). The Ei of 0.85 eV
25
derived here confirms that respiration rates of Arctic plankton communities have Ei
BGD
8, 11285–11309, 2011
Thresholds for Arctic plankton metabolism
J. M. Holding et al.
Title Page
Abstract Introduction
Conclusions References
Tables Figures
◭ ◮
◭ ◮
Back Close
Full Screen / Esc
Printer-friendly Version Interactive Discussion
Discussion
P
a
per
|
Dis
cussion
P
a
per
|
Discussion
P
a
per
|
Discussio
n
P
a
per
|
lower range of ocean temperature show a steep response to increased temperature (Pomeroy and Wiebe, 2001; Vaquer-Suyner et al., 2010). In contrast, this could also be the reason that no significant relationships were found in the experiment with the Atlantic-influenced fjord water communities, which are exposed to much more variable temperatures throughout the spring melt season.
5
Most importantly, the results obtained here allowed the postulated temperature threshold beyond which Arctic communities become heterotrophic to be experimentally resolved at about 5◦C (4.78
±1.26◦C). Indeed, the relationship between net
commu-nity metabolism and temperature was best described as a logistic relationship where communities shift from metabolic balance to net heterotrophic beyond a temperature
10
threshold of 5◦C, above which the specific community respiration doubles and NCP is
reduced 5-fold. These results provide, therefore, support for the proposition that Arc-tic plankton community metabolism shows tipping point behavior (Duarte et al., 2011), and quantifies the tipping point for the community to flip from acting as a CO2sink to a CO2source at a temperature threshold of 5◦C. Isfjorden communities were growing
15
in Arctic ecosystems invaded by warm Atlantic waters, however decreasing water tem-perature did not cause the metabolic rates of the Isfjorden community tested here to become autotrophic, within the limitations of the duration of the experiment conducted here. This may suggest the presence of hysteresis creating a resistance for commu-nities already growing in warm waters to revert from a net heterotrophic community to
20
an autotrophic one as waters become colder (Duarte et al., 2011).
The results here derive from mesocosm experiments and therefore suffer from the limitations inherent to these experimental set-ups (cf. Duarte et al., 1997). However, the results do not stand alone in concluding that polar plankton communities show a steep response to warming, as these results are supported by theoretical
expecta-25
BGD
8, 11285–11309, 2011
Thresholds for Arctic plankton metabolism
J. M. Holding et al.
Title Page
Abstract Introduction
Conclusions References
Tables Figures
◭ ◮
◭ ◮
Back Close
Full Screen / Esc
Printer-friendly Version Interactive Discussion
Discussion
P
a
per
|
Dis
cussion
P
a
per
|
Discussion
P
a
per
|
Discussio
n
P
a
per
|
of Southern Ocean communities, as Arctic communities have access to large pools of dissolved organic carbon that lead to high community respiration rates and allow net heterotrophic communities to prevail (Regaudie-de-Gioux and Duarte, 2010). The present results suggest that Arctic plankton communities may be considered, as pro-posed by Duarte et al. (2011), as tipping elements (sensu Lenton et al., 2008),
trigger-5
ing changes when perturbed beyond climatic tipping points. Specifically, an increase beyond 5◦C in the Arctic Ocean could lead plankton communities to become strongly heterotrophic in the Arctic summer, leading to a shift of the Arctic Ocean region from a large sink of atmospheric CO2 (Takahashi et al., 2002) to a CO2source with further future climate warming.
10
Acknowledgements. This research was supported by the Arctic Tipping Points project (www. eu-atp.org, contract number 226248 of the Framework Program 7 of the European Union). We thank R. Gutierrez for chlorophyll-a analyses, R. Martinez for help with metabolic measure-ments, and the University Center in Svalbard (UNIS) for accommodation, laboratory space, and technical support. J. H. was supported by a JAE fellowship (CSIC, Spain).
15
References
ACIA, Impacts of a Warming Arctic: Arctic Climate Impact Assessment, Cambridge University Press, Cambridge, UK, 2004.
Arrigo, K. R., van Dijken, G., and Pabi, S.: Impact of a shrinking Arctic ice cover on marine primary production, Geophys. Res. Lett., 35, L19603, doi:10.1029/2008GL035028, 2008. 20
Belchansky, G. I., Douglas, D. C., and Platonov, N. G.: Duration of the arctic sea ice melt season: regional and interannual variability, 1979–2001, J. Climate, 17, 67–80, doi: 10.1175/1520-0442(2004)017¡0067:DOTASI¿2.0.CO;2, 2004.
Brown, J. H., Gillooly, J. F., Allen, A. P., Savage, V. M., and West, G. B.: Towards a metabolic theory of ecology, Ecology, 85, 1771–1789, 2004.
25
Bo ´e, J., Hall, A., and Qu, X.: September sea-ice cover in the Arctic Ocean projected to vanish by 2100, Nat. Geosci., 2, 341–343, doi:10.1038/ngeo467, 2009.
BGD
8, 11285–11309, 2011
Thresholds for Arctic plankton metabolism
J. M. Holding et al.
Title Page
Abstract Introduction
Conclusions References
Tables Figures
◭ ◮
◭ ◮
Back Close
Full Screen / Esc
Printer-friendly Version Interactive Discussion
Discussion
P
a
per
|
Dis
cussion
P
a
per
|
Discussion
P
a
per
|
Discussio
n
P
a
per
|
Carritt, D. E. and Carpenter, J.: Comparison and evaluation of currently employed modifications of Winkler method for determining dissolved oxygen in seawater – a Nasco report, J. Mar. Res., 24, 286–318, 1966.
Duarte, C. M. and Agust´ı, S.: The CO2balance of unproductive aquatic ecosystems, Science,
281, 234–236, doi:10.1126/science.281.5374.234, 1998. 5
Duarte, C. M., Gasol, J. M., and Vaqu ´e, D.: Role of experimental approaches in marine micro-bial ecology, Aquat. Microb. Ecol., 13, 101–111, 1997.
Duarte C. M., Agust´ıS., Wassmann, P., Arrieta, J. M., Alcaraz, M., Coello, A., Marb ´a, N., Hen-driks, I., Holding, J., Garc´ıa-Zarandona, I., Kritzberg, E., and Vaqu ´e, D.: Tipping elements in the Arctic marine ecosystem, AMBIO, in press, 2011.
10
Ellingsen, I. H., Dalpadado, P., Slagstad, D., and Loeng, H.: Impact of climatic change on the bi-ological production in the Barents Sea, Climatic Change, 87, 155–175, doi:10.1007/s10584-007-9369-6, 2007.
Fransson, A., Chierici, M., Anderson, L. G., Bussmann, I., Kattner, G., Jones, E. P., and Swift, J. H.: The importance of shelf processes for the modification of chemical constituents 15
in the waters of the Eurasian Arctic Ocean: implication for carbon fluxes, Cont. Shelf Res., 21, 225–242, 2001.
Gillooly, J. F., Brown, J. H., West, G. B., Savage, V. M., and Charnov, E. L.: Effects of size and temperature on metabolic rate., Science, 293, 2248–51, doi:10.1126/science.1061967, 2001.
20
Harris, L. A., Duarte, C. M., and Nixon, S. W.: Allometric laws and prediction in estuarine and coastal ecology, Estuar. Coast., 29(2), 340–344, doi:10.1007/BF02782002, 2006.
Holland, M. M., Bitz, C. M., and Tremblay, B.: Future abrupt reductions in the summer Arctic sea ice, Geophys. Res. Lett., 33(23), L23503, doi:10.1029/2006GL028024, 2006.
Iriberri, J., Undurraga, A., Muela, A., and Egea, L.: Heterotrophic bacterial activity in coastal 25
waters: functional relationship of temperature and phytoplankton population, Ecol. Model., 28, 113–120, 1985.
Johannessen, O. M., Shalina, E. V., and Miles, M. W.: Satellite Evidence for an Arctic Sea Ice Cover in Transformation, Science, 286, 1937–1939, doi:10.1126/science.286.5446.1937, 1999.
30
Kaltin, S. and Anderson, L. G.: Uptake of atmospheric carbon dioxide in Arctic shelf seas: eval-uation of the relative importance of processes that influencepCO2in water transported over
BGD
8, 11285–11309, 2011
Thresholds for Arctic plankton metabolism
J. M. Holding et al.
Title Page
Abstract Introduction
Conclusions References
Tables Figures
◭ ◮
◭ ◮
Back Close
Full Screen / Esc
Printer-friendly Version Interactive Discussion
Discussion
P
a
per
|
Dis
cussion
P
a
per
|
Discussion
P
a
per
|
Discussio
n
P
a
per
|
2005.
Kerr, R. A.: Is battered Arctic sea ice down for the count?, Science, 318, 33–34, 2007.
Kwok, R. and Rothrock, D. A.: Decline in Arctic sea ice thickness from submarine and ICESat records: 1958–2008, Geophys. Res. Lett., 36, L15501, doi:10.1029/2009GL039035, 2009. Lenton, T. M., Held, H., Kriegler, E., Hall, J. W., Lucht, W., Rahmstorf, S., and Schellnhu-5
ber, H. J.: Tipping elements in the Earth’s climate system, P. Natl. Acad. Sci. USA, 105, 1786–1793, doi:10.1073/pnas.0705414105, 2008.
Loeng, H., Ozhigin, V. K., and ˚Adlandsvik, B.: Water fluxes through the Barents Sea, ICES J. Mar. Sci., 54, 310–317, doi:10.1006/jmsc.1996.0165, 1997.
Loeng, H., Brander, K., Carmack, E., Denisenko, S., Drinkwater, K., Hansen, B., Kovacs, K., 10
Livingston, P., Mclaughlin, F., and Sakshaug, E.: Marine Systems, in: Arctic Climate Impact Assessment, Cambridge University Press, Cambridge, 453–538, 2005.
L ´opez-Urrutia, ´A., San Martin, E., Harris, R. P., and Irigoien, X.: Scaling the metabolic balance of the oceans, P. Natl. Acad. Sci. USA, 103, 8739–8744, doi:10.1073/pnas.0601137103, 2006.
15
National Snow and Ice Data Center (NSIDC), NASA, http://www.nsidc.org/, last access: 1 November 2011.
Oudot, C., Gerard, R., Morin, P., and Gningue, I.: Precise shipboard determination of dis-solved oxygen (Winkler procedure) for productivity studies with a commercial system, Limnol. Oceanogr., 33, 146–150, 1988.
20
Parsons T. R., Maita Y., and Lalli, C. M.: A Manual of Chemical and Biological Methods for Seawater Analysis, Pergamon Press, Oxford, 173, 1984.
Pauly, D. and Christensen, V.: Primary production required to sustain global fisheries, Nature, 374, 255–257, doi:10.1038/374255a0, 1995.
Pomeroy, L. and Wiebe, W.: Temperature and substrates as interactive limiting factors for 25
marine heterotrophic bacteria, Aquat. Microb. Ecol., 23, 187–204, doi:10.3354/ame023187, 2001.
Regaudie-de-Gioux, A. and Duarte, C. M.: Plankton metabolism in the Greenland Sea during the polar summer of 2007, Polar Biol., 33(12), 1651–1660, doi:10.1007/s00300-010-0792-1, 2010.
30
BGD
8, 11285–11309, 2011
Thresholds for Arctic plankton metabolism
J. M. Holding et al.
Title Page
Abstract Introduction
Conclusions References
Tables Figures
◭ ◮
◭ ◮
Back Close
Full Screen / Esc
Printer-friendly Version Interactive Discussion
Discussion
P
a
per
|
Dis
cussion
P
a
per
|
Discussion
P
a
per
|
Discussio
n
P
a
per
|
Schauer, U., Loeng, H., Rudels, B., Ozhigin, V. K., and Dieck, W.: Atlantic Water flow through the Barents and Kara Seas, Deep-Sea Res. Pt I, 49, 2281–2298, doi:10.1016/S0967-0637(02)00125-5, 2002.
Takahashi, T., Sutherland, S. C., Sweeney, C., Poisson, A., Metzl, N., Tilbrook, B., Bates, N., Wanninkhof, R., Feely, R. A., Sabine, C. L., Olafsson, J., Nojiri, Y.: Global sea–air CO2
5
flux based on climatological surface oceanpCO2, and seasonal biological and temperature
effects, Deep-Sea Res. Pt. II, 49, 1601–1622, doi:10.1016/S0967-0645(02)00003-6, 2002. Trenberth, K. E., Jones, P. D., Ambenje, P., Bojariu, R., Easterling, D., Klien Tank, A., Parker, D.,
Rahimzadeh, F., Renwick, J. A., Rusticucci, M., Soden, B., and Zhai, P.: Observations: sur-face and atmospheric climate change, In: Climate Change 2007: The Physical Science 10
Basis, Contribution of Working Group I to the Fourth Assessment Report of the Intergovern-mental Panel on Climate Change, edited by: Solomon S. D., Qin, D., Manning, M., Chen, Z., Marquis, M., Averyt, K. B., Tignor, M., and Miller, H. L., Cambridge University Press, Cam-bridge, UK, 235–336, 2007.
Vaquer-Sunyer, R., Duarte, C. M., Santiago, R., Wassmann, P., and Reigstad, M.: Experimental 15
evaluation of planktonic respiration response to warming in the European Arctic Sector, Polar Biol., 33(12), 1661–1671, doi:10.1007/s00300-010-0788-x, 2010.
Wadhams, P.: Arctic ice cover, ice thickness and tipping points, AMBIO, in press, 2011. Walsh, J. E.: Climate of the Arctic Marine Environment, America, 18(2), S3–S22, 2008. Wang, M. and Overland, J. E.: A sea ice free summer Arctic within 30 years?, Geophys. Res. 20
Lett., 36, L07502, doi:10.1029/2009GL037820, 2009.
Wassmann, P., Slagstad, D., Riser, C. W., and Reigstad, M.: Modelling the ecosystem dynamics of the Barents Sea including the marginal ice zone II. Carbon flux and interannual variability, J. Marine Syst., 59, 1–24, doi:10.1016/j.jmarsys.2005.05.006, 2006.
Wassmann, P., Carroll, J., and Bellerby, R.: Carbon flux and ecosystem feedback in the north-25
ern Barents Sea in an era of climate change: an introduction, Deep-Sea Res. Pt II, 55, 2143–2153, doi:10.1016/j.dsr2.2008.05.025, 2008.
Wassmann, P., Slagstad, D., and Ellingsen, I.: Primary production and climatic variability in the European sector of the Arctic Ocean prior to 2007: preliminary results, Polar Biol., 33, 1641–1650, doi:10.1007/s00300-010-0839-3, 2010.
30
BGD
8, 11285–11309, 2011
Thresholds for Arctic plankton metabolism
J. M. Holding et al.
Title Page
Abstract Introduction
Conclusions References
Tables Figures
◭ ◮
◭ ◮
Back Close
Full Screen / Esc
Printer-friendly Version Interactive Discussion
Discussion
P
a
per
|
Dis
cussion
P
a
per
|
Discussion
P
a
per
|
Discussio
n
P
a
per
|
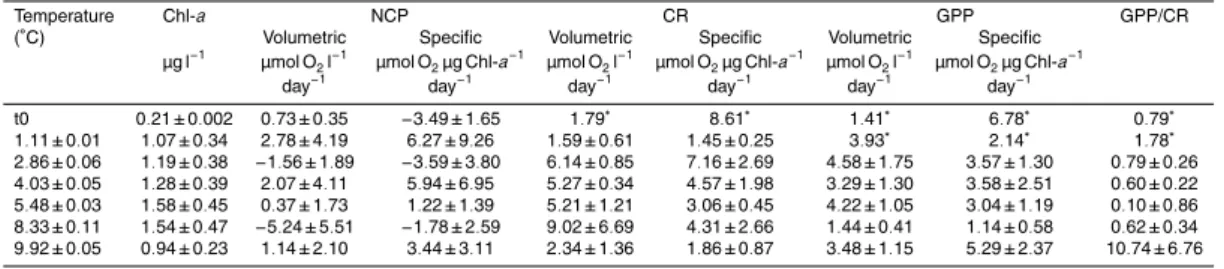
Table 1. Experiment with Arctic open-water community. Average temperature (±SE),
Chlorophyll-a(±SE), and volumetric and specific NCP, CR and GPP rates (±SE) over 15 days
of experimental treatment including initial measurements (t0).
Temperature Chl-a NCP CR GPP GPP/CR (◦C) Volumetric Specific Volumetric Specific Volumetric Specific
µg l−1 µmol O 2l−
1 µmol O 2µg Chl-a−
1 µmol O 2l−
1 µmol O 2µg Chl-a−
1 µmol O 2l−
1 µmol O 2µg Chl-a−
1
day−1 day−1 day−1 day−1 day−1 day−1
t0 1.00±0.16 −2.45±6.86 −3.64±7.43 7.18±6.98 8.50±8.33 4.73±0.11 4.87±0.90 11.58±11.24 1.72±0.26 0.72±0.06 −0.94±1.40 −0.98±1.95 1.90±0.31 2.74±0.57 0.70∗ 2.06∗ 0.52∗ 2.60±0.5 0.63±0.08 0.20±1.43 −0.59±2.35 2.65±0.31 5.02±1.39 2.78±0.99 4.14±0.86 1.31±0.64 4.15±0.06 0.70±0.06 −0.28±0.95 −1.34±1.70 2.08±0.62 3.54±1.29 1.69±0.05 2.17±0.11 1.20±0.39 5.76±0.10 0.76±0.078 −3.86±0.93 −5.53±1.37 5.37±1.15 7.68±1.45 2.13±0.69 3.01±0.92 0.40±0.16 7.77±0.15 0.55±0.04 −3.87±0.69 −7.22±1.85 4.01±0.66 7.16±1.52 0.81±0.36 1.37±0.69 0.19±0.08 8.53±0.05 0.48±0.05 −2.81±0.97 −6.07±1.83 4.14±1.32 8.88±2.16 1.75±0.47 3.52±0.65 0.41±0.10 10.42±0.23 0.462±0.06 −1.74±0.86 −2.99±2.06 3.14±0.91 7.00±0.89 0.98±0.38 4.01±2.78 0.61±0.39
BGD
8, 11285–11309, 2011
Thresholds for Arctic plankton metabolism
J. M. Holding et al.
Title Page
Abstract Introduction
Conclusions References
Tables Figures
◭ ◮
◭ ◮
Back Close
Full Screen / Esc
Printer-friendly Version Interactive Discussion
Discussion
P
a
per
|
Dis
cussion
P
a
per
|
Discussion
P
a
per
|
Discussio
n
P
a
per
|
Table 2. Experiment with Atlantic influenced fjord communities. Average temperature (±SE),
Chlorophyll-a(±SE), and volumetric and specific NCP, CR and GPP rates (±SE) over 10 days
of experimental treatment including initial measurements (t0).
Temperature Chl-a NCP CR GPP GPP/CR (◦C) Volumetric Specific Volumetric Specific Volumetric Specific
µg l−1
µmol O2l− 1
µmol O2µg Chl-a− 1
µmol O2l− 1
µmol O2µg Chl-a− 1
µmol O2l− 1
µmol O2µg Chl-a− 1
day−1
day−1
day−1
day−1
day−1
day−1
t0 0.21±0.002 0.73±0.35 −3.49±1.65 1.79∗ 8.61∗ 1.41∗ 6.78∗ 0.79∗ 1.11±0.01 1.07±0.34 2.78±4.19 6.27±9.26 1.59±0.61 1.45±0.25 3.93∗ 2.14∗ 1.78∗
2.86±0.06 1.19±0.38 −1.56±1.89 −3.59±3.80 6.14±0.85 7.16±2.69 4.58±1.75 3.57±1.30 0.79±0.26 4.03±0.05 1.28±0.39 2.07±4.11 5.94±6.95 5.27±0.34 4.57±1.98 3.29±1.30 3.58±2.51 0.60±0.22 5.48±0.03 1.58±0.45 0.37±1.73 1.22±1.39 5.21±1.21 3.06±0.45 4.22±1.05 3.04±1.19 0.10±0.86 8.33±0.11 1.54±0.47 −5.24±5.51 −1.78±2.59 9.02±6.69 4.31±2.66 1.44±0.41 1.14±0.58 0.62±0.34 9.92±0.05 0.94±0.23 1.14±2.10 3.44±3.11 2.34±1.36 1.86±0.87 3.48±1.15 5.29±2.37 10.74±6.76
BGD
8, 11285–11309, 2011
Thresholds for Arctic plankton metabolism
J. M. Holding et al.
Title Page
Abstract Introduction
Conclusions References
Tables Figures
◭ ◮
◭ ◮
Back Close
Full Screen / Esc
Printer-friendly Version Interactive Discussion
Discussion
P
a
per
|
Dis
cussion
P
a
per
|
Discussion
P
a
per
|
Discussio
n
P
a
per
|
Fig. 2.Mean (±SE) chlorophyll-aconcentration (µg Chl-al−1) of the Barents Sea plankton
BGD
8, 11285–11309, 2011
Thresholds for Arctic plankton metabolism
J. M. Holding et al.
Title Page
Abstract Introduction
Conclusions References
Tables Figures
◭ ◮
◭ ◮
Back Close
Full Screen / Esc
Printer-friendly Version Interactive Discussion
Discussion
P
a
per
|
Dis
cussion
P
a
per
|
Discussion
P
a
per
|
Discussio
n
P
a
per
|
Fig. 4. Barents Sea plankton community mean (±SE) volumetric community metabolic rates:
BGD
8, 11285–11309, 2011
Thresholds for Arctic plankton metabolism
J. M. Holding et al.
Title Page
Abstract Introduction
Conclusions References
Tables Figures
◭ ◮
◭ ◮
Back Close
Full Screen / Esc
Printer-friendly Version Interactive Discussion
Discussion
P
a
per
|
Dis
cussion
P
a
per
|
Discussion
P
a
per
|
Discussio
n
P
a
per
|
Fig. 5. The relationship between the mean Chl-a-specific community respiration (CR) rate of the Barents Sea community along the experiment and the average temperature treatments. The solid line shows the fitted logistic regression equation, which defines a threshold tempera-ture (±SE) of 5.06±3.02◦C above which average specific CR rates (±SE) approximately double
from a mean rate of 3.75±0.90 µmol O2µg Chl-a− 1
day−1
at lower temperatures to a mean rate of 7.71±0.74 µmol O2µg Chl-a−
1
day−1
BGD
8, 11285–11309, 2011
Thresholds for Arctic plankton metabolism
J. M. Holding et al.
Title Page
Abstract Introduction
Conclusions References
Tables Figures
◭ ◮
◭ ◮
Back Close
Full Screen / Esc
Printer-friendly Version Interactive Discussion
Discussion
P
a
per
|
Dis
cussion
P
a
per
|
Discussion
P
a
per
|
Discussio
n
P
a
per
|
Fig. 6. The relationship between the mean net community production (NCP) rate of the Bar-ents Sea plankton community along the experiment and average temperature treatmBar-ents. The solid line shows the fitted logistic regression equation, which defines the threshold tempera-ture (±SE) of 4.78±1.26◦C above which average specific NCP rates (±SE) decrease from
a mean rate of−0.72±1.31 µmol O2µg Chl-a− 1
day−1
at lower temperature to a mean rate of
−5.52±1.05 µmol O2µg Chl-a− 1
day−1
BGD
8, 11285–11309, 2011
Thresholds for Arctic plankton metabolism
J. M. Holding et al.
Title Page
Abstract Introduction
Conclusions References
Tables Figures
◭ ◮
◭ ◮
Back Close
Full Screen / Esc
Printer-friendly Version Interactive Discussion
Discussion
P
a
per
|
Dis
cussion
P
a
per
|
Discussion
P
a
per
|
Discussio
n
P
a
per
|
Fig. 7. Mean (±SE) chlorophyll-aconcentration (µg Chl-al−1) of the Atlantic fjord community