Vol. 4 No. 1, Special Issue, 2016, pp. 87-108
87
DIVERGENCE OF FOOD AND NUTRITIONAL SECURITY- A
STUDY ON WESTERN ODISHA
Digambar Chand
Faculty, Department of Economics, Bamra Trust Fund College, Bamra, Odisha,
India, E-mail:[email protected]
Rajendra Gartia
P.G. Department of Statistics, Sambalpur University, ,Odisha, India
Abstract
Food security and nutritional security are the subsets of livelihood security. Poor nutritional outcomes of infants and children arise from the poor health status of women, overall poverty, lack of hygiene and inadequate health facilities. The study discusses the divergence between food security and nutritional security in the state as a whole and the
region in particular.A multi stage random sampling technique has been adopted for the
collection of data.Statistical analysis used for drawing valid inferences are testing of hypothesis, chi square test, regression analysis and fitting of trend lines. In the present study an attempt has been made to address the issues namely: i) incidence of malnutrition and food insecurity through three critical links viz. children, adolescent girls and women, ii) surplus/deficit of production of cereals, pulses, food grains and oilseeds as per requirement iii) trends of production and availability of secondary diets such as egg, meat, fish and milk iv) indicators of malnutrition. Production must be diversified from cereal crop production like paddy to other crops.A life-cycle approach to management was adopted that integrates strategy, people resources, processes and measurements to improve.
Key Words: Food security, Malnutrition ,Nutritional security, Secondary diet. 1. Introduction:
88
such as agricultural import tariffs, inflation rate, exchange rate and food price index are considered as important FNS access indicators. The presence of effective and efficient safety nets, micronutrient interventions, food reserves and institutional regulation are all important drivers of FNS to keep track of (Pangaribowo,Gerber & Torero,2013).Normalization and weighting are not very crucial decisions, whereas special attention has to be paid in choosing the data imputation and aggregation methods. He emphasized transparency on the steps to build the index for judgment or comparison with existing indicators (Santeramo,2014).
Poverty and inability to purchase adequate food leading to under nutrition and micronutrient deficiencies persist even today among the poor segments of population. Body size and physical activity levels are two major determinants of human nutrient requirements. The nineties witnessed the emergence of dual nutrition burden in all the countries with persistent inadequate dietary intake and under nutrition on one side and low physical activity/ food intake above requirements and over nutrition on the other side. The persistent high underweight rates in preschool children have been a matter of serious concern in India. As both under-and over nutrition are associated with health hazards, India has to combat and prevent dual burden of under nutrition and over nutrition(Ramachandran, 2013). Ensuring food and nutrition security is a challenge for India, given its huge population and high levels of poverty and malnutrition. The level of food absorption is also low. Food and nutrition security is broadly characterized by three pillars: availability, accessibility, and absorption (nutritional outcomes). The Integrated Child Development Scheme and Mid Day Meal Scheme are two flagship public programs directed toward addressing the nutritional outcomes for women and children. There are other food-based programs targeted to ensure the nutritional security of the vulnerable groups. Growth alone may not be able to ensure food security for the poor and vulnerable. Poor nutritional outcomes of infants and children arise from the poor health status of women, overall poverty and lack of hygiene, and inadequate health facilities. It is also true that higher growth resulting in better employment and income opportunities is a more sustainable solution to ending poverty and hunger. This is in line with the inclusive growth principle of the country (Nandakumar, Ganguly, Sharma & Gulati, 2010).
The Food and nutritional insecurity prevails even in the food-surplus areas, with low-income households being more vulnerable to it. The access to food determined by the level of income and family-size has been found as the most important factor influencing food and nutritional security in food-surplus areas. Increase in production alone does not ensure food and nutritional security. The incidence and depth of food and nutritional insecurity and its determinants has been estimated in a food-surplus area, e.g. the state of Punjab. Almost 76 per cent of the rural landless households were food insecure, with 27 per cent deficiency in food intake than the requirement. Rural and urban labourers as well as other poorly asset-backed and low-income households are more vulnerable to food and nutritional insecurity. They suggested that income and employment opportunities for more vulnerable sections of the society will have to be augmented to alleviate their food insecurity and malnutrition(Sidhu,Kaur&Vatta,2008).Considering a large set of estimates on income elasticity for calories, protein, fat, zinc, iron and vitamin A, they found that changes in consumption patterns in response to price and income change could impact on nutrient intake with related positive or negative consequences. Through meta-analysis, calories and proteins were found to be more income-inelastic than fat and micronutrients, which was found to be more sensitive to income changes (Santeramo & Nadia, 2015).
89
insecurity by providing livelihood to the poor. The state‟s coastal areas are relatively better off, but the hinterland which also inhabits vast Scheduled Tribe (ST) population in hilly and forest terrain, is quite backward. The majority of total ST population is concentrated in the western districts of Ordisha.Traditional agricultural system, indigenous knowledge were neglected, demeaned, discarded at last for establishment of capital-based agriculture.First green revolution has played an important role to achieve their aim. Now farmers are completely dependent on market for seeds, fertilizers, pesticides coupled with dependent on government and non-government institutions for begging loan. It is worth mentioning that fertile soil is important rather than hybrid seed. More importance on paddy and wheat destroyed our food basket with different varieties of food and self-sufficiency of food. There is acute shortage of Millets like Desi Mandia, Bazra,Kudo, Koshla, Suan, Guruji, Kangu,Zuar, Gangei. varieties of dal like Mung, Biri, Kandul, Harhar etc., varieties of oil like
coconut, Mustard, Til, Methi etc., varieties of Masala and vegetables. Millets in our country linked directly with portentous food basket, food security, and ecological protection. Crop failures occur due to lack of irrigation facilities, scanty rainfall, natural calamities and crop diseases. Now a day there is no other alternative provision for farmers in the occurrence of crop failure of paddy and wheat. The population of this region suffers from high morbidity on account of under nutrition as well as endemic malaria and other life threatening diseases. The people living in this region lack in their awareness on various aspects of life including lack of access to various amenities and opportunities created and also to the natural as well as environmental resources around them. Ignorance and inadequate purchasing power to access the resources may have tremendous effect on their health and nutritional standard.
Further, since time immemorial people have been celebrating Nua-Khai1, Cher Chhera2,
Paus-Purnima3. Nua –Khai is celebrated in the month of Bhadraba Sukla Panchami, which
is the season of food insecurity. This festival as a ritual festival played a major role in promoting agriculture as a way of life. As farmers who have already sown all their grains in agricultural fields, it is believed that even birds do not get food during this starvation period.
Only „Saria Dhan’4
a short period paddy variety is harvested during this time. The ancient
origin of “Nua Khai” traced back at least to vedic times, when the rishis(Sages) had talked
panchayajna5, the five important activities in an annual calendar year of an agrarian
society(Jamiullah,2014).
The Food Security Act is a reply to food hunger in a holistic manner. One has to deal with three kinds of hunger if food and nutrition security has to be achieved. First, one has to help farm families overcome under nutrition as a result of calorie deprivation. This can be achieved through the provisions of the National Food Security Bill. Secondly, protein hunger is becoming serious due to the inadequate consumption of pulses and milk (in case of vegetarians) and eggs, fish and meat (in case of non-vegetarian). Third, there is widespread hidden hunger, caused by the deficiency of micronutrients like iron, iodine, zinc, vitamin A, vitamin B12, etc. in the diet.
With this backdrop of acceleration of food prices and sharpening of malnutrition, food insecurity and hunger among the poor household, the purpose of the study is to find out the ways and means to tap the divergence between food and nutrition security.
2.Database and Methodology:
90
corresponding blocks. In the next stage the sample households were selected on stratified random basis to represent different land classes such as Marginal, Small, Medium, Semi Medium and Large farmers‟ category. Each category consists of 20 farmers from each village under study. Therefore, there are 300 respondents under study.
In the present study the three sample districts represent Sundargarh(tribal), Sambalpur(non irrigated) and Bargarh(irrigated). The three blocks are Bargaon, Bamra and Attabira of Sundargarh, Sambalpur and Bargarh districts respectively. The three villages are Bhoipali, Bamphei and Sindurbahal of Bargaon, Bamra and Attabira blocks respectively.
Various statistical tools and techniques such as regression analysis to estimate the model parameters and fit the trend lines, testing of hypothesis of attributes through Chi-Square tests are employed for data analysis and drawing valid statistical inferences about the population parameters. The data are classified and represented through tables and bar diagrams for ease of comparison.
3.An overview of Socio-Economic Profile of Odisha
The status of Odisha in Human Development Index(HDI) is alarming the grave situation of socio-economic life of the people. The comparative study of HDI between Odisha and India highlights the status of living condition of people of Odisha(See Table 1). While Odisha could retain its HDI positions at 11th and 12th in the years 1981 and 1991 respectively, its position got worsen to 19th in 2011, indicating the lower status of living standard. It‟s a challenge for every human being to have an opportunity for healthy and productive life. These are (i) adequate dietary calories to prevent under-nutrition (ii) adequate quantity of proteins to fight protein hunger (iii) eliminating hidden hunger caused by the deficiency of micronutrients like iron,zinc,iodine Vitamin A and Vitamin B12. Hence malnutrition impairs cognitive development, intelligence, strength, energy and productivity. To add this woe, malnourished children are always vulnerable to infections and communicable diseases. In short, malnutrition is a negation to social development. There also appears to be a high correlation between Infant Mortality Rate( IMR) and Maternal Mortality Rate (MMR).Three factors explain a high level of IMR in Odisha:(i) poor availability of professional attendants at birth, (ii) high percentage of low birth weight babies, and (iii) lack of professional pre and post-natal care. The World Bank report finds that most of the retardation in growth in India occurs either during the pregnancy or during the first two years after birth. Critics often argue that the economic reforms have failed to reach the poor and deprived sections of society(Kausal, 2011) (See Figure-1).
Table 1. Human Development Index for Odisha and India
Source : Statistical Abstract of Odisha 2012, PP 825
The infant mortality rate is high in Odisha as compared to India. The three critical links of malnutrition are children, adolescent girls and women. The poor amongst the poor are more vulnerable to chronic diseases because of material deprivation and psychosocial stress, higher levels of risk behavior, unhealthy living conditions and limited access to good quality healthcare. Once disease is established, the poor are also more likely to suffer adverse consequences than wealthier people. This is especially true of women, as they are often more
1981 1991 2001 2011
States Index Ranks Index Ranks Index Ranks Index Ranks Odisha 0.267 11 0.345 12 0.404 11 0.442 19
91
vulnerable to the effects of social inequality and poverty, and less able to access resources. The percentage of malnutrition of both boys and girls are more than 50% which is alarming the situation. Severe malnutrition may lead to high infant mortality rate (See Table-2).Table 2. Status of Malnourishment in Odisha
State Children Weighed No. of Malnourished Children
Percentage
Odisha Boys Girls Boys Girls Boys Girls 1007504 970474 510450 518038 50.66 53.38 Source:Statistical Abstract of Odisha 2012, PP 398.
A) Basic Amenities of Life:There is a wide gap between rural and urban in households. Urban was ahead in pucca house, improved drinking water, toilet facility, availability of electricity, use of computer or laptop,mobile phones, use of kerosene and LPG as main source of fuel followed by rural area. Only 82.3 percent have improved source of drinking water facility while 91.3 percent people are living in their own house (See Table-3).
Table 3.Household Characteristics in Odisha (in Percentage) SL
No.
Item Total Rural Urban
1 Households living in a pucca House 39.9 33.8 71.0 2 Households living in a Kachcha House 42.4 47.4 17.0 3 Household living in Own house 91.3 96.7 63.2 4 Households living in Rented house 6.6 2.0 30.2 5 Household having improved source of drinking water 82.3 80.9 89.3
6 Access to toilet facility 25.3 16.7 69.7
7 Availability of Electricity 61.9 56.3 91.2
8 Household using Electricity as main source of lighting 51.4 44.2 88.0 9 Household using Kerosene as main source of lighting 47.9 55.1 10.8 10 Household having separate Kitchen 60.2 57.8 72.5 11 Households using firewood/
Cow dung /residues as main source of fuel used for cooking
80.9 89.2 38.3
12 Households using Kerosene as main source of fuel used for cooking
1.1 0.3 5.0
13. Households using LPG/PNG as main source of fuel used for cooking
10.4 3.3 47.1
14 Households having telephone/Mobile 42.6 36.2 75.6 15 Households having computer /Laptop 3.9 2.2 12.7 Source : Annual health Survey2010-11,PP-124-130
92
Source: Statistical Abstract of Odisha 2012 PP-402
Figure 1. Infant Mortality Rate (Person/Thousand)
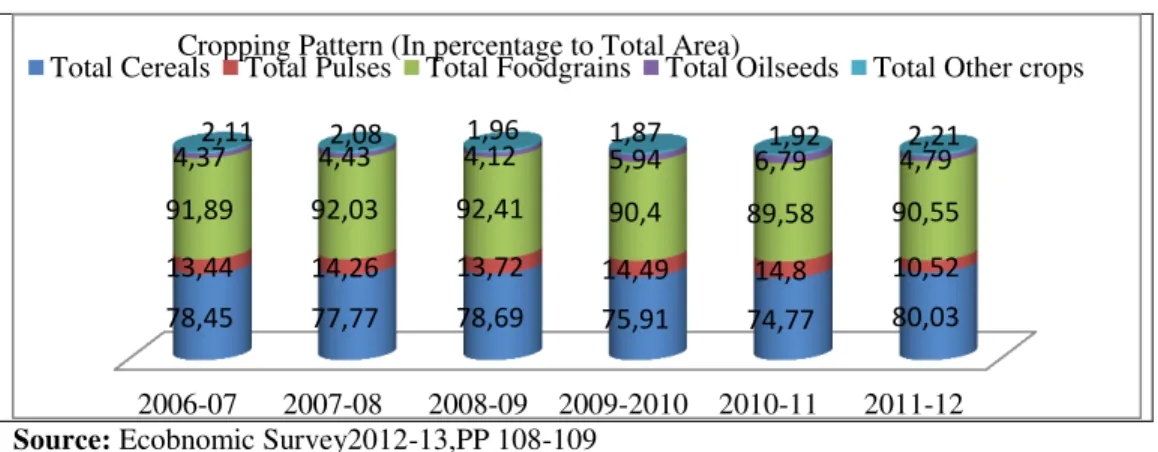
Source: Ecobnomic Survey2012-13,PP 108-109
Figure 2. Cropping Pattern in Odisha (In percentage to Total Area)
Source: Statistical Abstract of Odisha 2012, P-219
Figure 3. Surplus/Deficit of Rice (In Tonnes) 0
50 100
1 2 3 4 5 6 7 8 9 10 11 12
66 63 60
58 58 57 55 53 50
47 44 42
91 87 83
77 75 73 71 69 65 61
57 53
T
o
tal
In
fan
t
Mo
rtality
R
ate(
P
er
so
n
/T
h
o
u
san
d
)
Year: 2001 - 2012 Infant Mortality Rate
Total(India) Total(Odisha)
2006-07 2007-08 2008-09 2009-2010 2010-11 2011-12
78,45 77,77 78,69 75,91 74,77 80,03
13,44 14,26 13,72 14,49 14,8 10,52
91,89 92,03 92,41 90,4 89,58 90,55
4,37 4,43 4,12 5,94 6,79 4,79
2,11 2,08 1,96 1,87 1,92 2,21
Cropping Pattern (In percentage to Total Area)
Total Cereals Total Pulses Total Foodgrains Total Oilseeds Total Other crops
-30 -20 -10 0 10
20 17,09
-22,68
11,5 8,8 12,3 11,2
17,72
9,55 9,82 8,11
-3,05
Su
rp
lu
s/De
fi
ci
t(i
n
T
o
n
n
e
s)
Year
93
Source: Statistical Abstract of Odisha 2012,P-219Figure 4. Surplus/Deficit of Cereals(In Tonnes)
Source: Statistical Abstract of Odisha 2012,P-219
Figure 5. Surplus/Deficit of Pulses in Odisha(In Tonnes)
Source: Statistical Abstract of Odisha 2012,P-219
Figure 6. Surplus/Deficit of Oilseeds in Orissa(In Tonnes) -40 -30 -20 -10 0 10 7,36 -33,03 1,33 -1,08
2,61 1,73 9,92
1,89 1,95 1,22
-10,55 Su rp lu s/De fi ci t(i n T o n n e s) Year
Surplus /Deficit of Cereals(in Tonnes)
Surplus /Deficit -6 -4 -2 0 2 0 0 1 -0 2 2 0 0 2 -0 3 2 0 0 3 -0 4 2 0 4 -0 5 2 0 5 -0 6 2 0 0 6 -0 7 2 0 0 7 -0 8 2 0 0 8 -0 9 2 0 0 9 -1 0 2 0 1 0 -1 1 2 0 1 1 -1 2 -2 ,6 9 -5 ,2 0 -3 ,6 8 -3 ,8 0 -2 ,2 3 -1 ,6 5 -1 ,3 7 -0 ,6 4 -1 ,0 9 -0 ,8 7 -1 ,8 0 Su rp lu s/Def icit( in T o n n es) Year
Surplus /Deficit of Pulses
-16 -15 -14 -13 -12 -11 -13,08 -15,49
-13,99 -13,94 -13,96 -13,73
-13,23 -13,22
-14,34 -14,41 -14,42
Su rp lu s/Def icit o f Oils ee d s( in T o n n es) YEAR
Surplus /Deficit of Oilseeds
94
Figure 7. Percapita Availability of Eggs(Nos/Annum)
Figure 8. Production of Eggs(In Million)
Figure 9. Percapita Availability of Meat(Kg/Annum)
y = 3,544x + 11,731 R² = 0,
0 20 40 60 80
0 5 10 15
P
er
ca
p
ita
A
v
ailab
ilit
y
o
f
eg
g
s(
n
o
s/an
u
m
)
Year : 1999-2000 to 2011-12
Percapita Availability of eggs (Nos/Annum
)
Percapita Availability of eggs (nos/annum
Doğrusal (Percapita Availability of eggs (nos/annum)
y = 156,27x + 332,73 R² = 0,
0 500 1000 1500 2000 2500
0 5 10 15
P
ro
d
u
ctio
n
o
f
eg
g
s(
in
m
illi
o
n
)
Year : 1999-2000 to 2011-12
Production of eggs (in million)
Production of eggs (in million)
Doğrusal (Production of eggs (in million))
y = 0,2113x + 0,3769 R² = 0,
0 0,5 1 1,5 2 2,5 3 3,5
0 5 10 15
P
er
ca
p
ita
av
ailib
ilit
y
o
f
m
ea
t(
k
g
/an
n
u
m
)
Year: 1999-2000 to 2011-12 Percapita availability of meat (Kg/annum)
Percapita availability of meat (Kg/annum
95
Figure 10. Production of Meat(In '000Metric Tonnes)Figure 11. Percapita Availability of Milk (gms/Day)
Figure 12. Production of Milk (In '000 Metric Tonnes) y = 9,2896x + 7,4885
R² = 0,
0 20 40 60 80 100 120 140 160
0 5 10 15
P
ro
d
u
ctio
n
o
f
m
ea
t
('
0
0
0
m
t)
Year: 1999-2000 to 2011-12 Production of meat (in '000 Metric Tonnes)
Production of meat (thousand MT)
Doğrusal (Productio of eat (thousand MT))
y = 4.752x + 59.03 R² =0.
0 20 40 60 80 100 120 140
0 5 10 15
P
erc
ap
it
a
av
ail
ab
il
it
y
o
f
m
il
k
(g
m
s/d
ay
)
Year: 1999-2000 to 2011-12 Percapita Availability of Milk (gms/day)
Percapita Availability of milk (gms/day)
Doğrusal (Percapita Availability of milk (gms/day))
y =84.88x + 705.4 R² =0.
0 500 1000 1500 2000
0 5 10 15
Pro
d
u
cti
o
n
o
f
Mi
lk( '00
0
m
t)
Year: 1999-2000 to 2011-12
Production of milk (in '000 metric tonnes)
Production of milk (thousand MT)
96
Figure 13. Total Fish Production(In Metric Tonnes)
Figure 14. Annual percapita consumption of fish(Kg/Annum)
Figure 15. Production fish in Lakes/Swamps/Bheels(InMT)
y = 9408,3x + 123911 R² = 0,
0 50000 100000 150000 200000 250000
0 5 10 15
T
o
tal
fis
h
P
ro
d
u
ctio
n
(
In
Me
tr
ic
T
o
n
n
es
)
Year: 1999-2000 to 2011-12
Total Fish Production (In Metric Tonnes)
Total Fish Production
Doğrusal (Total Fish Production)
y = 0,2798x + 7,5136 R² = 0,
0 5 10 15
0 5 10 15
A
n
n
u
al
P
er
ca
p
ita
co
n
su
m
p
tio
n
o
f
fis
h
(
In
Kg
.)
Year: 1999-2000 to 2011-12
Annual Per capita Consumption of fish (In Kg./Annum)
Annual Per capita Consumption (In Kg.)
Doğrusal (A ual Per capita Consumption (In Kg.))
y = -146,55x + 3228,1 R² = 0,
0 1000 2000 3000 4000 5000
0 5 10 15
P
ro
d
u
ctio
n
o
f
fis
h
in
L
ak
es/S
w
am
p
s/B
h
ee
ls
(I
n
MT
)
Year: 1999-2000 to 2011-12
Fish Production in Lakes/Swamps/Bheels(In MT)
Fish Production in Lakes/Swamps/Bheels(In MT)
Doğrusal (Fish Production in
97
C) Surplus/Deficit of Production of Crops: Changes in consumption patterns in response to price and income changes could impact on nutrient intake with related positive or negative consequences. Good health enhances the capability of human being to work and participate in socio-economic development. The demand side of the same has been analyzed as follows: The minimum requirement of rice is 400gms per adult per day. Total consumption requirement of rice is going on increasing with increase in population. While calculating the estimates of marketable surplus of rice, 2002-03 is the remarkable year of deficit, which touched the tune of -22.68 tonnes due to severe drought and in the year 2011-12 it was 3.05 tonnes while in all years there was surplus of rice. Paddy is the only crop produced by farmers of some districts in Odisha. The notable thing is that the farmers were suffering from distress sale of paddy. Rice requirement per adult @400gms per day was considered as standard measure(See Figure-3).Paddy is only surplus item in total cereals produced in Odisha. Cereals requirement per adult @500gms per day was considered as standard measure. While calculating estimates of marketable surplus, deficit of cereals occurred in the year 2002-03 by 33.03 tonnes and 10.55 tonnes per one lakh population.There is marginal surplus in cereals production (See Figure-4).
Pulses requirement per adult @50gms per day was considered as standard measure. There is deficit in availability of pulses in Odisha (See Figure-5). During last twelve years 2002-03, 2003-04, 2004-05, 2005-06 experienced more deficits by 5.20, 3.68, 3.80 and 2.23 tonnes per one lakh population. People are less interested for mix cropping.
Oilseeds requirement per adult @45 gms per day was considered as standard measure.The availability of oilseeds is also less in Odisha (See Figure-6).For the last three years namely, 2009-10,2010-11,2011-12 the deficit of oilseed was aggravated andfor the last twelve years oilseed production was negligible.
It has been observed that the farmers in rural areas sell their milk to the open market immediately. So the butter milk available in the rural areas has been decreased continuously. This is an example of another kind of non-availability of balanced diet in rural area. The primary aim was to collect milk from rural areas for supply to cities. Farmers have become only the producer of milk not the consumer which is the main cause of malnutrition of the population of rural India. Further non availability of various kind of leafy vegetables in thegarden or community land is an addition to food insecurity. The term of nutrition security emerged with the recognition of the necessity to include nutritional aspects into food security. Secondary diet includes egg, meat, milk, and fish for consumption purposes.
Livestock Sector plays a pivotal role in rural employment and livelihood. This Sector has the highest potential for rural self-employment generation both for men and women at the lowest possible investment per unit. Rising income and change in habits of the people raise the demand for secondary diet like egg, meat, milk, fish, etc. This portion analyses the production side of Allied sector of agriculture, which is depicted in figures (See Figures-7 to 12). The per capita availability of eggs, meat and milk shows an increasing trend which are at the rate of 3.544(No./annum), 0.211(kg/annum) and 4.752(gm/day) respectively. Similarly the production of eggs, meat and milk shows an increasing trend which are at the rate of 156.2 million,9.289 thousand and 84.88 thousand metric Tons respectively.Thus production of milk, meat and egg are increasing with the increase in per capita availability in Odisha.The government sponsored programme also enhances the consumption of eggs by the people. The primary aim was to collect milk from rural areas for supply to cities. Farmers have become only the producer of milk, not the consumer which is the main cause of mal nutrition of the population of rural India.
98
annum. Fish production in lakes/ swamps/bheels, rivers and canals were decreasing by 146.5 MT and 1263MT per annum respectively. The share of energy supply derived from cereals, roots and tubers as well as the average supply of protein derived from animal sources is an attempt to go beyond cheap sources of calories.
D) Declining traditional sources on nutritional availability:Agriculture is the foundation
of state‟s prosperity and no strategy of economic development can succeed if it does not
ensure rapid growth of production and employment in agriculture. Raising productivity per hectare is the only main instrument to increase production in the food sector. The twin objectives of ensuring adequate food supplies to the growing population and at the same time design a subsidy regime that is fiscally sustainable point to the need to increase productivity of the sector.Per capita consumption of pulses has also steadily declined due to rise in price of pulses.
The fluctuating yield rate has been shown in case of total cereals, total pulses and total food grains. The yield rate of oilseeds is also in declining trend except the year 2011-12. The yield rate of total vegetables, total fibre and tobacco is increasing from the 2006-07 to 2011-12 continuously without any declaration of minimum support price. The yield rate of sugarcane is also fluctuating with the existence of government intervention as cash crops(See Table-4).
Table 4. Average yield of different crops in Odisha under NFSM (National Food Security Mission) Period (Yield rate in Qntls/Hectare)
Year
T
o
tal
ce
rea
ls
T
o
tal
Pu
ls
es
T
o
tal
fo
o
d
g
rain
T
o
tal
Oil
see
d
s
T
o
tal
v
eg
etab
les
T
o
tal
Fib
re
Su
g
ar
ca
n
e
T
o
b
ac
co
T
o
tal
co
n
d
im
en
t
s
&
Sp
ices
2006-07 22.78 7.01 21.24 5.75 95.15 2.68 634.17 7.31 13.65 2007-08 25.15 6.97 23.22 6.49 127.29 3.2 539.5 7.36 13.75 2008-09 22.76 7.62 21.29 6.29 127.81 3.23 600.43 7.44 13.85 2009-10 23.61 6.77 21.67 6.27 132.21 3.29 614.88 7.28 28.18 2010-11 24.12 7.07 22.09 6.24 131.41 3.63 686.88 8.61 29.57 2011-12 21.61 7.51 20.16 7.05 138.62 4.95 610.19 8.35 30.81 Source: Statistical Abstract of Odisha 2012-13
4. Socio-Economic Profile of the Sample Villages
99
Table 5. Age distribution of sample farmers in percentageVillage >18 – 30 years 30 – 45 Years 45- 60Years > 60 Years
Bhoipali 8 21 53 18
Bamphei 12 26 49 13
Sindur Bahal 10 29 55 6
Source: Primary data 2012-13
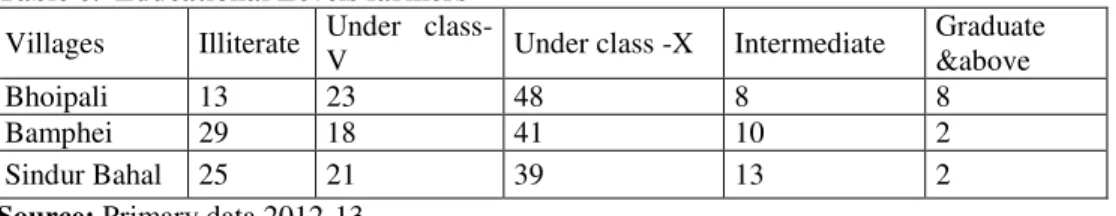
Table 6. Educational Levels farmers
Villages Illiterate Under
class-V Under class -X Intermediate
Graduate &above
Bhoipali 13 23 48 8 8
Bamphei 29 18 41 10 2
Sindur Bahal 25 21 39 13 2
Source: Primary data 2012-13
Land is the fundamental means of production in an agrarian society without which no agricultural production can take place. An understanding of the pattern of ownership and operational holdings of land is, therefore, of central importance to an understanding of the agrarian class structure. Individual operational holding for Scheduled Caste (SC) is lowest(0.50 Acre) in Attabira block in case of marginal farmers followed by Bamra and Bargaon block. Bamra block is lowest (0.61) in Individual operational holding for Scheduled Tribe (ST) followed by Attabira and Bargaon block. Individual operational holding for others are more in all blocks in compare with SC and ST for small, medium and semi medium farmers. But the situation is different for large farmers. Individual ownership for ST is higher in compare with SC farmers in Bargaon and Bamra block whereas individual ownership for SC is higher in compare with ST farmers. Individual ownership for other farmers is higher in compare with SC and ST in Attabira block whereas individual holding for ST farmers is higher than other farmers. Individual holding for all classes is higher in compare with SC and ST farmers(See Table-7).
Table 7.Size of Operational holding of various social groups
Size of Holding in Hactare
Bargaon Bamra Attabira
SC ST Other SC ST Other SC ST Other
In d iv id u al h o ld i ng In d iv id u al h o ld i
ng Ind
iv id u al h o ld i
ng Ind
iv id u al h o ld i ng In d iv id u al h o ld i ng In d iv id u al h o ld i
ng Ind
iv id u al h o ld i ng In d iv id u al h o ld i ng In d iv id u al h o ld i ng
Marginal 0.67 0.67 0.78 0.58 0.61 0.58 0.5 0.65 0.66 Small 1.66 1.65 1.69 1.69 1.74 1.78 1.65 1.72 1.73
Semi-Medium 3.12 2.93 3.04 3.39 3.12 3.25 2.96 3.05 3.16 Medium 5.34 5.67 6.16 7.5 5.56 6.86 4.93 4.93 6.69 Large 0 16.17 13.47 0 20 15.4 13.48 0 18.42 All Classes 1.16 1.06 1.64 1.06 1.05 1.95 0.94 1.16 2.2 Source:http://agcensus.dacnet.nic.in/tehsilT1table5.aspx
100
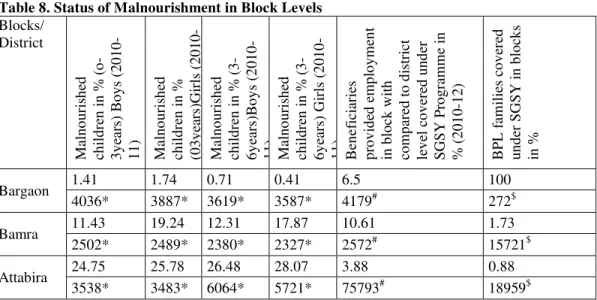
ration costs have been revised upward to Rs. 4/-, Rs. 6/- and Rs. 5/- for normal, mild and moderately malnourished children and pregnant and lactating mothers respectively from the year 2009-10. The SNP has been implemented by 71134 by functional Anganwadi Centre(AWC) covering 46.85 lakh beneficiaries (6 months to 6 years) during 2012-13. Expenditure of Rs.375.22crore has been incurred against the provision of Rs. 546.03 crore. It has been observed that Attabira block (though irrigated and leading agricultural block) experiences highest percentage of malnourished children among the three blocks. In government sponsored poverty alleviation programme, the tribal block Bargaon covered 100 percent below poverty line (BPL) families followed by non-irrigated block Bamra and irrigated block Attabira. Under the Swarna Jayanti Gramin Swarozgar Yojna(SGSY), rural artisans should be covered in a significant manner. Another category would be the unemployed educated youth. Generally, the people who are asset-less and skill-less are poorest of poor and get left out under the programme. Such category of people may require small doses of multiple credits over a period of time coupled with emphasis on awareness creation, training and capacity building so that they will not fall in the debt trap. But it is grave concern that very less percentage of families were covered under SGSY programme in Attabira block in 2010-11(See Table-8).
Table 8. Status of Malnourishment in Block Levels Blocks/ District Ma ln o u ris h ed ch ild ren in % ( o -3 y ea rs ) B o y s (2 0 1 0 -11) Ma ln o u ris h ed ch ild ren in % (0 3 y ea rs )Gir ls ( 2 0 1 0 -Ma ln o u ris h ed ch ild ren in % ( 3 -6 y ea rs )B o y s (2 0 1 0 -11) Ma ln o u ris h ed ch ild ren in % ( 3 -6 y ea rs ) Gir ls ( 2 0 1 0
-11) Ben
ef iciar ies p ro v id ed em p lo y m en t in b lo ck with co m p ar ed to d is tr ict lev el co v er ed u n d er SGSY Pr o g ram m e in % ( 2 0 1 0 -12) B PL fam ilies co v er ed u n d er SGSY in b lo ck s in %
Bargaon 1.41 1.74 0.71 0.41 6.5 100
4036* 3887* 3619* 3587* 4179# 272$
Bamra 11.43 19.24 12.31 17.87 10.61 1.73
2502* 2489* 2380* 2327* 2572# 15721$
Attabira 24.75 25.78 26.48 28.07 3.88 0.88 3538* 3483* 6064* 5721* 75793# 18959$ Source: District Statistical Handbook 2011
Note:„*‟ indicates No, of Children weighed,„#‟ indicates Total No of beneficiaries in district level,„$‟ indicates Total No of BPL families in the block level
101
Table 9. Health Status in District LevelBirth Death Infant Death %of Infant Death Still Birth %of Still Death Maternal Death
% of Maternal Death
Total Total Total Total Total
41109 16704 947 5.67 521 3.12 29 0.17
23159 10024 698 6.96 429 4.28 46 0.46
21942 8873 231 2.6 214 2.41 10 0.11
785524 277484 17808 6.42 12432 4.48 290 0.1 Source : Statistical Abstract of Odisha 2012 PP 371
B) Educational Infrastructure
Education is the only way to change in life of human being. Educational physical infrastructure amplifies the quality of education of a State. The district Bargarh is ahead in Schools having without drinking facilities and boys toilet followed by Sundargarh and Sambalpur where as Sundargarh is ahead in schools having without girls toilet, ramp, play ground, library and boundary wall followed by Bargarh and Sambalpur respectively(See Table-10).
Table 10.Facilities in Government Schools in Odisha(2011-12)
Dis tr ict T o tal No .o f Sch o o ls No .o f Sch o o ls with o u t d rin k in g W ater fac ilit y No . o f Sch o o ls with o u t Bo y s T o ilet No . o f Sch o o ls with o u t G ir ls to ilet No .o f Sch o o ls with o u t Ram p No .o f Sch o o ls with o u t p lay g ro u n d No .o f Sch o o ls with o u t L ib rar y No .o f sch o o ls with o u t b o u n d ry wall
P UP P UP P UP P UP P UP P UP P UP P UP
Sundargarh 1596 819 0 0 1 1 1270 571 734 216 1401 601 1427 607 216 1401
Sambalpur 899 486 0 0 0 0 564 254 509 166 727 333 421 172 166 727
Bargarh 1019 660 8 3 8 3 598 268 531 206 833 456 425 272 206 833
Source: Statistical Abstract of Odisha 2012, P-452
It has been observed that Sundargarh district was highest (68.2%) households living in Kuchha house followed by Bargarh(54.5%) and Sambalpur (54.4%) respectively in rural area. But in state level 47.4% households are living in rural areas whereas 71% households are living in urban areas. If someone look into the households living in Pucca house in rural areas, Bargarh was highest (31.9%) followed by Sambalpur (28.8%) and Sundargarh (12.6%) respectively( See Table-11).
Table 11. Housing Structure of house Housing Characteristics-Structure of house
Households living in a pucca house (%) Households living in a Kachcha house (%) Total Rural Urban Total Rural Urban
State (Odisha) 39,9 33,8 71 42,4 47,4 17
102
Figure 16. Fish Production from Rivers and Canals(In MT)
Source: Atlas on Houses, Household Amenities and Assets,Odisha 2011,P-11
Figure 17. Main Source of Lighting in Villages of Sample Districts in Percentage
Source: Statistical Abstract of Odisha,2012,p-404
Figure 18: Main Source of Drinking Water in Sample Districts Rural (In Percent) y = -1263,4x + 23893
R² = 0,
0 5000 10000 15000 20000 25000
0
5
10
15
F
ish
p
ro
d
u
cti
o
n
in
Riv
ers
an
d
Ca
n
als(In
M
T
)
Year: 1999-2000 to 2011-12 Fish Prodution inRivers/Canals
Rivers/Canals
7
4
,4
4
7
,2
5
0
,7
0
,8 1,3
9
1
,8
5
0
,8
4
7
,9
0
,3 1
9
2
,8
4
4
,7
5
4
,2
0
,4 0,7
% of villages elecrified
% of households using Electricity
% of households using Kerosene
% of households using no lighting
Status of main source of lighting in villages of Sample districts
Sundargarh Sambalpur Bargarh
5,0 2,6
24,3 35,3
64,7
54,4
6,0 7,8
8,5 2,2
21,8 34,6
65,1
54,2
4,6 9,0
15
4,3 6,8 11,4
75,9 79,1
2,2 5,3
Main source of Drinking Water ,Odisha(Rural)
103
Figure 19. Reason of food Insecurity, Source: Primary Survey 2012-13The villages in Sundargarh district is lowest percentage of electrification followed by Sambalpur and Bargarh district respectively. But Bargarh district secure the lowest position in percentages of household electrified followed by Sundargarh and Sambalpur respectively.Percentage of household using kerosene as the main source of lighting is highest in Bargarh followed by Sundargarh and Sambalpur respectively(See Figure-17).
Tape water increased from 2001 to 2011 in all sample districts whereas handpump water decreased in Bargarh district in compare with Sundargarh and Sambalpur district from 2001 to 2011 census. Well water use also decreased from 2001 to 2011 census in all sample districts(See Figure-18)
Structural food and nutrition insecurity is categorized as long-term and persistent. It occurs when people are unable to meet their minimum energy and micronutrient
requirements over a sustained period of time, or when issues affecting people‟s utilization of
food and nutritional outcomes (e.g. knowledge and caring capacity, access to safe water, sanitation, health care, etc.) are persistent. Structural food insecurity is often the result of extended periods of poverty, lack of assets and inadequate access to productive or financial resources. Structural nutrition insecurity can stem from issues ranging from gender discrimination to poor infrastructure. The present paper is an attempt to find out reason of food insecurity and coping strategy adopted during food insecurity period.
C) Period and Reason of food Security: It is evident that the people very often suffer from food crises from the month of April to September. Reason of food insecurity is different for different farmers. Bad harvest is common to all types of farmers. The variation in the weather parameters i.e. rainfall during or after harvest of the crop makes irreparable loss on the quantity or quality of the crops. Seasonal variation is also depending on weather parameter like irregular rainfall; sunshine hours, temperature, humidity etc. were noticed to affect the yield of crops during Kharif season. But the effect of seasonal variation was not proper impact on farmers of Sindurbahal village due to irrigation facilities. But they are also affected indirectly due to canal irrigation. They are getting water earlier than the tail area of the Hirakud dam command area. Reaping crops is early at Sindurbahal in compare to the tail area. The farmers of Sindurbahal are facing problem in cutting of crops and its rotation.
45
33,33 29,67 33,00
20,67
72,33
62,00
104
But this problem was not felt in case of Bhoipali or Bamphei. The large farmers were using lift irrigation at their own cost.So rotation of crops, mixed cropping also possible in these villages. Dry spell is also another aspect of weather condition. Except Sindurbahal other two villages are suffering from dry spell due to lack of irrigation facilities. The problem of pest and diseases was not much affected in Bhoipali and Bamphei in compared with Sindurbahal. Canal Irrigation, planting of hybrid seeds, monoculture were the main cause of pest and diseases in Sindurbahal. The farmers of Bamphei and Bhoipali were not bothered to protect their crop even if these attacked in minor forms due to lack of money to acquire plant protection equipments and pesticides. The farmers of Sindurbahal suffered from duplicate pesticides and insecticides, weedicides etc. The farmers of Bamphei and Bhoipali were using their traditional herbal method. During pre- harvest problems, after production and before consumption food grains are subjected to several adverse physical and chemical factors as well as microbial and parasitic agents, which cause their spoilage or lead to diseases when consumed. Some processing, preservation and storage are treated as post –harvest problem(See Figure-19).
Table 12. Coping Strategies during food insecurity SL
No Statements
Pearson
Chi Square d. f. P Value
Remark
(α=0.05) 1 Access to credit
institution 9.028 2 0.011* Reject Ho
2 Sharing of food with relations/neighbours 20.819 2 0* Reject Ho
3 Borrowing of money/Food 1.439 2 0.487** Accept Ho
4 Selling of goods and other personal assets 2.151 2 0.341** Accept Ho
5 Non-farm employment (migration to search
work and food) 13.516 2 0.001* Reject Ho
6 Resource management studies like proper
time ,labour and food allocation activities 10.465 2 0.005* Reject Ho
7 Change in food consumption pattern 9.28 2 0.010* Reject Ho
8 Help from local organisation 5.289 2 0.071** Accept Ho
9 Participation in feeding programme
self/children/family 28.892 2 0* Reject Ho
10 Mortgage 0.355 2 0.838** Accept
Ho
11 Use of livestock saving 3.041 2 0.219** Accept Ho
12 Purchase and store of food when income is
high 11.16 2 0.004* Reject Ho
13
Substitutes of less employment
commodities and shift to alternative food sources
105
14 Access to subsidized foods 18.76 2 0* Reject Ho Source: Primary data 2012-13Note:* Significant, ** Insignificant
D) Coping Strategies during food insecurity: The concept of coping strategies is used to mean any action aimed at obtaining food or income during times of stress, either through production or through formal and informal exchange and claims (Ragassa,2011).
The reward of nature, through the common property resources, forests etc. comes to the rescue of the rural people. Fish, snails and water weeds collected from water bodies partially fulfils the nutritional requirement due to decline in consumption of pulses. Collection of fruits and various leafs and flowers are supplemented as diet to overcome nutritional security. With the absence of all these, the principal food system as well as the secondary food system declined substantially. All the above, the household suffer from access to food from common property gradually due to climate change and contaminated water bodies. The range of food baskets is going on declining day by day. Households use a number of coping strategies ranging from one or more principal coping strategies to various complementary strategies; switching between principal and complementary activities during chronic food shortage. A principal coping strategy is characterized by providing a main source of food and income for a household, substituting for farming which is relatively regular and reliable, while complementary coping strategies are opportunistic and often irregular, providing some food or income for shorter time periods.
The following discussion highlights the different coping strategies adopted by different group of farmers in different time,based on the respondents positive or negative responses with respect to attributes mentioned in each statements.The following hypotheses are set :
Null Hypothesis (Ho) : There exists no significant difference in responses among the three villages with respect to Coping Strategy.
Null Hypothesis (H1) : There exists significant difference in responses among the three villages with respect to Coping Strategy.
Pearson Chisquare test has been conducted to test the possible rejection of the Null hypothesisand the following inferences regarding the coping strategy has been drawn(See Table-12):
i) Access to credit institutions: There has been a significant difference among the three sample villages with regard to credit institutions. This means the people of irrigated area like Sindurbahal have more access to credit institutions in compare with Bamphei and Bhoi Pali.
ii) Sharing of food with relations/neighbours: There has been a significant difference among the three sample villages with regard to Sharing of food with relations/neighbours. Thus it may be deduced that the people of non irrigated area like Bamphei and a tribal village like Bhoi Pali have more shairing of food with relations/neighbours in compare with and Sindurbahal.
iii) Non-farm employment (migration in search of work and food): There has been a significant difference among the three sample villages with regard to Non-farm employment (migration in search of work and food). Thus it may be argued that the people of non irrigated area like Bamphei and a tribal village like Bhoi Pali have more non-farm employment (migration in search of work and food) in compare with and Sindurbahal.
106
for all the sample villages but varies with regard to proper time, labour and food allocation activities. For example non irrigated village and tribal village require more labour utilization in lean season. At the same time food allocation activities are required for the life cycle of a human being with respect to different time.
v) Change in food consumption pattern: The three sample villages differ significantly with regard to change in food consumption pattern which means that the people of irrigated area have changed their dietary need. They opt secondary diet like egg, meat, fish etc. Further, due to diabetes, blood pressure and obesity the people have shifted their food habits from consumption of rice to consumption of wheat.
vi) Participation in feeding programme self/children/family: There has been a significant difference among the three sample villages with regard to Participation in feeding
programme .The people of irrigated area don‟t prefer to send their ward to Govt. schools
where mid day meal programme draw the attention of parents and pupils for increasing regular attendance, retention by decreasing drop outs. Rather they prefer to send to public school for better learning.
vii) Purchase and store of food when income is high : There has been a significant difference among the three sample villages with regard to purchase and store of food when income is high. The medium and small farmers also sell their products immediately after harvesting at minimum support price and prefer to purchase and store food grains having high nutritious value, cultivated in single cropped area for the whole year.
viii) Access to subsidized foods: The three sample villages exhibit a significant difference in access to subsidized foods. It is observed that even though poor, a group of people of Bhoi Pali (a small hamlet) have no access to subsidized food due to non availability of ration card. They have been deprived of subsidized food programme through PDS. They are daily wage earners and work from morning to evening which is matching to the official time.
On the other hand the three samples may be considered to be identical with regard to the coping strategies adopted such as borrowing of money/food, selling of goods and other personal assets, help from local organization, mortgage, use of livestock saving, substitutes of less employment commodities and shift to alternative food sources. Therefore the study progresses to know the regional differences in yield.
It is observed that Bargarh district is ahead in total cereals followed by Sundargarh and Sambalpur. Sundargarh district is first position in total pulses followed by Sambalpur and Bargarh. It has been seen that Bargarh district leads in yield of food grains, sugarcane and condiments and spices.Sundargarh district is ahead in yield of total fibre and vegetables. No district has been achieved average yield percentage in condiments and spices at par with that of Odisha. Kitchen garden system has been abolished. All these explanations are linked with the supply side of different agricultural products (See Table-13).
Table 13. Average yield of different crops in three selected Districts of Odisha in the year 2011-12
District Total cereals
Total Pulses
Total food grain
Total Oil seeds
Total vegetables
Total Fibre
Sugarcane Total condiments & Spices Sundargarh 26.28 28.66 26.35 5.91 140.47 11.98 542.29 20.74
107
In the same way, forests are a major source of livelihood for the self employed poor, whether they are cultivators, livestock rearers or tribal forest dwellers. But this forest cover is very rapidly depleting denying the self employed the income generating resources. Vegetables also hold a greater promise for agricultural development on account of its labour-intensive nature. Transmission losses are generally high for horticulture commodities because of inadequate infrastructure and market information.Livestock output in India, is growing faster than any other agricultural sub-sector. The small and marginal farms in the country are more livestock-centric. The possibility of competition for scarce land has increased with the deterioration of common resources in the country. The pressure on availability of fodder is also on account of deterioration in the quality of crop residue with the increased application of pesticides for crops. The livestock population has been decreasing in the recent period.
Committing suicide by farmers, decreasing fertility of the soil, reducing productivity of the crop, hazardous pollution of the soil ,water and air , decreasing taste and nutritive value of the produce, reducing bio-diversity, farmers being poorer every day and committing suicide due to debt have created a very alarming situation. Thus there is a dire need to research a new farming system, technologies and management. (Pandey, 2015)
Not only increase in population, the reducing area under cultivation, will also cause food shortage and unemployment among the farmers. The poor people are not endowed with village level opportunities like fire hood collection, growing self required vegetables, grazing cattle and other amenities at free of cost or at village level rates. They need to buy everything with net cash. Diversification is measured with concentration ratio, therefore their food security is at extreme risk.
6. Conclusion:
The most important issue concerning agriculture is lack of nutrients in soil and its products, recycling use of agricultural waste within agriculture and its allied sector, proper land utilisation system and result oriented Government sponsored programmes and schemes. The scientists should be entrusted to ensure that not only the productivity of Indian agriculture rises but also the cultivator becomes affluent, and has more money in his pocket. Soil, water, seed, manure, pesticide, rural roads, soil testing labs, power supply, internet connectivity, marketing technique and weather forecast were put in place before embarking on the grand mission. Agricultural output needs a major boost in order to tackle hunger.
Farmers‟ insecurity got converted into food insecurity for the nation. Prices of wheat, rice, pulses, edible oils, vegetables etc. all sky rocketed. Worst sufferer is the poor. To make available food to the masses at the reasonable prices, we need to maintain reasonable level of buffer stock, which in turn could be ensured by making sufficient procurement. This paper concludes with the following implications:
108
References:Compbell, C. (1991). Food Insecurity: A nutritional outcome or a predictor variable? , NY 14853-4410, The Journal of Nutrition,121(3) 408-15.
Jamiullah,M.(2014). Nuakhai-then and now, Sociocrat, 8-9.
Kausal, N. (2011, 04 29). India's child malnutrition puzzle. Economic Times . New Delhi, New Delhi, India.
Nandakumar, T.,Ganguly,K.,Sharma,P.&Gulati,A. (2010, November). Food and Nutrition Security Status in India:Opportunities for Investment Partnerships. ADB
SustainableDevelopmentWorking Paper Series . 1550 Metro Manila, Philippines: Asian
Development Bank.
Pandey, R. (2015, August 23). Re-establishment of Indian Agriculture. Special focus . NewDelhi, New Delhi, India.
Pangaribowo, E.H., Gerber, N. & Torero, M. (2013). Food and nutrition security indicators: A review.Working Paper 108.Bonn, Germany. Center for Development Research, University of Bonn,Germany.
Ragassa, N. (2011). Small holder farmers coping strategies to household food insecurity and hunger in. Ethiopian Journal of Environmental Studies and Management, 4 (1), 43. Ramachandran, P. (2013, September). Food & nutrition security: Challenges in the new
millennium. Indian Journal of Medical Research , 373-382.
Santeramo, F. (2014, November). On the Composite Indicators for Food Security: Decisions Matter! MPRA Paper No. 58955, Retrived fromhttp://mpra.ub.unimuenchen.de/58955/ Santeramo,F.G. & Nadia,S.(2015).The income -elasticity of calories,macro and micro
nutrients:What is the literature telling us?MPRA Paper No.63754.Retrived from http://mpra.ub.uni-muenchen.de/63754.
Sidhu, R. V.,Kaur,I.&Vatta,K. (2008). Food and Nutritional Insecurity and its Determinants in Food Surplus. Agricultural Economics Research Review, 21, 91-98.
Notes:
1.„Nua Khai‟ is such a food festival that nobody be
comes underfed on this day.The festival “Nua Khai” is observed by the people in the month of September (Bhadraba in Odia Calender) where farmers even the animals and birds face difficulty to get their food.The
people of Western Odisha give the “Prasad” prepared by new rice (Cultivated in Aatt) to their Adhistatri Devi/ Esta Devi of the locality. They believe that God (Adhistatri Devi/ Esta Devi ) will not deprive them to get food throughout the year.
2.„Cher
-Chera‟ deals with food distribution among „haves‟ and „have nots‟.
3.‟
Pausa-Purnima‟ is only food festival where no deity is worshipped. The concept „Man
is God.‟ is true in this sense. People only take varieties of dishes after harvest.
4.„Saria Dhan‟ is a short period paddy variety is harvested during early autumn.
5.„