DOI 10.1140/epjc/s10052-012-2164-1 Regular Article - Experimental Physics
Study of the inclusive production of charged pions, kaons,
and protons in pp collisions at
√
s
=
0.9,
2.76,
and 7 TeV
The CMS Collaboration∗
CERN, Geneva, Switzerland
Received: 19 July 2012 / Revised: 5 September 2012 / Published online: 3 October 2012
© CERN for the benefit of the CMS collaboration 2012. This article is published with open access at Springerlink.com
Abstract Spectra of identified charged hadrons are
mea-sured in pp collisions at the LHC for √s=0.9,2.76, and 7 TeV. Charged pions, kaons, and protons in the transverse-momentum range pT≈0.1–1.7 GeV/c and for rapidities |y|<1 are identified via their energy loss in the CMS silicon tracker. The averagepTincreases rapidly with the mass of the hadron and the event charged-particle multiplicity, inde-pendently of the center-of-mass energy. The fully corrected pT spectra and integrated yields are compared to various tunes of the PYTHIA6 and PYTHIA8 event generators.
1 Introduction
The study of hadron production has a long history in high-energy particle and nuclear physics, as well as cosmic-ray physics. The absolute yields and the transverse momentum (pT) spectra of identified hadrons in high-energy hadron-hadron collisions are among the basic physical observables that can be used to test the predictions for non-perturbative quantum chromodynamics processes like hadronization and soft parton interactions, and their implementation in Monte Carlo (MC) event generators. The dependence of these quantities on the hardness of the pp collision provides valu-able information on multi-parton interactions as well as on other final-state effects. In addition, the measurements of baryon (and notably proton) production are not reproduced by the existing models, and more data at higher energy may help improving the models. Spectra of identified particles in proton-proton (pp) collisions also constitute an important reference for high-energy heavy-ion studies, where final-state effects are known to modify the spectral shape and yields of different hadron species.
The present analysis focuses on the measurement of the pT spectra of charged hadrons, identified mostly via their
∗e-mail:[email protected]
energy deposits in silicon detectors, in pp collisions at√s= 0.9,2.76, and 7 TeV. In certain phase space regions, parti-cles can be identified unambiguously while in other regions the energy loss measurements provide less discrimination power and more sophisticated methods are necessary.
This paper is organized as follows. The Compact Muon Solenoid (CMS) detector, operating at the Large Hadron Collider (LHC), is described in Sect.2. Elements of the data analysis, such as event selection, tracking of charged parti-cles, identification of interaction vertices, and treatment of secondary particles are discussed in Sect.3. The applied en-ergy loss parametrization, the estimation of enen-ergy deposits in the silicon, and the calculation of the energy loss rate of tracks are explained in Sect. 4. In Sect. 5 the various as-pects of the unfolding of particle yields are described. After a detailed discussion of the applied corrections (Sect.6), the final results are shown in Sect.7and summarized in the con-clusions.
2 The CMS detector
The central feature of the CMS apparatus is a superconduct-ing solenoid of 6 m internal diameter. Within the field vol-ume are the silicon pixel and strip tracker, the crystal elec-tromagnetic calorimeter, and the brass/scintillator hadron calorimeter. In addition to the barrel and endcap detec-tors, CMS has extensive forward calorimetry. CMS uses a right-handed coordinate system, with the origin at the nominal interaction point and thezaxis along the counter-clockwise beam direction. The pseudorapidity and rapidity of a particle with energy E, momentum p, and momen-tum along thez axis pz are defined asη= −ln tan(θ/2)
whereθ is the polar angle with respect to the z axis and y=12ln[(E+pz)/(E−pz)], respectively. A more detailed
Two elements of the CMS detector monitoring system, the beam scintillator counters (BSCs) and the beam pick-up timing for the experiments (BPTX) devices, were used to trigger the detector readout. The two BSCs are located at a distance of±10.86 m from the nominal interaction point (IP) and are sensitive to particles in the|η|range from 3.23 to 4.65. Each BSC is a set of 16 scintillator tiles. The BSC elements are designed to provide hit and coincidence rates. The two BPTX devices, located around the beam pipe at a distance of 175 m from the IP on either side, are designed to provide precise information on the bunch structure and timing of the incoming beam. A steel/quartz-fibre forward calorimeter (HF) covers the region of|η|between about 3.0 and 5.0. The HF tower segmentation inηand azimuthal an-gleφ is 0.175×0.175, except for|η|above 4.7 where the segmentation is 0.175×0.35.
The tracker measures charged particles within the pseu-dorapidity range |η|<2.4. It has 1440 silicon pixel and 15 148 silicon strip detector modules and is located in the 3.8 T field of the solenoid. The pixel detector [3] consists of three barrel layers (PXB) at radii of 4.4, 7.3, and 10.2 cm as well as two endcap disks (PXF) on each side of the PXB. The detector units are segmented n-on-n silicon sensors of 285 µm thickness. Each readout chip serves a 52×80 ar-ray of 150 µm×100 µm pixels. In the data acquisition sys-tem, zero suppression is performed with adjustable thresh-olds for each pixel. Offline, pixel clusters are formed from adjacent pixels, including both side-by-side and corner-by-corner adjacent pixels. The strip tracker [4] employs p-in-n silicon wafers. It is partitioned into different substructures: the tracker inner barrel (TIB) and the tracker inner disks (TID) are the innermost part with 320 µm thick sensors, sur-rounded by the tracker outer barrel (TOB) with 500 µm thick sensors. On both sides, the tracker is completed by end-caps with a mixture of 320 µm thick sensors (TEC3) and 500 µm thick sensors (TEC5). The first two layers of TIB and TOB and some of the TID and TEC contain “stereo” modules: two silicon modules mounted back-to-back with a 100 mrad angle to provide two-dimensional hit resolution. Each readout chip serves 128 strips. Algorithms are run in the Front-End Drivers (FED) to perform pedestal subtrac-tion, common-mode subtraction and zero suppression. Only a small fraction of the channels are read out in one event. Of-fline, clusters are formed by combining contiguous hits. The tracker provides an impact-parameter resolution of∼15 µm and an absolutepT resolution of about 0.02 GeV/cin the rangepT≈0.1–2 GeV/c, of relevance here.
2.1 Particle identification capabilities
The identification of charged particles is often based on the relationship between energy loss rate and total momen-tum (Fig. 1a). Particle reconstruction at CMS is limited
Fig. 1 (a) Values of the most probable energy loss rateε, at the ref-erence path length of 450 µm in silicon, for electrons, pions, kaons and protons [2]. Theinsetshows the region 1< p <5 GeV/c. (b) For each particle, the accessible(y, pT)area is contained between the up-per thicker(determined by particle identification capabilities) and the
lower thinner lines(determined by acceptance and efficiency). More details are given in Sect.2.1
by the acceptance (Ca) of the tracker (|η|<2.4) and by
the low tracking efficiency (Ce) at low momentum (p >
3 Data analysis
The 0.9 and 7 TeV data were taken during the initial low multiple-interaction rate (low “pileup”) runs in early 2010, while the 2.76 TeV data were collected in early 2011. The requirement of similar amounts of produced particles at the three center-of-mass energies and that of small average num-ber of pileup interactions led to 8.80, 6.74 and 6.20 mil-lion events for √s=0.9 TeV, 2.76 TeV, and 7 TeV, re-spectively. The corresponding integrated luminosities are 0.227±0.024 nb−1, 0.143 ±0.008 nb−1 and 0.115 ± 0.005 nb−1[5,6], respectively.
3.1 Event selection and related corrections
The event selection consists of the following requirements: – at the trigger level, the coincidence of signals from both
BPTX devices, indicating the presence of both proton bunches crossing the interaction point, along with the presence of signals from either of the BSCs;
– offline, the presence of at least one tower with energy above 3 GeV in each of the HF calorimeters; at least one reconstructed interaction vertex (Sect.3.3); the suppres-sion of beam-halo and beam-induced background events, which usually produce an anomalously large number of pixel hits [7].
The efficiencies for event selection, tracking, and ver-texing were evaluated by means of simulated event sam-ples produced with the PYTHIA6.420 [8] MC event gener-ator at each of the three center-of-mass energies. The events were reconstructed in the same way as the collision data. The PYTHIAtunes D6T [9], Z1, and Z2 [10] were chosen, since they describe the measured event properties reason-ably well, notreason-ably the reconstructed track multiplicity distri-bution. Tune D6T is a pre-LHC tune with virtuality-ordered showers using the CTEQ6L parton distribution functions (PDF). The tunes Z1 and Z2 are based on the early LHC data and generate pT-ordered showers using the CTEQ5L and CTEQ6L PDFs, respectively.
The final results were corrected to a particle level selec-tion, which is very similar to the actual selection described above: at least one particle (τ >10−18s) withE >3 GeV in the range−5< η <−3 and one in the range 3< η <5; this selection is referred to in the following as “double-sided” (DS) selection. The overall efficiency of the DS selection for a zero-bias sample, according to PYTHIA, is about 66– 72 % (0.9 TeV), 70–76 % (2.76 TeV), and 73–78 % (7 TeV). The ranges given represent the spread of the predictions of the different tunes. Mostly non-diffractive (ND) events are selected, with efficiencies in the 88–98 % range, but a smaller fraction of double-diffractive (DD) events (32– 38 %), and single-diffractive dissociation (SD) events are
accepted (13–26 %) as well. About 90 % of the selected events are ND, while the rest are DD or SD, in about equal measure. In order to compare to measurements with a non-single-diffractive (NSD) selection, the particle yields given in this study should be divided by factors of 0.86, 0.89, and 0.91 according to PYTHIA, for√s=0.9,2.76,and 7 TeV, respectively. The systematic uncertainty on these numbers due to the tune dependence is about 3 %.
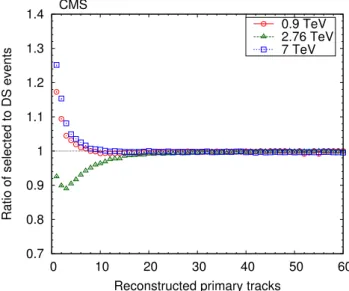
The ratios of the data selection efficiency to the DS selec-tion efficiency are shown as a funcselec-tion of the reconstructed track multiplicity in Fig.2for the three center-of-mass en-ergies studied. The ratios are used to correct the measured events; they are approximately independent of the PYTHIA tune. The different behavior of the 2.76 TeV data results from a change in the HF configuration in 2011. The results are also corrected for the fraction of DS events without a re-constructed track. This fraction, as given by the simulation, is about 4 %, 3 %, and 2.5 % for 0.9, 2.76, and 7 TeV, re-spectively. Since these events do not contain reconstructed tracks, only the event yield must be corrected.
3.2 Tracking of charged particles
The extrapolation of particle spectra into the unmeasured re-gions is model dependent, particularly at low pT. A good measurement therefore requires reliable track reconstruction down to the lowest possiblepT. The present analysis ex-tends topT≈0.1 GeV/cby exploiting special tracking al-gorithms [11], used in previous studies [7,12], to provide high reconstruction efficiency and low background rate. The charged pion hypothesis was assumed when fitting particle momenta.
The performance of the charged-particle tracking was quantified in terms of the geometrical acceptance, the track-ing efficiency, and the fraction of misreconstructed tracks; all these quantities were evaluated by means of simulated events and validated in previous studies [7,12]. The accep-tance of the tracker (when at least two pixel hits are required) is flat in the region −2 < η <2 and pT >0.4 GeV/c, and its value is about 96–98 %. The loss of acceptance atpT<0.4 GeV/cis caused by energy loss and multiple scattering of particles, which both depend on the particle mass. Likewise, the reconstruction efficiency is about 80– 90 %, degrading at lowpT, also in a mass-dependent way. The misreconstructed-track rate (Cf) is very small,
reach-ing 0.3 % only forpT<0.25 GeV/c; it rises slightly above 2 GeV/cbecause of the steeply fallingpTdistribution. The probability of reconstructing multiple tracks (Cm) from a
true single track is about 0.1 %—mostly due to particles spiralling in the strong magnetic field. The efficiencies and background rates largely factorize inηandpT, but for the final corrections an(η, pT)grid is used.
3.3 Vertexing and secondary particles
The region where pp collisions occur (beam spot) is well measured by reconstructing vertices from many events. Since the bunches are very narrow, the transverse position of the interaction vertices is well constrained; conversely, their z coordinates are spread over a relatively long dis-tance and must be determined on an event-by-event basis. Reconstructed tracks are used for determining the vertex position if they have pT>0.1 GeV/cand originate from the vicinity of the beam spot, i.e. their transverse impact parameter satisfies the conditiondT <3σT; hereσT is the
quadratic sum of the uncertainty ofdT and the RMS of the
beam spot distribution in the transverse plane. The agglom-erative vertex-reconstruction algorithm [13] was used, with thezcoordinates (and their uncertainty) of the tracks at the point of closest approach to the beam axis as input. This algorithm keeps clustering tracks into vertices as long as the smallest distance between the vertices of the remaining groups of tracks, divided by its uncertainty, is below 35. Simulations indicate that this value minimizes the number of merged vertices (vertices with tracks from two or more true vertices) and split vertices (two or more vertices with tracks from a single true vertex). For single-vertex events, there is no lower limit on the number of tracks associated to the vertex. If multiple vertices are present, only those with at least three tracks are kept.
The distribution of thezcoordinates of the reconstructed primary vertices is Gaussian, with standard deviations of 6 cm at 0.9 and 2.76 TeV, and 3 cm at 7 TeV. The simu-lated data were reweighted so as to have the same vertexz coordinate distributions as the data. The distribution of the
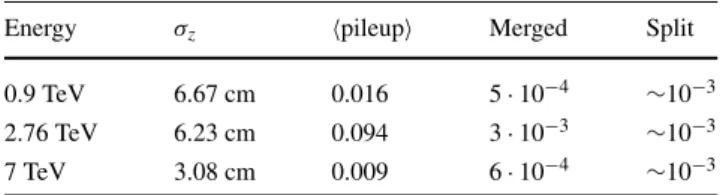
Table 1 Standard deviation of the vertexzcoordinate distribution (σz)
and average number of pileup events for the three center-of-mass en-ergies studied. The last two columns show the estimated fraction of merged and split vertices. More details are given in the text
Energy σz pileup Merged Split
0.9 TeV 6.67 cm 0.016 5·10−4 ∼10−3
2.76 TeV 6.23 cm 0.094 3·10−3 ∼10−3 7 TeV 3.08 cm 0.009 6·10−4 ∼10−3
distance zbetween vertices was used to quantify the effect of pileup and the quality of vertex reconstruction. There is an empty region around z=0, which corresponds to cases in which two true vertices are closer than about 0.4 cm to each other and are merged during vertex reconstruction. The z distribution was therefore used to determine the fraction of merged (and thus lost) vertices, and to estimate the fraction of split vertices (via the non-Gaussian tails). Both effects are at the 0.1 % level and were neglected in this study.
The number of primary vertices in a bunch crossing fol-lows a Poisson distribution. The fraction of events with more than one vertex (due to pileup) is small in the 0.9 and 7 TeV data (1.6 % and 0.9 %, respectively), but is 9.4 % at 2.76 TeV. The interaction-region and pileup parameters are summarized in Table1. For the 0.9 and 2.76 TeV data, bunch crossings with either one or two reconstructed vertices were used, while for the 7 TeV data the analysis was restricted to events with a single reconstructed vertex to suppress the larger background from pileup, split and merged vertices.
The hadron spectra were corrected for particles of non-primary origin. The main source of secondary particles is the feed-down from weakly decaying particles, mostly K0S, Λ/Λ, andΣ+/Σ−. While the correction (Cs) is around 1 %
for pions, it is up to 15 % for protons withpT≈0.2 GeV/c. This is expected because the daughter p or p takes most of the momentum of the primary Λ/Λ, and therefore has a higher probability of being (mistakenly) fitted to the pri-mary vertex than a pion from a K0Sdecay. Since none of the weakly decaying particles mentioned decay into kaons, the correction for kaons is small. The corrections were derived from PYTHIAand cross-checked with data [14] by compar-ing measured and predicted spectra of particles. While data and simulation generally agree, theΛ/Λcorrection had to be multiplied by a factor of 1.6.
For p <0.15 GeV/c, electrons can be clearly identi-fied. According to PYTHIA, the overall e±contamination of
4 Energy deposits and estimation of energy loss rate
The silicon layers of the tracker are thin and the energy de-positions do not follow a Gaussian distribution, but exhibit a long tail at high values. Ideally, the estimates of the energy loss rate should not depend on the path lengths of the track through the sensitive parts of the silicon or on the detector details. However this is not the case with the often used trun-cated, power, or weighted means of the differential deposits, E/ x. Some of the dependence on the path length can be corrected for, but a method based on the proper knowledge of the underlying physical processes is preferable.
In the present paper a novel analytical parametriza-tion [15] has been used to approximate the energy loss of charged particles. The method provides the probability den-sityp(y|ε, l)of energy deposity, if the most probable en-ergy loss rateε at a reference path-lengthl0 and the path-lengthlare known. The method can be used in conjunction with a maximum likelihood estimation. The deposited en-ergy is estimated from the measured charge deposits in indi-vidual channels (pixels or strips) contributing to hit clusters. Deposits below the readout threshold or above the satura-tion level of the readout electronics are estimated from the length of the track segment in the silicon. This results in a wider accessible energy deposit range and better particle identification power. The method can be applied to the en-ergy loss rate estimation of tracks and to calibrate the gain of the tracker detector front-end electronics. In this analysis, for each track, the estimated ε value at l0=450 µm was used for particle identification and yield determination.
For pixel clusters, the energy deposits (and their vari-ances) were calculated as the sum of individual pixel de-posits (and variances). The noise contribution is Gaussian, with a standard deviation σn≈10 keV per pixel. In the
case of strips, the energy deposits were corrected for ca-pacitive coupling and cross-talk between neighboring strips. The readout thresholdt, the coupling parameterαc, and the
standard deviationσn of the Gaussian noise for strips were
determined from the data, by means of tracks with close-to-normal incidence (Table2).
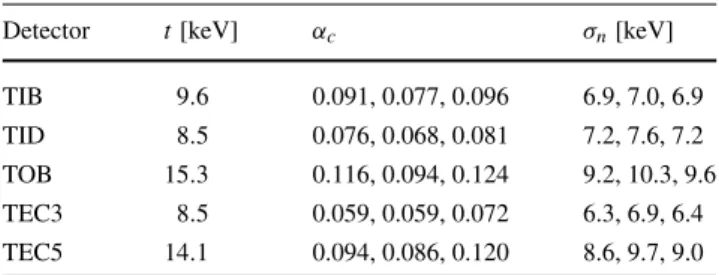
Table 2 Properties of several strip subdetectors evaluated by using hits on tracks with close-to-normal incidence: readout thresholdt, coupling parameterαc, standard deviationσnof the Gaussian noise. The three
values given forαcandσnare for the 0.9, 2.76, and 7 TeV datasets
Detector t[keV] αc σn[keV]
TIB 9.6 0.091, 0.077, 0.096 6.9, 7.0, 6.9 TID 8.5 0.076, 0.068, 0.081 7.2, 7.6, 7.2 TOB 15.3 0.116, 0.094, 0.124 9.2, 10.3, 9.6 TEC3 8.5 0.059, 0.059, 0.072 6.3, 6.9, 6.4 TEC5 14.1 0.094, 0.086, 0.120 8.6, 9.7, 9.0
4.1 Detector gain calibration with tracks
For an accurate determination ofε, it is crucial to calibrate the response of all readout chips. It is also important to com-pare the measured energy deposit spectra to the energy loss parametrization, and introduce corrections if needed.
The value of ε was estimated for each track using an initial gain calibration of the pixel and strip readout chips. Approximate particle identification was performed starting from a sample of identified tracks selected as follows: a track was identified as pion, kaon, or proton if its momen-tum p and most probable energy loss rate ε satisfied the tight requirements listed in Table3. In addition, tracks with p >2 GeV/c, orε <3.2 MeV/cm, or from identified K0S two-body charged decays were assumed to be pions. Identi-fied electrons were not used. The expectedε, path lengthl, and energy deposity were collected for each hit, and stored for every readout chip separately. For each chip, the joint en-ergy deposit log-likelihood,−2
jlogp(g·yj|εj, lj), of all
selected hits (indexj) was minimized by varying the mul-tiplicative gain correctiong. At each center-of-mass energy, approximately 10 % of the data were sufficient to perform a gain calibration with sufficient resolution. The expected gain uncertainty is 0.5 % on average for pixel chips and 0.5–2 % for strips readout chips, depending on the chip position.
After the detector gain calibration, the energy loss parametrization was validated with particles identified by the selection discussed above. As examples, the measured energy deposit distributions of positively charged hadrons for different path lengths atβγ=p/m=1.39 and 3.49 are shown for PXB and TIB in Fig.3, for the 7 TeV dataset. Similar results were obtained from the data taken at 0.9 and 2.76 TeV. Separate corrections for positive and negative par-ticles were necessary since some effects are not charge sym-metric. The energy loss parametrization [15] (solid lines in the figures) gives a good description of the data. In order to describe deviations from the parametrization, we allow for an affine transformation of the theoretical distributions (logε→αlogε+δ), the parameters of which are deter-mined from the hit-level residuals. The scale factors (α) and the shifts (δ) are both functions of theβγ value of the parti-cle and the length of the track segmentlin silicon. The scale factors are around unity for mostβγ values and increase to
Table 3 Tight requirements for approximate particle identification. Allεvalues are functions ofp. Subscriptsπ, K, and p refer to the most probable value for a given particle species, as expected from sim-ulation
Particle Momentum Most probable energy loss rate pion 0.15< p <0.70 GeV/c ε < (επ+εK)/2
kaon p <0.70 GeV/c (επ+εK)/2< ε < (εK+εp)/2
Fig. 3 An example from the 7 TeV dataset of the validation of the energy deposit parametrization. The measured energy deposit distribu-tions of identified hadrons at givenβγ values in the PXB (top) and TIB (bottom) are shown. Values are given for silicon path lengths of
l=270, 300, 450, 600, 750, and 900 µm, together with predictions of the parametrization (curves) already containing the hit-level correc-tions (scale factors and shifts). The average cluster noiseσn is also
given
1.2–1.4 forβγ <2. Shifts (δ) are generally a few keV with deviations up to 10 keV for βγ <1. A slight path-length dependence was found for both scale factors and shifts. The observed behavior of these hit-level residuals, as a func-tion ofβγ andl, was parametrized with polynomials. These corrections were applied to individual hits during the deter-mination of the logεtemplates, as described below.
4.2 Estimation of the most probable energy loss rate for tracks
The best value ofεfor each track was calculated with the corrected energy deposits. The logεvalues in(η, pT)bins
were then used in the yield unfolding (Sect.5). Removal of hits with incompatible energy deposits and the creation of fit templates, giving the expected logεdistributions for all particle species (electrons, pions, kaons, and protons), are discussed here.
The value ofεwas estimated by minimizing the joint en-ergy deposit negative log-likelihood of all hits on the trajec-tory (indexi),χ2= −2
ilogp(yi|ε, li). Distributions of
logεas a function of total momentumpare plotted in Fig.4 for electrons, pions, kaons, and protons, and compared to the predictions of the energy loss method. The low momentum region is not well described, with the logεestimates slightly shifted towards higher values. This is because charged parti-cles slow down when traversing the detector, which leads to hits with higher average energy deposit than expected by the parameterization. The observed deviations were taken into account by means of track-level corrections (cf. Sect.5).
Since the association of hits to tracks is not always un-ambiguous, some hits, usually from noise or hit overlap, do not belong to the actual track. These false hits, or “outliers”, can be removed. The tracks considered for hit removal were those with at least three hits and for which the joint energy-depositχ2is larger than 1.3nhits+4√1.3nhits, wherenhits denotes the number of hits on the track. If the exclusion of a hit decreased theχ2 by at least 12, the hit was removed. At most one hit was removed; this affected about 1.5 % of the tracks. If there is an outlier, it is usually the hit with the lowest E/ xvalue.
In addition to the most probable value of logε, the shape of the logεdistribution was also determined from the data. The template distribution for a given particle species was built from tracks with estimatedεvalues within three stan-dard deviations of the theoretical value at a given βγ. All kinematical parameters and hit-related observables were kept, but the energy deposits were re-generated by sampling from the analytical parametrization. This procedure exploits the success of the method at the hit level to ensure a mean-ingful template determination, even for tracks with very few hits.
5 Fitting the logεdistributions
As seen in Fig.4, low-momentum particles can be identified unambiguously and can therefore be counted. Conversely, at high momentum, the logε bands overlap (above about 0.5 GeV/cfor pions and kaons, and 1.2 GeV/cfor protons); the particle yields therefore need to be determined by means of a series of template fits in bins ofηandpT. This is de-scribed in the following.
Fig. 4 Distribution of logεvalues as a function of total momentump
for the 2.76 TeV dataset, for positive (top) and negative particles ( bot-tom). Thezscale is shown in arbitrary units and is linear. Thecurves
show the expected logεfor electrons, pions, kaons, and protons [2]
k indicating electron, pion, kaon, or proton. The goal is to determine the yield of each particle type (ak)
contribut-ing to the measured distribution. Since the entries in a histogram are Poisson-distributed, the corresponding log-likelihood function to minimize is
χ2=
i
2
ti−mi+milog(mi/ti), (1)
whereti=kakxki contains the quantity to be fitted. The
minimum for this non-linear expression can be found by us-ing Newton’s method [16], usually within three iterations. Although the templates describe the measured logε distribu-tions reasonably well, for a precision measurement further (track-level) corrections are needed to account for the re-maining discrepancies between data and simulation. Hence, we allow for an affine transformation of the templates with
scale factors and shifts that depend onηandpT, the particle charge, and the particle mass.
For a less biased determination of track-level corrections, enhanced samples of each particle type were also employed. For electrons and positrons, photon conversions in the beam-pipe or in the first pixel layer were used. For high-purityπ and enhanced p samples, weakly decaying hadrons were se-lected (K0S,Λ/Λ). Both photon conversions and weak de-cays were reconstructed by means of a simple neutral-decay finder, followed by a narrow mass cut. Invariant-mass dis-tributions of the selected candidates are shown in Fig.5a. A sample with enhanced kaon content was obtained by tag-ging K± mesons (with the requirements listed in Table3)
and looking for an opposite-sign particle which, with the kaon mass assumption, would give an invariant mass close to that of theφ (1020), within 2Γ =8.52 MeV/c2. An ex-ample distribution of logεfor the high-purity pion sample in a narrow momentum slice is plotted in Fig.5b.
5.1 Additional information for particle identification
At low momentum, the logεtemplates for electrons and pi-ons can be compared to the logεdistributions of high-purity samples, but this type of validation does not work at higher momenta because of lack of statistics; for the same reason, it does not work for kaons and protons. It is therefore impor-tant to study the logεdistributions in more detail: they con-tain useful additional information that can be used to deter-mine the track-level corrections, thus reducing the system-atic uncertainties of the extracted yields. This is discussed in the following.
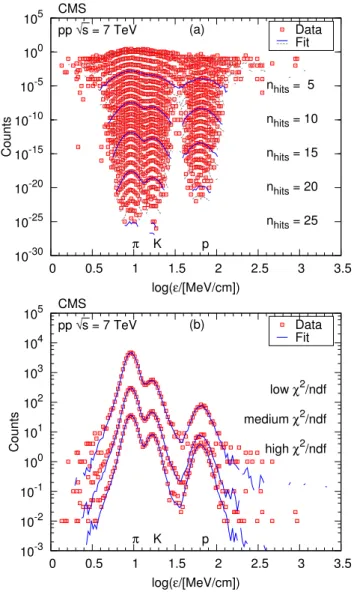
(a) Fitting logε innhits slices The nhits distribution in a
given(η, pT)bin is different for different particle types. Pi-ons have a higher average number of hits per track, with fewer hits for kaons and even fewer for protons. These dif-ferences are due to physical effects, such as the different inelastic hadron-nucleon cross section, multiple Coulomb scattering, and decay in flight. It is therefore advanta-geous to simultaneously perform differential fits innhitsbins (Fig.6a).
(b) Fittinglogεin track-fitχ2/ndfslices The value of the
global χ2 per number of degrees of freedom (ndf) of the Kalman filter used for fitting the track [17], assuming the charged pion mass, can also be used to identify charged par-ticles. Here ndf denotes the number of degrees of freedom for the track fit. This approach relies on the knowledge of the detector material and the local spatial resolution, and exploits the known physics of multiple scattering and en-ergy loss; it can be used to enhance or suppress a specific particle type. The quantity x =χ2/ndf has an approxi-mately Gaussian distribution with mean value 1 and stan-dard deviation σ ≈1/√2·ndf if the track fitted is indeed a pion. If it is not, both the mean and sigma are larger by a factor β(m0)/β(m), where m0 is the pion mass and m is the particle mass. Three classes were defined such that each contains an equal number of genuine pions. The con-ditionx−1<−0.43σ favors pions, and the requirements −0.43σ≤x−1<0.43σ andx−1≥0.43σenhance kaons and protons, respectively. An example of logεdistributions in a χ2/ndf slice, with the corresponding fits, is shown in Fig.6b. The increase of the kaon and proton yields with in-creasingxis visible, when compared to pions.
Fig. 6 Examples of logεdistributions (symbols) for the 7 TeV dataset atη=0.35,pT=0.675 GeV/c, and corresponding template fits (solid curvesrepresent the fit for thenhitsvalues indicated on theright, lighter dashed curvesare for intermediatenhits). The most probable values for
pions (π), kaons (K), and protons (p) are indicated. (a) Distributions innhitsslices. Thepointsand thecurveswere scaled down by factors
of 10−nhits for better visibility, withn
hits=1 at thetop. (b)
Distribu-tions in track-fitχ2/ndf slices, integrated over allnhits. Thepointsand
thecurveswere scaled down by factors of 1, 10, and 100 for better visibility, with the lowestχ2/ndf slice at thetop
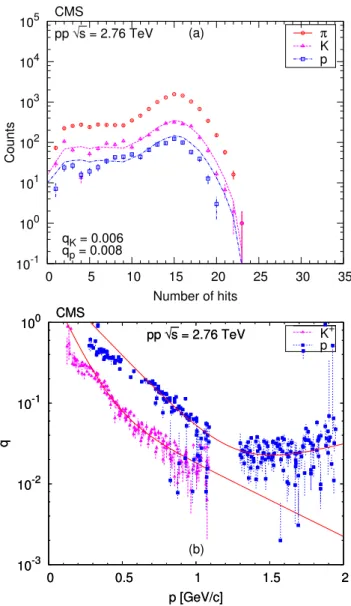
(c) Difference of hit losses Thenhits distribution depends
on the particle species, with pions producing more hits than other particles. Furthermore, the nhits distributions of two particle types are related to each other. Let fn denote the
number of particles of type f with n hits (n≥1), in an (η, pT) bin. Let us assume that another particle species g produces fewer hits, i.e. has a higher probability of hit lossq, taken to be roughly independent of the hit position along the track. The distribution of the number of hitsgk can then be
predicted, withgk=r(1−q)k[fk+qnmaxn=k+1fn], wherer
(com-pared to pions) is primarily a function of momentum. At lower momenta, the best value of q can be estimated for each (η, pT)bin by comparing the measured kaon or pro-ton distributions to the ones predicted with the pion nhits distribution according to the formula above. An example of the nhits distributions and the corresponding fits is shown in Fig.7a. The resulting values ofq as a function ofpare shown in Fig.7b, for the kaon-pion and proton-pion pairs. The data points with q <0.2 can be approximated with a sum of two exponentials inp. This can be motivated by the decay in flight for kaons, but also by the increase of mul-tiple Coulomb scattering with decreasing momentum. The weaker dependence at low momentum (q >0.2) is due to the increasing multiple scattering for pions; however, this region in not used in the present analysis. The relation be-tween the nhits distributions of two particle types has very important consequences: since the number of charged par-ticles at eachnhits value is known, only the local ratior of particle abundances (K/π, p/π) has to be determined from the fits.
(d) Continuity of parameters In some (η, pT) bins the
track-level corrections (scale factors and shifts) are diffi-cult to determine. These parameters are expected to change smoothly as the kinematical region varies. The fit parameters are therefore smoothed by taking the median of the(η, pT) bin and its 8 neighbors.
(e) Convergence of parameters While the track-level
cor-rections are independent, they should converge to similar values at a momentum,pc, where theεvalues are the same
for two particle types, although the energy deposit distri-butions can be slightly different. These momenta arepc=
1.56 GeV/cfor the pion-kaon and 2.58 GeV/cfor the pion-proton pair. The differences of fitted scale factors and shifts were studied as a function of logε, in narrow η slices. The parameter values were determined in the ranges 0.50< p <1.00 GeV/cfor kaons and 1.30< p <1.65 GeV/cfor protons. In these regions, the parameters were fitted and ex-trapolated to pc. At pc, the scale factors are expected to
be the same and their logεdependence is well described with first-order (proton–pion) or second-order polynomials (kaon–pion), in each ηslice separately. More freedom had to be allowed for the shifts. While their logεdependence can be described with first-order polynomials, their differ-ence is not required to converge to 0, but to a second-order polynomial ofη.
5.2 Determination of yields
In summary, in a given(η, pT)bin, the free parameters are: the scale factors (usually in the range 0.98–1.02) and the
Fig. 7 (a) Example of extracted nhits distributions (symbols) of
pi-ons, kapi-ons, and protpi-ons, for the 2.76 TeV dataset at η=0.35,
pT=0.875 GeV/c, and corresponding fits (curves, see Sect.5.1,
para-graphc). (b) Probability of additional hit lossqwith respect to pions as a function of total momentumpin the range|η|<1 for positive kaons and protons, for the 2.76 TeV dataset, if the track-fitχ2/ndf value is in the lowest slice. In order to exclude regions of crossing logεbands, values are not shown ifp >1.1 GeV/cfor kaons, and 1.1< p <1.3 GeV/cfor protons. These points were also omitted in the double-exponential fit
In order to obtain a stable result, the fits were carried out in several passes, each containing iterative steps. After each step, the resulting scale factors and shifts were the new start-ing points for the next iteration. In the first pass, logε dis-tributions in narrow momentum slices were fitted using the enhanced electron, pion, proton, and kaon samples, as de-fined in Sect.5. The fitted parameters were then used for a fit in the same slices of the inclusive dataset. In this way the scale factors and shifts were estimated as a function of p. In the second pass, the logε distributions in each (η, pT) bin were fitted. Theηbins are 0.1 units wide and cover the range −2.4< η <2.4. ThepT bins are 0.05 GeV/cwide and cover the rangepT<2 GeV/c. The latter choice reflects thepTresolution (0.015–0.025 GeV/c). The procedure was repeated with the enhanced samples, followed again by the
inclusive sample. Thenhitsdistributions were used to extract the relationship between different particle species and this is used in all subsequent steps. The shifts are determined and constrained first, and then the scale factors are obtained. Ex-ample fits are shown in Fig.8. In the last pass all parameters are kept constant and the final normalised logεtemplates for each particle species are extracted and used to measure the particle yields.
The results of the fitting sequence are the yields for each particle species and charge, both inclusive and divided into track multiplicity bins. While the yields are flat inη, they decrease with increasingpT, as expected. At the end of the fitting sequenceχ2/ndf values are usually close to unity, ex-cept for some low-pTfits. At lowpthe pions are well fitted, and the different species are well separated. Hence, instead
Fig. 8 Example logεdistributions atη=0.35 in some selectedpTbins, for the 7 TeV dataset. The details of the template fits are discussed in the
of fitting kaon or proton yields, it is sufficient to count the number of entries above the fitted shape of the pion distribu-tion.
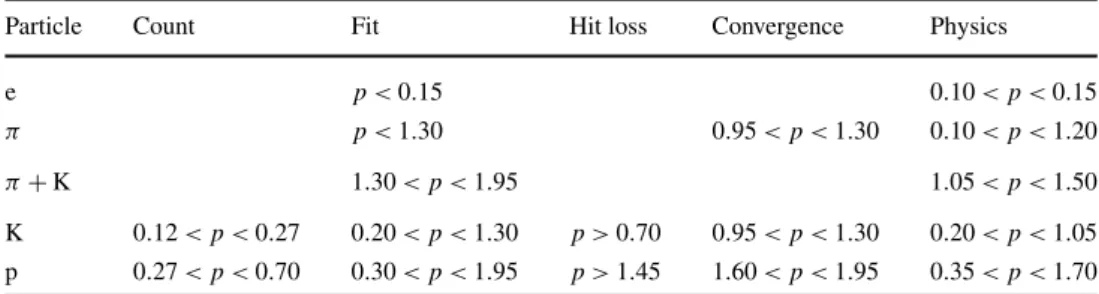
Table 4 summarizes the particle-specific momentum ranges for the following procedures: counting the yields
(Count); using a particle species in the fits (Fit, paragraphsa
andb in Sect.5.1); using the correspondence between hit losses in the fits (Hit loss, paragraph c); using the prin-ciple of convergence for track-level corrections in the fits
(Convergence, paragraphe); and using the fitted yields for
physics (Physics). The use of these ranges limits the sys-tematic uncertainties at high momentum. The ranges, after evaluation of the individual fits, were set such that the sys-tematic uncertainty of the measured yields does not exceed 10 %. Forp >1.30 GeV/c, pions and kaons were not fitted separately, but were regarded as one particle species (π+K row in Table 4). In fact, fitted pion and kaon yields were not used forp >1.20 GeV/candp >1.05 GeV/c, respec-tively. Although pion and kaon yields cannot be determined in this high-momentum region, their sum can be measured. This information is an important constraint when fitting the pTspectra (Sect.7).
The statistical uncertainties for the extracted yields are given by the fits. The observed local (η, pT)variations of parameters for track-level corrections cannot be attributed to statistical fluctuations and indicate that the average sys-tematic uncertainties of the scale factors and shifts are about 10−2 and 2·10−3, respectively. The systematic uncertain-ties on the yields in each bin were obtained by refitting the histograms with the parameters changed by these amounts.
6 Corrections
The measured yields in each(η, pT)bin, Nmeasured, were first corrected for the misreconstructed-track rate (Cf,
Sect.3.2) and the fraction of secondaries (Cs, Sect.3.3):
N′= Nmeasured·(1−Cf)·(1−Cs). (2)
Bins in which the misreconstructed-track rate was larger than 0.1 or the fraction of secondaries was larger than 0.25 were rejected.
The distributions were then unfolded to take into account the finite η and pT resolutions. The η distribution of the tracks is flat and theηresolution is very good. Conversely, thepTdistribution is steep in the low-momentum region and separate corrections in eachηbin were necessary. In addi-tion, the reconstructedpT distributions for kaons and pro-tons, at very lowpT, are shifted with respect to the generated distributions by about 0.025 GeV/c. This bias is a conse-quence of using the pion mass for all charged particles (see Sect.5.1). A straightforward unfolding procedure with lin-ear regularization [16] was used, based on response matrices Robtained from MC samples for each particle species. With
oandmdenoting the vector of original and measured
differ-ential yields (d2N/dηdpT), the sum of the chi-squared term (Ro−m)TV−1(Ro−m) and a regularizer term λoTHo
is minimized by varying o, where H is a tridiagonal
ma-trix. The covariance of measured values is approximated by Vij≈miδij, whereδij is Kronecker’s delta. The value ofλ
is adjusted such that the minimized sum of the two terms equals the number of degrees of freedom. In practice the pa-rameterλis small, of the order of 10−5.
The corrected yields were obtained by applying correc-tions (cf. Sect.3.2) for acceptance (Ca), efficiency (Ce), and
multiple reconstruction rate (Cm):
1 Nev
d2N
dηdpT corrected=
1
Ca·Ce·(1+Cm)
N′ Nev η pT
, (3)
where Nev is the corrected number of DS events (see Sect.3). Bins with acceptance smaller than 0.5, efficiency smaller than 0.5, or multiple-track rate greater than 0.1 were rejected.
Finally, the differential yields d2N/dηdpT were trans-formed to invariant yields as a function of the rapidity y by multiplying by the Jacobian E/p, and the (η, pT) bins were mapped into a(y, pT)grid. The invariant yields 1/Nevd2N/dydpTas a function ofpTwere obtained by av-eraging overyin the range−1< y <1. They are largely in-dependent ofyin the narrow region considered, as expected.
6.1 Systematic uncertainties
The systematic uncertainties are summarized in Table 5; they are subdivided in three categories.
Table 4 Momentum ranges used in various steps and procedures of the analysis. Total momentum values are given in GeV/c. The use of hit loss and parameter convergence is with respect toπfor K, andπ+K for p
Particle Count Fit Hit loss Convergence Physics
e p <0.15 0.10< p <0.15
π p <1.30 0.95< p <1.30 0.10< p <1.20
π+K 1.30< p <1.95 1.05< p <1.50
Table 5 Summary of the systematic uncertainties on the spectra. Values in parentheses indicate uncertainties on thepTmeasurement.
Repre-sentative, particle-specific uncertainties (π, K, p) are shown atpT=0.6 GeV/c
Source Uncertainty of the source [%] Propagated yield uncertainty [%]
Fully correlated, normalisation
Correction for event selection 3.0(1.0)
0.3
3.0 (1.0) Pileup correction (merged and split vertices)
Mostly uncorrelated
Pixel hit efficiency 0.3
0.1
0.3 Misalignment, different scenarios
Mostly uncorrelated,(y, pT)dependent π K p
Acceptance of the tracker 1–6 1 1 1
Efficiency of the reconstruction 2–5 2 2 2
Multiple-track reconstruction 50 % of the corr. – – –
Misreconstructed-track rate 50 % of the corr. <0.5 <0.5 0.5
Correction for secondary particles 20 % of the corr. <0.5 – 2
Fitting logεdistributions 1–10 1 2 1
– The uncertainties of the corrections related to the event selection (Sect. 3.1) and pileup (Sect.3.3) are fully or mostly correlated and were treated as normalisation un-certainties. They amount to a 3.0 % systematic uncer-tainty on the yields and 1.0 % on the averagepT. – The pixel hit efficiency and the effects of a possible
mis-alignment of the detector elements are mostly uncorre-lated. Their contribution to the yield uncertainty is about 0.3 % [7].
– Other mostly uncorrelated systematic effects are the fol-lowing: the tracker acceptance and the track reconstruc-tion efficiency (Sect.3.2) generally have small uncertain-ties (1 % and 2 %, respectively), but change rapidly at very lowpT, leading to a 5–6 % uncertainty on the yields in that range; for the multiple-track and misreconstructed-track rate corrections (Sect. 3.2), the uncertainty is as-sumed to be 50 % of the correction, while for the case of the correction for secondary particles it is 20 % (Sect.3.3). The uncertainty of the fitted yields (Sect.5.2) also belongs to this category.
In the weighted averages and the fits discussed in the fol-lowing, the quadratic sum of statistical and systematic un-certainties (referred to as combined uncertainty) is used. The fully correlated systematic uncertainties (event selection and pileup) are not displayed in the plots.
7 Results
In previously published measurements of unidentified and identified particle spectra, the following form of the Tsallis–
Pareto-type distribution [19,20] was fitted to the data:
d2N dydpT =
dN
dy ·C·pT
1+(mTnT−m)
−n
, (4)
where
C= (n−1)(n−2)
nT[nT +(n−2)m] (5)
andmT=
m2+p2
T(cfactors are omitted from the preced-ing formulae). The free parameters are the integrated yield dN/dy, the exponentn, and the inverse slopeT. The above formula is useful for extrapolating the spectra topT=0, and for extractingpT and dN/dy. Its validity in the present analysis was cross-checked by fitting MC spectra and ver-ifying that the fitted values ofpT and dN/dy were con-sistent with the generated values. According to some mod-els of particle production based on non-extensive thermody-namics [20], the parameterT is connected with the average particle energy, whilencharacterizes the “non-extensivity” of the process, i.e. the departure of the spectra from a Boltz-mann distribution.
η≈0, Eq. (4) becomes:
d2N dηdpT ≈
dN dy ·C·
p2T mT
1+mT−m nT
−n
. (6)
In the case of pions and protons, the measurements cover a widepTrange: the yields and averagepTcan thus be de-termined with small systematic uncertainty. For the kaons the number of measurements is small and the pT range is limited. Therefore, for the combined pion and kaon fits, the kaon component was weighted by a factor of four, leading to the following function to be minimized:χπ2+χπ2+K+4χK2. This weight accounts for the pT range, which is narrower by a factor about two, and also for the partial correlation be-tween the pion measurement and that of the sum of pions and kaons, which gives another factor two.
The average transverse momentum pT and its uncer-tainty were obtained by numerical integration of Eq. (4) with the fitted parameters.
The results discussed in the following are for|y|<1 at √s
=0.9,2.76,and 7 TeV. In all cases, error bars indicate the uncorrelated statistical uncertainties, while bands show the uncorrelated systematic uncertainties. The fully corre-lated normalisation uncertainty (not shown) is 3.0 %. For the pT spectra, the average transverse momentum, and the ratio of particle yields, the data are compared to the D6T and Z2 tunes of PYTHIA6 [8] as well as to the 4C tune of PYTHIA8 [21].
7.1 Inclusive measurements
The transverse momentum distributions of positive and neg-ative hadrons (pions, kaons, protons) are shown in Fig.9, along with the results of the fits to the Tsallis–Pareto parametrization (Eqs. (4) and (6)). The fits are of good qual-ity withχ2/ndf values in the range 0.6–1.5 for pions, 0.6– 2.1 for kaons, and 0.4–1.1 for protons. Figure10presents the data compared to various PYTHIAtunes. Tunes D6T and 4C tend to be systematically below or above the spectra, whereas Z2 is generally closer to the measurements (except for low-pTprotons).
Ratios of particle yields as a function of the transverse momentum are plotted in Fig. 11. While the p/π ratios are well described by all tunes, there are substantial devia-tions for the K/πratios, also seen by other experiments and at different energies. CMS measurements of K0S andΛ/Λ production [14] are consistent with the discrepancies seen here. The ratios of the yields for oppositely charged particles are close to one, as expected for pair-produced particles at midrapidity. Ratios for pions and kaons are compatible with unity, independently ofpT. While the p/p ratios are also flat as a function ofpT, they increase with increasing√s.
7.2 Multiplicity-dependent measurements
This study is motivated by the intriguing hadron correlations measured in pp collisions at high track multiplicities [22], which suggest possible collective effects in “central” pp collisions at the LHC. In addition, the multiplicity depen-dence of particle yield ratios is sensitive to various final-state effects (hadronization, color reconnection, collective flow) implemented in MC models used in collider and cosmic-ray physics [23].
Twelve event classes were defined, each with a different number of reconstructed particles: Nrec=(0–9), (10–19), (20–29), . . . , (100–109)and(110–119), as shown in Ta-ble 6. In order to facilitate comparisons with models, the corresponding true track multiplicity in the range|η|<2.4 (Ntracks) was determined from the simulation. The average Ntracksvalues, given in Table6, are used in the plots pre-sented in the following. The results in the table were found to be independent of the center-of-mass energy and the PYTHIAtune.
The normalized transverse-momentum distributions of identified charged hadrons in selected multiplicity classes, for |y|<1 and √s=0.9,2.76, and 7 TeV, are shown in Figs. 12, 13, and 14, for pions, kaons, and protons, re-spectively. The distributions of negatively and positively charged particles have been summed. The distributions are fitted to the Tsallis–Pareto parametrization. In the case of pions, the distributions are remarkably similar, and essen-tially independent of √s and multiplicity. For kaons and protons, there is a clear evolution as the multiplicity in-creases. The inverse slope parameterT increases with mul-tiplicity for both kaons and protons, while the exponentn is independent of the multiplicity (not shown in the fig-ures).
The ratios of particle yields as a function of track mul-tiplicity are displayed in Fig.15. The K/π and p/π ratios are flat as a function ofNtracks. Although the trend at low Ntracksis not reproduced by any of the tunes, the values are approximately correct for tunes D6T and Z2, while 4C is off, especially for K/π. The ratios of yields of oppositely charged particles are independent ofNtracks.
Fig. 9 Transverse momentum distributions of identified charged hadrons (pions, kaons, protons) in the range|y|<1, for positive (left) and negative (right) particles, at √s=0.9,2.76,and 7 TeV (from
toptobottom). Kaon and proton distributions are scaled as shown in
Fig. 10 Transverse momentum distributions of identified charged hadrons (pions, kaons, protons) in the range|y|<1, for positive (left) and negative (right) particles, at√s=0.9,2.76,and 7 TeV (fromtop
tobottom). Measured values (same as in Fig.9) are plotted together
Fig. 11 Ratios of particle yields as a function of transverse momen-tum, at√s=0.9,2.76,and 7 TeV (fromtoptobottom).Error bars
indicate the uncorrelated statistical uncertainties, while boxesshow
Table 6 Relationship between the number of reconstructed tracks (Nrec) and the average number of true tracks (Ntracks) in the 12 multiplicity
classes considered
Nrec 0–9 10–19 20–29 30–39 40–49 50–59 60–69 70–79 80–89 90–99 100–109 110–119
Ntracks 7 16 28 40 52 63 75 86 98 109 120 131
Fig. 12 Normalized transverse momentum distributions of charged pions in a few representative multiplicity classes, in the range|y|<1, at√s=0.9,2.76,and 7 TeV, fitted to the Tsallis–Pareto parametriza-tion (solid lines). For better visibility, the result for any givenNtracks
bin is shifted by 0.5 units with respect to the adjacent bins.Error bars
indicate the uncorrelated statistical uncertainties, whilebandsshow the uncorrelated systematic uncertainties
to the latter. Tune 4C gives a flat multiplicity dependence for T and is not favored by the kaon and proton measure-ments.
The center-of-mass energy dependence of dN/dy, the av-erage transverse momentumpT, and the particle yield ra-tios are shown in Fig.17. For dN/dy, the Z2 tune gives the best overall description. ThepTof pions is reproduced by tune 4C, that of the kaons is best described by Z2, and that of the protons is not reproduced by any of the tunes, with
Fig. 13 Normalized transverse momentum distributions of charged kaons in a few representative multiplicity classes, in the range|y|<1, at√s=0.9,2.76,and 7 TeV, fitted to the Tsallis–Pareto parametriza-tion (solid lines). For better visibility, the result for any givenNtracks
bin is shifted by 0.5 units with respect to the adjacent bins.Error bars
indicate the uncorrelated statistical uncertainties, whilebandsshow the uncorrelated systematic uncertainties
a function of √s, and have values of 0.13 and 0.06–0.07, respectively. The exponentn(not shown in the figures) de-creases with increasing√s for pions and protons. For the kaons the systematic uncertainties are too large to draw a definite conclusion. The inverse slopeT (also not shown) is flat as a function of√s for the pions but exhibits a slight increase for the protons. The universality of the relation of pTand the particle-yield ratios with the track multiplicity, and its independence of the collision energy is demonstrated in Fig.18.
The transverse-momentum distributions of identified charged hadrons at central rapidity are compared to those of the ALICE Collaboration [24] at√s=0.9 TeV in Fig.19 (|y|<1 for CMS,|y|<0.5 for ALICE). While the rapidity coverage is different, the measurements can be compared
because the pT spectra are largely independent of y for |y|<1. The results from the two experiments agree well for the mesons, and exhibit some small discrepancies for the protons.
The center-of-mass energy dependence of dN/dy in the central rapidity region and the average transverse momen-tum for pions, kaons, and protons are shown in Fig. 20. Measurements from UA2 [25], E735 [26], PHENIX [27], STAR [28], ALICE [24], and CMS are shown. The observed √s
evolution of both quantities is consistent with a power-law increase.
(out-Fig. 14 Normalized transverse momentum distributions of charged protons in a few representative multiplicity classes, in the range |y|<1, at√s=0.9,2.76, and 7 TeV, fitted to the Tsallis–Pareto parametrization (solid lines). For better visibility, the result for any
givenNtracksbin is shifted by 0.5 units with respect to the
adja-cent bins.Error barsindicate the uncorrelated statistical uncertainties, whilebandsshow the uncorrelated systematic uncertainties
going baryon). Measurements from ISR energies [29,30], NA49 [31], BRAHMS [32], PHENIX [33], PHOBOS [34], and STAR [35] are shown together with LHC (ALICE [36] and CMS) data. The curve represents the expected y de-pendence in a Regge-inspired model, where baryon pair production is governed by Pomeron exchange, and baryon transport by string-junction exchange [37]. The functional form used is(p/p)−1=1+Cexp[(αJ−αP) y]withC=
10, αP =1.2, and αJ =0.5, as used in the ALICE
pa-per. While the low yregion is not properly described, the agreement is good at higher y. The CMS data are con-sistent with previous measurements, as well as with the pro-posed function. New data from the LHCb Collaboration [38] in the forward region could further constrain the parameters of the model.
8 Conclusions
Fig. 15 Ratios of particles yields in the range|y|<1 as a function of the true track multiplicity for|η|<2.4, at√s=0.9,2.76,and 7 TeV (fromtoptobottom).Error barsindicate the uncorrelated combined
Fig. 16 Average transverse momentum of identified charged hadrons (pions, kaons, protons) in the range|y|<1, for positive (left) and negative (right) particles, as a function of the true track multiplicity for|η|<2.4, at√s=0.9,2.76,and 7 TeV (fromtoptobottom).
Er-ror barsindicate the uncorrelated combined uncertainties, whileboxes
Fig. 17 Center-of-mass energy dependence of dN/dy, average trans-verse momentumpT, and ratios of particle yields.Error barsindicate
the uncorrelated combined uncertainties, whileboxesshow the uncor-related systematic uncertainties. For dN/dy(pT) the fully correlated
normalisation uncertainty (not shown) is 3.0 % (1.0 %).Curves indi-cate predictions from PYTHIA6 (D6T and Z2 tunes) and the 4C tune of PYTHIA8
of hadron production and contribute to the understanding of basic non-perturbative dynamics in hadronic collisions.
The measured track multiplicity dependence of the ra-pidity density and of the average transverse momentum in-dicates that particle production at LHC energies is strongly correlated with event particle multiplicity rather than with the center-of-mass energy of the collision. This correlation may reflect the fact that at TeV energies the characteristics of particle production in hadronic collisions are constrained by the amount of initial parton energy available in a given collision.
Acknowledgements We congratulate our colleagues in the CERN accelerator departments for the excellent performance of the LHC machine. We thank the technical and administrative staff at CERN and other CMS institutes. This work was supported by the
Tech-Fig. 18 Top: average transverse momentum of identified charged hadrons (pions, kaons, protons) in the range|y|<1, for all particle types, as a function of the true track multiplicity for|η|<2.4, for all energies.Bottom: ratios of particle yields as a function of particle multiplicity for|η|<2.4, for all energies.Error barsindicate the un-correlated combined uncertainties, whileboxesshow the uncorrelated systematic uncertainties. ForpTthe fully correlated normalisation
uncertainty (not shown) is 1.0 %.Linesare drawn to guide the eye (solid—0.9 TeV,dotted—2.76 TeV,dash-dotted—7 TeV)
nology, Hungary; the Department of Atomic Energy and the Depart-ment of Science and Technology, India; the Institute for Studies in The-oretical Physics and Mathematics, Iran; the Science Foundation, Ire-land; the Istituto Nazionale di Fisica Nucleare, Italy; the Korean Min-istry of Education, Science and Technology and the World Class Uni-versity program of NRF, Korea; the Lithuanian Academy of Sciences; the Mexican Funding Agencies (CINVESTAV, CONACYT, SEP, and UASLP-FAI); the Ministry of Science and Innovation, New Zealand; the Pakistan Atomic Energy Commission; the Ministry of Science and Higher Education and the National Science Centre, Poland; the Fun-dação para a Ciência e a Tecnologia, Portugal; JINR (Armenia, Be-larus, Georgia, Ukraine, Uzbekistan); the Ministry of Education and Science of the Russian Federation, the Federal Agency of Atomic En-ergy of the Russian Federation, Russian Academy of Sciences, and the Russian Foundation for Basic Research; the Ministry of Science
Fig. 19 Comparison of transverse momentum distributions of identi-fied charged hadrons (pions, kaons, protons) at central rapidity (|y|<1 for CMS,|y|<0.5 for ALICE [24]), for positive hadrons (top) and negative hadrons (bottom), at√s=0.9 TeV. To improve clarity, the kaon and proton points are scaled by the quoted factors.Error bars in-dicate the uncorrelated statistical uncertainties, whilebandsshow the uncorrelated systematic uncertainties. In the CMS case the fully cor-related normalisation uncertainty (not shown) is 3.0 %. The ALICE results were corrected to inelastic pp collisions and therefore the CMS points are scaled by an empirical factor of 0.78 so as to correct for the different particle level selection used by ALICE
and Technological Development of Serbia; the Secretaría de Estado de Investigación, Desarrollo e Innovación and Programa Consolider-Ingenio 2010, Spain; the Swiss Funding Agencies (ETH Board, ETH Zurich, PSI, SNF, UniZH, Canton Zurich, and SER); the National Sci-ence Council, Taipei; the Scientific and Technical Research Council of Turkey, and Turkish Atomic Energy Authority; the Science and Tech-nology Facilities Council, UK; the US Department of Energy, and the US National Science Foundation.
Fig. 20 Comparison of the center-of-mass energy dependence of the central rapidity density dN/dy (top) and the average transverse momentumpT(bottom). Low-energy data (UA2 [25], E735 [26],
PHENIX [27], STAR [28]) are shown with LHC data (ALICE [24] and CMS). For the CMS points, theerror barsindicate the uncorre-lated combined uncertainties, while boxes show the uncorreuncorre-lated sys-tematic uncertainties. The fully correlated normalisation uncertainty (not shown) is around 3.0 % (top plot) and 1.0 % (bottom plot)
Recherche dans l’Industrie et dans l’Agriculture (FRIA-Belgium); the Agentschap voor Innovatie door Wetenschap en Technologie (IWT-Belgium); the Council of Science and Industrial Research, India; the Compagnia di San Paolo (Torino); and the HOMING PLUS pro-gramme of Foundation for Polish Science, cofinanced from European Union, Regional Development Fund.
Open Access This article is distributed under the terms of the Cre-ative Commons Attribution License which permits any use, distribu-tion, and reproduction in any medium, provided the original author(s) and the source are credited.
Fig. 21 Comparison of the central rapidity p/p yield ratio as a func-tion of the rapidity difference y, plotted together with the prediction of the Regge-inspired model [37]. Measurements at low energies (ISR, [29,30]), NA49 [31], BRAHMS [32], PHENIX [33], PHOBOS [34], and STAR [35] are shown along with LHC data (ALICE and CMS)
References
1. CMS Collaboration, The CMS experiment at the CERN LHC. J. Instrum. 3, S08004 (2008). doi:10.1088/1748-0221/3/08/ S08004
2. Particle Data Group Collaboration, Review of particle physics. J. Phys. G 37, 075021 (2010). doi:10.1088/0954-3899/37/7A/ 075021
3. CMS Collaboration, Commissioning and performance of the CMS pixel tracker with cosmic ray muons. J. Instrum.5, T03007 (2010). doi:10.1088/1748-0221/5/03/T03007.arXiv:0911.5434
4. CMS Collaboration, Commissioning and performance of the CMS silicon strip tracker with cosmic ray muons. J. Instrum.5, T03008 (2010). doi:10.1088/1748-0221/5/03/T03008.arXiv:0911.4996 5. CMS Collaboration, Measurement of CMS luminosity. CMS
Physics Analysis Summary CMS-PAS-EWK-10-004 (2010) 6. CMS Collaboration, Absolute luminosity normalization. Detector
Performance Summary CMS-DP-11-002 (2011)
7. CMS Collaboration, Transverse momentum and pseudorapid-ity distributions of charged hadrons in pp collisions at √s=
0.9 and 2.36 TeV. J. High Energy Phys. 02, 041 (2010). doi: 10.1007/JHEP02(2010)041.arXiv:1002.0621
8. T. Sjöstrand, S. Mrenna, P.Z. Skands, PYTHIA 6.4 physics and manual. J. High Energy Phys. 05, 026 (2006). doi:10.1088/ 1126-6708/2006/05/026.arXiv:hep-ph/0603175
9. R. Field, Studying the underlying event at CDF and the LHC (2009).arXiv:1003.4220. Proceedings of the First International Workshop on Multiple Partonic Interactions at the LHC (MPI08) 10. R. Field, Early LHC underlying event data—findings and surprises
(2010).arXiv:1010.3558
11. F. Siklér, Low pT hadronic physics with CMS. Int. J. Mod.
Phys. E 16, 1819 (2007). doi:10.1142/S0218301307007052. arXiv:physics/0702193
12. CMS Collaboration, Transverse-momentum and pseudorapidity distributions of charged hadrons in pp collisions at√s=7 TeV. Phys. Rev. Lett.105, 022002 (2010). doi:10.1103/PhysRevLett. 105.022002.arXiv:1005.3299
Sect. A, Accel. Spectrom. Detect. Assoc. Equip.621, 526 (2010). doi:10.1016/j.nima.2010.04.058.arXiv:0911.2767
14. CMS Collaboration, Strange particle production in pp collisions at√s=0.9 and 7 TeV. J. High Energy Phys. 05, 064 (2011). doi:10.1007/JHEP05(2011)064.arXiv:1102.4282
15. F. Siklér, A parametrisation of the energy loss distributions of charged particles and its applications for silicon detectors. Nucl. Instrum. Methods Phys. Res., Sect. A, Accel. Spectrom. Detect. Assoc. Equip.691, 16 (2012). doi:10.1016/j.nima.2012.06.064. arXiv:1111.3213
16. W.H. Press, B.P. Flannery, S.A. Teukolsky et al., Numerical Recipes: The Art of Scientific Computing, 3rd edn. (Cambridge University Press, Cambridge, 2007)
17. F. Siklér, Particle identification with a track fit χ2. Nucl. In-strum. Methods Phys. Res., Sect. A, Accel. Spectrom. Detect. Assoc. Equip.620, 477 (2010). doi:10.1016/j.nima.2010.03.098. arXiv:0911.2624
18. R. Brun, F. Rademakers, ROOT: an object oriented data analy-sis framework. Nucl. Instrum. Methods Phys. Res., Sect. A, Ac-cel. Spectrom. Detect. Assoc. Equip.389, 81 (1997). doi:10.1016/ S0168-9002(97)00048-X
19. C. Tsallis, Possible generalization of Boltzmann–Gibbs statistics. J. Stat. Phys.52, 479 (1988). doi:10.1007/BF01016429
20. T.S. Biró, G. Purcsel, K. Ürmössy, Non-extensive approach to quark matter. Eur. Phys. J. A40, 325 (2009). doi:10.1140/epja/ i2009-10806-6.arXiv:0812.2104
21. T. Sjöstrand, S. Mrenna, P.Z. Skands, A brief introduction to PYTHIA 8.1. Comput. Phys. Commun.178, 852 (2008). doi: 10.1016/j.cpc.2008.01.036.arXiv:0710.3820
22. CMS Collaboration, Observation of long-range near-side angu-lar correlations in proton-proton collisions at the LHC. J. High Energy Phys. 09, 091 (2010). doi:10.1007/JHEP09(2010)091. arXiv:1009.4122
23. D. d’Enterria, R. Engel, T. Pierog et al., Constraints from the first LHC data on hadronic event generators for ultra-high energy cosmic-ray physics. Astropart. Phys.35, 98 (2011). doi:10.1016/ j.astropartphys.2011.05.002.arXiv:1101.5596
24. ALICE Collaboration, Production of pions, kaons and protons in pp collisions at√s=900 GeV with ALICE at the LHC. Eur. Phys. J. C71, 1 (2011). doi:10.1140/epjc/s10052-011-1655-9 25. UA2 Collaboration, Inclusive charged particle production at
the CERN anti-p p collider. Phys. Lett. B 122, 322 (1983). doi:10.1016/0370-2693(83)90712-8
26. E735 Collaboration, Mass-identified particle production in proton–antiproton collisions at √s = 300 GeV, 540 GeV,
1000 GeV, and 1800 GeV. Phys. Rev. D 48, 984 (1993). doi: 10.1103/PhysRevD.48.984
27. PHENIX Collaboration, Identified charged hadron production in p+p collisions at √s =200 and 62.4 GeV. Phys. Rev. C83, 064903 (2011). doi:10.1103/PhysRevC.83.064903.arXiv: 1102.0753
28. STAR Collaboration, Strange particle production in p+p col-lisions at √s=200 GeV. Phys. Rev. C 75, 064901 (2007). doi:10.1103/PhysRevC.75.064901.arXiv:nucl-ex/0607033 29. A.M. Rossi, G. Vannini, A. Bussiere et al., Experimental study of
the energy dependence in proton proton inclusive reactions. Nucl. Phys. B84, 269 (1975). doi:10.1016/0550-3213(75)90307-7 30. M. Aguilar-Benitez et al., Inclusive particle production in
400 GeV/c pp interactions. Z. Phys. C 50, 405 (1991). doi: 10.1007/BF01551452
31. NA49 Collaboration, Inclusive production of protons, anti-protons and neutrons in p+p collisions at 158 GeV/c beam momentum. Eur. Phys. J. C 65, 9 (2010). doi:10.1140/epjc/ s10052-009-1172-2.arXiv:0904.2708
32. BRAHMS Collaboration, Forward and midrapidity like-particle ratios from p + p collisions at √s =200 GeV. Phys. Lett. B 607, 42 (2005). doi:10.1016/j.physletb.2004.12.064. arXiv: nucl-ex/0409002
33. PHENIX Collaboration, Identified charged particle spectra and yields in Au+Au collisions at √sN N = 200 GeV. Phys.
Rev. C 69, 034909 (2004). doi:10.1103/PhysRevC.69.034909. arXiv:nucl-ex/0307022
34. PHOBOS Collaboration, Charged antiparticle to particle ratios near midrapidity in p+p collisions at√sN N=200 GeV. Phys.
Rev. C 71, 021901 (2005). doi:10.1103/PhysRevC.71.021901. arXiv:nucl-ex/0409003
35. STAR Collaboration, Systematic measurements of identified par-ticle spectra in pp, d +Au and Au+Au collisions at the STAR detector. Phys. Rev. C 79, 034909 (2009). doi:10.1103/ PhysRevC.79.034909.arXiv:0808.2041
36. ALICE Collaboration, Midrapidity antiproton-to-proton ratio in pp collisions at √s=0.9 and 7 TeV measured by the ALICE experiment. Phys. Rev. Lett. 105, 072002 (2010). doi:10.1103/ PhysRevLett.105.072002.arXiv:1006.5432
37. D. Kharzeev, Can gluons trace baryon number? Phys. Lett. B378, 238 (1996). doi:10.1016/0370-2693(96)00435-2. arXiv:nucl-th/ 9602027
38. LHCb Collaboration, Measurement of prompt hadron production ratios in pp collisions at √s=0.9 and 7 TeV. Eur. Phys. J. C (2012, submitted).arXiv:1206.5160
The CMS Collaboration
Yerevan Physics Institute, Yerevan, Armenia
S. Chatrchyan, V. Khachatryan, A.M. Sirunyan, A. Tumasyan Institut für Hochenergiephysik der OeAW, Wien, Austria
W. Adam, E. Aguilo, T. Bergauer, M. Dragicevic, J. Erö, C. Fabjan1, M. Friedl, R. Frühwirth1, V.M. Ghete, J. Ham-mer, N. Hörmann, J. Hrubec, M. Jeitler1, W. Kiesenhofer, V. Knünz, M. Krammer1, I. Krätschmer, D. Liko, I. Mikulec, M. Pernicka†, B. Rahbaran, C. Rohringer, H. Rohringer, R. Schöfbeck, J. Strauss, A. Taurok, W. Waltenberger, G. Walzel, E. Widl, C.-E. Wulz1
![Fig. 1 (a) Values of the most probable energy loss rate ε, at the ref- ref-erence path length of 450 µm in silicon, for electrons, pions, kaons and protons [2]](https://thumb-eu.123doks.com/thumbv2/123dok_br/16288722.185198/2.892.458.812.77.670/values-probable-energy-erence-length-silicon-electrons-protons.webp)