Revista Ambiente & Água - An Interdisciplinary Journal of Applied Science: v. 8, n.1, 2013. –
A system for environmental monitoring of hydroelectric reservoirs in
Brazil
doi: 10.4136/ambi-agua.1088
Enner Alcântara1*; Marcelo Curtarelli2; Igor Ogashawara3; José Stech4; Arley Souza5
1UNESP - Universidade Estadual Paulista, Presidente Prudente, SP, Brasil
2,3DSR – INPE - Instituto Nacional de Pesquisas Espaciais, São José dos Campos, SP, Brasil 4ETEP Faculdades – São José dos Campos, SP, Brasil
*Autor correspondente: e-mail: enner@fct.unesp.br, mpedroso@dsr.inpe.br, igoroga@dsr.inpe.br, stech@dsr.inpe.br,
arley.souza@etep.edu.br
ABSTRACT
Environmental monitoring of aquatic systems is an important tool to support policy
makers and environmental managers’ decisions. Long-term, continuous collection of environmental data is fundamental to the understanding of an aquatic system. This paper aims to present the integrated system for environmental monitoring (SIMA), a long-term temporal series system with a web-based archive for limnological and meteorological data. The following environmental parameters are measured by SIMA: chlorophyll-a (gL1), water
surface temperature (ºC), water column temperature by a thermistor string (ºC), turbidity (NTU), pH, dissolved oxygen concentration (mg L-1), electric conductivity (µS cm-1), wind speed (ms-1) and direction (º), relative humidity (%), shortwave radiation (Wm-2) and barometric pressure (hPa). The data were collected in a preprogrammed time interval (1 hour) and were transmitted by satellite in quasi-real time for any user within 2500 km of the acquisition point. So far, 11 hydroelectric reservoirs are being monitored with the SIMA buoy. Basic statistics (mean and standard deviation) and an example of the temporal series of some parameters were displayed at a database with web access. However, sensor and satellite problems occurred due to the high data acquisition frequency. Sensors problems occurred due to the environmental characteristics of each aquatic system. Water quality sensors rapidly degrade in acidic waters, rendering the collected data invalid. Data is also rendered invalid when sensors become infested with periphyton. Problems occur with the satellites’ reception of system data when satellites pass over the buoy antenna. However, the data transfer at some inland locations was not completed due to the satellite constellation position. Nevertheless, the integrated system of water quality and meteorological parameters is an important tool in understanding the aquatic system dynamic. It can also be used to create hydrodynamics models of the aquatic system to allow for the study of meteorological implications to the water body.
Keywords: Environmental monitoring,Database, time series, reservoirs.
Sistema para monitoramento ambiental de reservatórios hidrelétricos
no Brasil
RESUMO
7
objetivo deste trabalho é o de apresentar o sistema integrado de monitoramento ambiental (SIMA), um sistema que amostra séries temporais de dados limnológicos e meteorológicos e os armazena em um sistema baseado na web. As variáveis ambientais amostradas pela boia
SIMA são: clorofila-a ( 1
gL
), temperatura da superfície da água (ºC), temperatura da coluna d'água por uma cadeia de termistores (ºC), turbidez (NTU), pH, concentração de oxigênio dissolvido (mg L-1), condutividade elétrica (µS cm-1), velocidade do vento (ms-1) e direção do vento (º), umidade relativa (%), radiação incidente de ondas curtas (Wm-2), pressão atmosférica (hPa). Os dados são amostrados em um intervalo de tempo pré-determinado (1 hora) e são transmitidos por satélite em tempo quase real para qualquer usuário que esteja a um radio de até 2500 km do local de aquisição dos dados. Atualmente estão sendo monitorados 11 reservatórios hidrelétricos via boia SIMA. Uma estatística básica (média e desvio padrão) dos dados e exemplo de séries temporais de alguns parâmetros são apresentados. Entretanto, problemas relacionados aos sensores e ao satélite de coleta de dados foram identificados devido à alta frequência amostral de aquisição dos dados. Os problemas relacionados aos sensores ocorrem devido às características ambientais de cara sistema aquático em monitoramento. Em águas ácidas os sensores de qualidade de água se degradam com maior rapidez, e os dados coletados se tornam inválidos. Outro problema é a infestação de perifíton nos sensores, o que pode causa erro de leitura. Os problemas relacionados ao satélite envolvem a recepção do dado, o qual ocorre somente quando o satélite passa sobre a antena da boia SIMA. Contudo, devido a posição da constelação de satélites algumas localizações não estão totalmente cobertas. O sistema SIMA é uma importante ferramenta para o monitoramento da qualidade da água e dos parâmetros meteorológicos, que pode inclusive contribuir para a caracterização da dinâmica de sistemas aquáticos. Os dados também podem ser utilizados para alimentar modelos hidrodinâmicos, e avaliar os efeitos de eventos meteorológicos no sistema aquático.
Palavras-chave: Monitoramento ambiental, Bando de Dados, Séries Temporais, Reservatórios.
1. INTRODUCTION
Reservoirs, or man-made lakes, are usually built to store water for later use, water supply, flood control or power generation (Casamitjana et al., 2003). There are approximately 31 hydroelectric reservoirs in Brazil, though the reservoirs have multiple uses, They have a volume of more than 1 billion cubic meters and were built by electric sector. The hydroelectric sector is responsible for 97% of energy generation in the country and is considered the largest hydroelectric system in the world (Kelman et al., 2002). The damming of these waters, however, causes great environmental, social and economic impacts (Tundisi, 1994).
8
Ideally, temporal collection of data from aquatic systems is accomplished by automatic stations capable of autonomous monitoring of limnological and meteorological variables (Glasgow et al., 2004; Stech et al., 2006). With the installation of an associated telemetric link, the constant surveillance provided by these systems makes it possible to quickly detect changes and trends in critical indicators (Glasgow et al., 2004).
Long-term, continuous, time-series collection of environmental data data is fundamental to identify and classify sudden changes and to determine their effect on aquatic systems. According to Roland et al. (2012), hydrological pulses and changes in land use can regulate functioning and interaction between biotic and abiotic components in Brazilian aquatic systems. These pulses can be natural or induced for antropic activity, frequent, seasonal or intermittent, with variable magnitude and both direct and indirect effect (Tundisi et al., 2004). Comprehension of functions and characterization of controlling factors, however, normally arise after the collection of large data sets at different time scales, which allows one to identify and differentiate short and long-term variability.
Effective water quality monitoring has become critical for water resource management programs, as water quality perturbations related to escalating human population growth and industry pressures continue to increase in inland areas. Government personnel and scientists show increasing interest in understanding the processes occurring in these environments (Glasgow et al., 2004). However, the main problem is the lack of a consistent long term series of collection of water quality data.
The acquisition of meteorological data is also important for water quality monitoring since the intensity of precipitation events determines runoff intensity and the transport of organic and inorganic elements from the soils to the aquatic ecosystems (Johnson et al. 2008). In this way, changes in the intensity and frequency of precipitation may contribute to higher input of nutrients and consequently enhance the eutrophication process. This process results in excessive algal growth which is a public-health issue, since cyanobacteria blooms, in addition to degrading water quality, can produce toxins harmful to human health (Chorus and Barthram, 1999).
The long term series collection of water quality and meteorological data is essential for environmental studies of aquatic systems. The goal of this paper is to present a system for long-term time series collection of environmental data as well as a data-based data storage system with web access.
2. MATERIALS AND METHODS
2.1. Integrated System for Environmental Monitoring - SIMA
SIMA is a set of hardware and software for data acquisition and real-time monitoring of hydrological systems (Stech et al., 2006). It is an independent system formed by an anchored buoy in which sensors, data storage systems, a battery and a transmission antenna are fixed (Figure 1).
The data are collected in preprogrammed time intervals (1 hour) and are transmitted by satellite in quasi-real time for any user within a range of 2500 km of the acquisition point. The selection of the environmental parameters measured by SIMA took into account factors such as: relevance as an environmental index (i.e. the variables that respond consistently to alterations in the functioning of the aquatic system) and technical suitability for data acquisition and transmission from automatic platforms.
The environmental parameters measured by SIMA are: chlorophyll-a (gL1),water
9
speed (ms-1) and direction (º), relative humidity (%), short wave radiation (Wm-2), barometric pressure (hPa). The characteristics of the sensors are shown in Table 1.
Figure 1: Photo of the SIMA installed at Tucuruí floodplain, Brazilian Amazon.
Table 1: Characteristics of the limnological and meteorological sensors in SIMA.
Sensor Manufacture Range Accuracy Depth/Height
Chlorophyll-a Yellow Spring 0-400 μm 0.1 μm -1.30 m
Water Temperature Yellow Spring -5-60 ºC 0.15ºC -1.30 m
Thermistor String Yellow Spring -5-60 ºC 0.15ºC 4 depths
Turbidity Yellow Spring 0-1000 NTU 0.1 NTU -1.30 m
pH Yellow Spring 0-14 0.01 -1.30 m
Dissolved oxygen Yellow Spring 0-50 mg L-1 0.01 mg L-1 -1.30 m
Electric Conductivity Yellow Spring
Wind R.M. Young 0-100 ms-1 0.3 ms-1 3 m
Humidity Rotronic 0-100 % 1.5 % 3 m
Short wave Kipp & Zonen
CM21 0-1500 Wm-2 ± 1-3% 3 m
10
2.2. Monitored Hydroelectric Reservoirs in Brazil
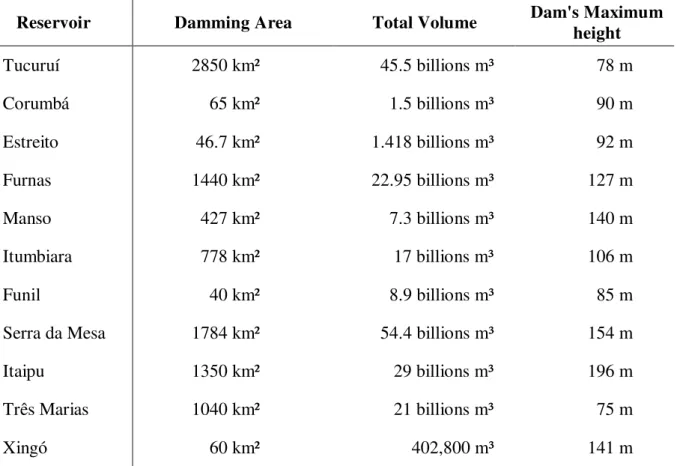
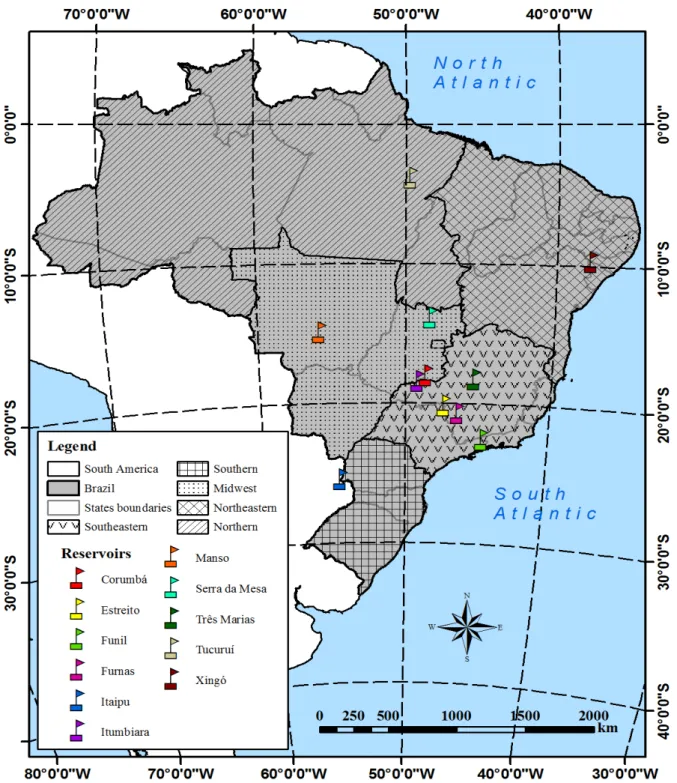
So far 11 hydroelectric reservoirs are being monitored using the SIMA buoy. The characteristics from each reservoir are described in Table 2. Figure 2 shows the location of each SIMA in Brazilian reservoirs.
Table 2. Hydroelectric reservoirs monitored using the SIMA buoy.
Reservoir Damming Area Total Volume Dam's Maximum height
Tucuruí 2850 km² 45.5 billions m³ 78 m
Corumbá 65 km² 1.5 billions m³ 90 m
Estreito 46.7 km² 1.418 billions m³ 92 m
Furnas 1440 km² 22.95 billions m³ 127 m
Manso 427 km² 7.3 billions m³ 140 m
Itumbiara 778 km² 17 billions m³ 106 m
Funil 40 km² 8.9 billions m³ 85 m
Serra da Mesa 1784 km² 54.4 billions m³ 154 m
Itaipu 1350 km² 29 billions m³ 196 m
Três Marias 1040 km² 21 billions m³ 75 m
Xingó 60 km² 402,800 m³ 141 m
The first reservoir monitored was Tucuruí and the last SIMA installed was in Xingó (see Figure 2 for location). The first reservoir is located in the Brazilian Amazonian region and the last is in the Brazilian Scrub Savanna in the Northeast. The Itumbiara hydroelectric reservoir is located in an area between Minas Gerais and Goiás States (Central Brazil) that was originally covered by tropical grassland savanna. The damming of the Parnaiba River flooded its main tributaries: the Araguari and Corumbá Rivers. The basin’s geomorphology resulted in
a lake with a dendritic pattern covering an area of approximately 814 km² and a volume of 17.03 billion m³ (Alcântara et al., 2010a).
The Serra da Mesa Reservoir is located in the Upper Tocantins River Basin, northern Goiás State. The Serra da Mesa Reservoir is the largest in Brazil in terms of water volume flow. During maximum flow the reservoir contains 54.4 billion m3 and measures 1,784 km2 (Guimarães et al., 2004).
Tucuruí reservoir is located in Pará State, North Brazil and was created in November 1984 by damming the Tocantins River. The main purpose of the reservoir is hydroelectricity, although it has multiple uses, such as flood control, fisheries, and recreation. It is one of the largest reservoirs in the Amazon Basin (Novo et al., 2002).
11
Figure 2: Location of the hydroelectric reservoirs monitored in Brazil.
12
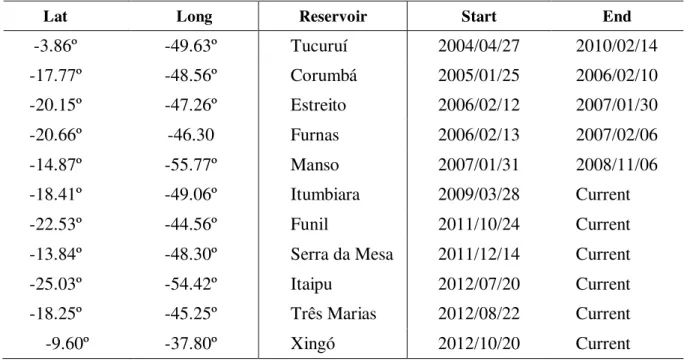
Table 3: Time series data available for each monitored hydroelectric reservoir.
Lat Long Reservoir Start End
-3.86º -49.63º Tucuruí 2004/04/27 2010/02/14
-17.77º -48.56º Corumbá 2005/01/25 2006/02/10
-20.15º -47.26º Estreito 2006/02/12 2007/01/30
-20.66º -46.30 Furnas 2006/02/13 2007/02/06
-14.87º -55.77º Manso 2007/01/31 2008/11/06
-18.41º -49.06º Itumbiara 2009/03/28 Current
-22.53º -44.56º Funil 2011/10/24 Current
-13.84º -48.30º Serra da Mesa 2011/12/14 Current
-25.03º -54.42º Itaipu 2012/07/20 Current
-18.25º -45.25º Três Marias 2012/08/22 Current
-9.60º -37.80º Xingó 2012/10/20 Current
2.3. Data Base with web access
All time series collections are recorded in a data base with a web access. Through use of this web tool, it is possible to see data by time series, by buoy, by environmental parameter, and by time (see Figure 3). The user can also see basic statistical manipulation of the collected data. It is also possible to download selected data in a .csv format. The web platform can be accessed at <http://www.dsr.inpe.br/hidrosfera/sima/en/index.php>.
Figure 3: Web platform developed to record the time series.
13
2.4. Data Processing
Two approaches were applied in order to overcome the problem of missing data in the time series: first, a simple moving average technique was used to fill small gaps (Box and Jenkins, 1994); second, during long periods of system malfunction, a synthetic series of data was computed by combining and averaging the available data.
For the majority of observations in the series, the synthetic time series can be considered as a four-year daily mean. The authors are aware that this approach precludes the understanding of the inter-annual variability; but, on the other hand, it allows for the analysis of a continuous series (Hipel and McLeod, 1994). However, the data available to researchers is original and unprocessed.
2.5. Observed Problems in the Time Series
The main problems observed occur with sensors and satellites. The sensors problems are due to the environmental characteristics of each water body. In acidic waters, water quality sensors rapidly degrade, rendering the collected data invalid. Infestation of periphyton in sensors is another problem.
The SIMA buoy collects data every hour, i.e., 24 readings per day. However, not all readings are received because the system requires satellites to be over the buoy antenna to complete the data transfer and, due to the positioning of some satellites, this does not occur long enough at some locations inland to complete all transmissions. This is most often the cause of missing data in the time series.
3. RESULTS AND DISCUSSION
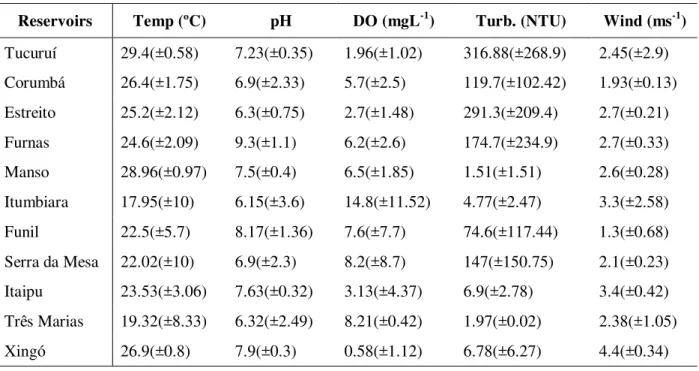
The basic statistics for each reservoir for selected parameters are shown in Table 4. The table shows the mean and the standard deviation values for the entire period of operation of each reservoir. The Tucuruí reservoir has the warmest surface water and Itumbiara coldest. Table 4:Basic statistics (mean and standard deviation) for each reservoir. “Temp” is the water surface temperature; “pH” is the hydrogenionic potential; “DO” is the dissolved oxygen; “Turb” is the turbidity and “Wind” is the wind velocity.
Reservoirs Temp (ºC) pH DO (mgL-1) Turb. (NTU) Wind (ms-1)
Tucuruí 29.4(±0.58) 7.23(±0.35) 1.96(±1.02) 316.88(±268.9) 2.45(±2.9) Corumbá 26.4(±1.75) 6.9(±2.33) 5.7(±2.5) 119.7(±102.42) 1.93(±0.13)
Estreito 25.2(±2.12) 6.3(±0.75) 2.7(±1.48) 291.3(±209.4) 2.7(±0.21)
Furnas 24.6(±2.09) 9.3(±1.1) 6.2(±2.6) 174.7(±234.9) 2.7(±0.33)
Manso 28.96(±0.97) 7.5(±0.4) 6.5(±1.85) 1.51(±1.51) 2.6(±0.28)
Itumbiara 17.95(±10) 6.15(±3.6) 14.8(±11.52) 4.77(±2.47) 3.3(±2.58)
Funil 22.5(±5.7) 8.17(±1.36) 7.6(±7.7) 74.6(±117.44) 1.3(±0.68)
Serra da Mesa 22.02(±10) 6.9(±2.3) 8.2(±8.7) 147(±150.75) 2.1(±0.23)
Itaipu 23.53(±3.06) 7.63(±0.32) 3.13(±4.37) 6.9(±2.78) 3.4(±0.42)
Três Marias 19.32(±8.33) 6.32(±2.49) 8.21(±0.42) 1.97(±0.02) 2.38(±1.05)
14
On average, the pH of Itumbiara, Serra da Mesa and Três Marias is acidic, and the other reservoirs are alkaline. The highest values of DO are found in Itumbiara reservoir and the lowest in the Tucuruí reservoir. Tucurí also has the highest turbidity value and Manso reservoir the lowest. The highest mean value of wind velocity was observed in Xingó reservoir and the lowest in Funil reservoir.
3.1. Time Series Examples
With this continuously collected data procedure it is possible to obtain a time series of meteorological and limnological data of each monitored reservoir. As example, the Figure 4 shows the time series of the Itumbiara reservoir (see Figure 2 for location). In this example, the passage of a cold front was identified.
Figure 4: Meteorological and limnological time series data of Itumbiara reservoir: (a) stick plot of wind velocity (ms-1), (b) air minus water temperature (ºC); (c) wind intensity (ms-1),
(d) air temperature (ºC), (e) water temperature; (f) relative humidity (%), (g) atmospheric pressure (mb) collected by the SIMA buoy from May 31st to June 06th 2009. Source:
15
It is clear that during the passage of the cold front the atmospheric pressure and the air temperature decrease; the wind and relative humidity show a slight increase. The surface temperature of the water decreases after the passage of the cold front.
As per Alcântara et al. (2010b), the passage of cold front over a region decreases atmospheric pressure and air temperature, enhancing relative humidity. With the formation of cloud cover, long-wave radiation increases and transfers heat by turbulent convection to the water surface. The sensible flux presents small variability but an increase occurs due to convective turbulence caused by the front’s passage; concurrently, the latent flux decreases, though not enough to cause condensation, only evaporation decreases. These occurences are responsible for the continuing loss of heat after the cold front’s passage.
This type of continuous data offers many opportunities for potential analyses, and some commonmethods of analysis are: Fourier Power Spectrum (Press et al. 1992), Wavelet Analysis (Torrence and Compo, 1998) and Cross Wavelet and Coherence and Phase (Grinsted et al. 2004).
4. CONCLUSIONS
A long-term, system for the continuous collection and satellite transmission of both meteorological and limnological data was discussed. A database with web access that has the capacity to display and download any of the time series data was also discussed.
This system allows any researcher to access the database from any location by use of the Internet. All stored data is backed-up on the local server. This initiative will enhance limnological studies in the involved reservoirs as the time series data will enhance understanding of environmental dynamics. It is best if the data is analyzed seasonally to allow researchers a preview diagnostic of the study area before prospective field trips.
Ecological models which use hydrodynamic approaches also require these long time series data as inputs for the models, in order to analyze the influence of meteorological parameters in the water column as well as in water quality.
The SIMA technology is a promising approach to assist researchers in monitoring water quality as well as to identify and explain how meteorological parameters can affect water column stability.
5. REFERENCES
ALCÂNTARA, E.; STECH, J.; LORENZZETTI, J.; BONNET, M.; CASAMITJANA, X.; ASSIREU, A. et al. Remote sensing of water surface temperature and heat flux over a tropical hydroelectric reservoir. Remote Sensing of Environment, v. 114, n. 11, p. 2651-2665, 2010a. http://dx.doi.org/10.1016/j.rse.2010.06.002
ALCÂNTARA, E.; BONNET, M.-P.; ASSIREU, A. T.; STECH, J. L.; NOVO, E. M. L. M.; LORENZZETTI, J. A. On the water thermal response to the passage of cold fronts: initial results for Itumbiara reservoir (Brazil). Hydrology and Earth System Sciences Discussions, v. 7, n. 6, p. 9437-9465, 2010b. http://dx.doi.org/10.5194/hessd-7-9437-2010
16
CASAMITJANA, X.; SERRA, T.; COLOMER, J.; BASERBA, C.; PÉREZ-LOSADA, J. Effects of the water withdrawal in the stratification patterns of a reservoir.
Hydrobiologia, v. 504, n. 1/3, p. 21-28, 2003. http://dx.doi.org/10.1023/ B:HYDR.0000008504.61773.77
CHORUS, I.; BARTRAM, J. (Ed.). Toxic Cyanobacteria in water: a guide to their public health consequences, monitoring and management. London: UNESCO/WHO/UNEP, 1999.
GLASGOW, H. B.; BURKHOLDER, J. M.; REED, R. E.; LEWITUS, A. J.; KLEINMANN, J. E. Real-time remote monitoring of water quality: a review of current applications, and advancements in sensor, telemetry, and computing technologies. Journal of Experimental Marine Biology and Ecology, v. 300, n. 1/2, p. 409-448. 2004. http://dx.doi.org/10.1016/j.jembe.2004.02.022
GRINSTED, A.; MOORE, J. C.; JEVREJEVA, S. Application of the cross wavelet transform and wavelet coherence to geophysical time series. Non. Lin. Proc. Geophy. 11, 561-566, 2004. http://dx.doi.org/10.5194/npg-11-561-2004
GUIMARÃES, A. E.; GENTILE, C.; ALENCAR, J.; LOPES, C. M.; MELLO, R. P. Ecology of Anopheline (Diptera, Culicidae), malaria vectors around the Serra da Mesa Reservoir, State of Goiás, Brazil. 1 Frequency and climatic factors. Cadernos de Saúde Pública, v. 20, n. 1, p. 291-302, 2004. http://dx.doi.org/10.1590/S0102-311X 2004000100047
HIPEL, K. W.; MCLEOD, A. I. Time series modeling of water resources and environmental systems. Amsterdam: North-Holland, 1994.
JEROSCH, K.; SCHLÜTER, M.; PESCH, R. Spatial analysis of marine categorical information using indicator kriging applied to georeferenced video mosaics of the deep-sea Håkon Mosby Mud Volcano. Ecological Informatics, v. 1, n. 4, p. 391-406, 2006. http://dx.doi.org/10.1016/j.ecoinf.2006.05.003
JOHNSON, M. S.; LEHMANN, J.; RIHA, S. J.; KRUSCHE, A. V.; RICHEY, J. E.; OMETTO, J. P. et al. CO2 efflux from Amazonian headwater streams represents a significant fate for deep soil respiration. Geophysical Research Letters, v. 35, n.17, p. 1–5, 2008. http://dx.doi.org/10.1029/2008GL034619
KELMAN, J.; PEREIRA, M. V. F.; ARARIPE NETO, T. A.; SALES, P. R. H. Hidreletricidade. In: REBOUÇAS, A. C.; BRAGA, B.; TUNDISI, J. G. (Eds.). Águas doces no Brasil. São Paulo: Escrituras, 2002.
NOVO, E. M. L. M.; COSTA, M. P. F.; MANTOVANI, J. E.; LIMA, I. B. T. Relationship between macrophyte stand variables and radar backscatter at L and C band, Tucuruí reservoir, Brazil. International Journal of Remote Sensing, v. 23, n. 7, p. 1241-1260, 2002. http://dx.doi.org/10.1080/01431160110092885
ROLAND, F.; HUSZAR, V. L. M.; FARJALLA, V. F.; ENRICH-PRAST, A.; AMADO, A.M.; OMETTO, J. P. H. B. Climate change in Brazil: perspective on the biogeochemistry of inland waters. Brazilian Journal of Biology. v. 72, n. 3, p. 709–
17
ROSA, L. P.; SANTOS, M. A.; MATIVIENKO, B.; SANTOS, E. O.; SIKAR, E. Greenhouse gas emissions from hydroelectric reservoirs in tropical regions. Climatic Change, v. 66, p. 9-21, 2004. http://dx.doi.org/10.1023/B:CLIM.0000043158.52222.ee
STECH, J. L.; LIMA, I. B. T.; NOVO, E. M. L. M.; SILVA, C. M.; ASSIREU, A. T.; LORENZZETTI, J. A. et al. Telemetric monitoring system for meteorological and limnological data acquisition. Verhandlungen Internationalen Verein Limnologie, v. 29, p. 747-1750, 2006.
TORRENCE, C.; COMPO, G. P. A practical guide to wavelet analysis. Bulletin of the American Meteorological Society, v. 79, p. 61-78, 1998. http://dx.doi.org/10.1175/ 1520-0477(1998)079%3C0061:APGTWA%3E2.0.CO;2
TUNDISI, J. G. Tropical South America: presents and perspectives: In: MARGALEF, R. (Ed.). Limnology now: a paradigm of planetary problems. Amsterdan: Elsevier Science, 1994.
TUNDISI, J. G.; MATSUMURA-TUNDISI, T.; ARANTES JUNIOR, J. D.; TUNDISI, J. E. M.; MANZINI, N. F.; DUCROT, R. The response of Carlos Botelho (Lobo, Broa) Reservoir to the passage of cold fronts as reflected by physical, chemical and biological variables. Brazilian Journal of Biology, v. 64, p. 177–186, 2004. http://dx.doi.org/10.1590/S1519-69842004000100020
TUNDISI, J. G.; MATSUMURA-TUNDISI, T.; PERIOTTO, N. A. Exergy and ecological services in reservoirs. Brazilian Journal of Biology, v. 72, n. 4, p. 979, 2012. http://dx.doi.org/10.1590/S1519-69842012000500032
VALÉRIO, A. M.; KAMPEL, M.; ASSIREU, A. T.; STECH, J. L. The asymmetric fragmentation operator applied to meteo-limnological time series in a tropical reservoir.