Genetic Variation in
ATP5O
Is Associated with Skeletal
Muscle
ATP50
mRNA Expression and Glucose Uptake in
Young Twins
Tina Ro¨nn1*, Pernille Poulsen2, Tiinamaija Tuomi3,4,5, Bo Isomaa3,5,6, Leif Groop1,3, Allan Vaag1,2, Charlotte Ling1
1Department of Clinical Sciences, Diabetes and Endocrinology Research Unit, CRC Malmo¨ University Hospital, Lund University, Malmo¨, Sweden,2Steno Diabetes Center, Gentofte, Denmark,3Department of Medicine, University of Helsinki, Helsinki, Finland,4Department of Medicine, Helsinki University Central Hospital, Helsinki, Finland,
5Genetic Institute, Folkha¨lsan Research Center, Helsinki, Finland,6Malmska Municipal Health Center and Hospital, Jakobstad, Finland
Abstract
Background: Impaired oxidative capacity of skeletal muscle mitochondria contribute to insulin resistance and type 2 diabetes (T2D). Furthermore, mRNA expression of genes involved in oxidative phosphorylation, includingATP5O, is reduced in skeletal muscle from T2D patients. Our aims were to investigate mechanisms regulatingATP5Oexpression in skeletal muscle and association with glucose metabolism, and the relationship betweenATP5Osingle nucleotide polymorphisms (SNPs) and risk of T2D.
Methodology/Principal Findings:ATP5OmRNA expression was analyzed in skeletal muscle from young (n= 86) and elderly (n= 68) non-diabetic twins before and after a hyperinsulinemic euglycemic clamp. 11 SNPs from theATP5Olocus were genotyped in the twins and a T2D case-control cohort (n= 1466). DNA methylation of theATP5Opromoter was analyzed in twins (n= 22) using bisulfite sequencing. The mRNA level ofATP5Oin skeletal muscle was reduced in elderly compared with young twins, both during basal and insulin-stimulated conditions (p,0.0005). The degree of DNA methylation around the transcription start ofATP5Owas,1% in both young and elderly twins and not associated with mRNA expression (p= 0.32). The mRNA level of ATP5O in skeletal muscle was positively related to insulin-stimulated glucose uptake (regression coefficient = 6.6;p= 0.02). Furthermore, two SNPs were associated with both ATP5OmRNA expression (rs12482697: T/T versus T/G;p= 0.02 and rs11088262: A/A versus A/G;p= 0.004) and glucose uptake (rs11088262: A/A versus A/G;p= 0.002 and rs12482697: T/T versus T/G;p= 0.005) in the young twins. However, we could not detect any genetic association with T2D.
Conclusions/Significance:Genetic variation and age are associated with skeletal muscle ATP5O mRNA expression and glucose disposal rate, suggesting that combinations of genetic and non-genetic factors may cause the reduced expression of ATP5O in T2D muscle. These findings propose a role for ATP5O, in cooperation with other OXPHOS genes, in the regulation ofin vivoglucose metabolism.
Citation:Ro¨nn T, Poulsen P, Tuomi T, Isomaa B, Groop L, et al. (2009) Genetic Variation inATP5OIs Associated with Skeletal MuscleATP50mRNA Expression and Glucose Uptake in Young Twins. PLoS ONE 4(3): e4793. doi:10.1371/journal.pone.0004793
Editor:Maurizio Capogrossi, Istituto Dermopatico dell’Immacolata, Italy
ReceivedSeptember 21, 2008;AcceptedJanuary 22, 2009;PublishedMarch 10, 2009
Copyright:ß2009 Ro¨nn et al. This is an open-access article distributed under the terms of the Creative Commons Attribution License, which permits unrestricted use, distribution, and reproduction in any medium, provided the original author and source are credited.
Funding:This study was supported by grants from the Danish Medical Research Council, Danish Diabetes Association, Region Ska˚ne, Malmo¨ University Hospital, Knut and Alice Wallenberg Foundation, Swegene, the Diabetes Programme at Lund University, Novo Nordisk, Crafoord, Hedlund, Bergvall, Wiberg, Pa˚hlsson, Hains, Lundberg, Exgenesis and Linne´ grant (B31 5631/2006) and grant 522-2006-6480 from the Swedish Research Council. The funders had no role in study design, data collection and analysis, decision to publish, or preparation of the manuscript.
Competing Interests:The authors have declared that no competing interests exist. * E-mail: [email protected]
Introduction
Insulin resistance in skeletal muscle increases with age and during the course of type 2 diabetes mellitus (T2D). Reduced expression of genes from the respiratory chain in the mitochondria may cause impaired oxidative capacity in skeletal muscle which, in turn, has been suggested to contribute to insulin resistance [1]. Indeed, a number of studies have found reduced levels of genes involved in oxidative phosphorylation (OXPHOS) in parallel with increased insulin resistance in skeletal muscle from patients with T2D [2–5] and from elderly subjects [6–8]. Moreover, recent studies from our group showed positive associations between gene
expression of the respiratory chain components NDUFB6 and COX7A1, respectively, and insulin stimulated glucose uptakein vivo [7,8]. Interestingly, a mRNA expression profile performed in our laboratory showed thatATP5Owas the most significantly reduced OXPHOS gene in skeletal muscle from patients with T2D compared with healthy control subjects (p= 0.0027) [3]. However, the cause of this reduction inATP5Oremains unknown.
respiratory chain, which consists of five multiprotein complexes. ATP5O is a nuclear encoded subunit of complex V of the respiratory chain i.e. ATP synthase. It is located in the stalk of the ATP synthase complex where it appears to connect the catalytic core (F1subunit) and the membrane proton channel (F0subunit), thereby influencing transmission of conformational changes and proton conductance [10].
The aims of the present study were to investigate 1) the mechanisms regulatingATP5Oexpression in skeletal muscle and 2) if single nucleotide polymorphisms (SNPs) inATP5Oare associated with increased risk of T2D.
Materials and Methods Participants
Twins. Individuals were identified through The Danish Twin Register [11] and their clinical characteristics are described in Table 1. Selection criteria for the young and elderly twins, all non-diabetic, have been previously described [6,11,12].
The Botnia study. This is a family based study established in 1990 aiming at the identification of T2D susceptibility genes [13]. 1461 unrelated individuals from the Botnia study were included in the present study, 751 of whom have been diagnosed with T2D .35 years of age and 709 non-diabetic controls without first degree relatives with T2D (Table 1). Subjects were classified into different stages of glucose tolerance based on an oral glucose tolerance test (OGTT). Individuals with genetically verified Maturity Onset Diabetes of the Young (MODY) or GAD antibody-positive patients were excluded from the study.
All studies were approved by the regional Ethics Committees and conducted according to the Helsinki Declaration. Written consent was obtained from all participants apart from a subset that was enrolled in the Botnia study in the early 90’s when only verbal informed consent was obtained.
Clinical examination
Each twin pair simultaneously underwent a 2-day clinical examination. The subjects were instructed to restrain from strenuous physical activity for 24 h and to fast overnight (10– 12 h) before examination. Anthropometric measures (weight, height, BMI and waist to hip ratio) were performed as previously described [14]. Body composition (lean body mass [LBM] and fat mass) was determined by DEXA scanning. The subjects underwent a 2-hour hyperinsulinemic euglycemic clamp (40 mU m22min21) combined with indirect calorimetry during the basal and insulin-stimulated steady state periods as previously described [14]. Metabolic rates (e.g. glucose disposal rate) were calculated as previously reported and expressed as mg?(kg
LBM)21?min21 [15]. Plasma glucose and insulin concentrations were analyzed as previously described [11].
Analysis of ATP5O mRNA levels in skeletal muscle Muscle biopsies were obtained from the vastus lateralis muscle from the twins during both basal and insulin-stimulated states. Total RNA was extracted using Tri Reagent kit (Sigma-Aldrich, St. Louise, MO, USA) and cDNA was synthesized using Superscript II RNase H2 Reverse Transcriptase and random hexamer primers (Invitrogen, Carlsbad, CA, USA). ATP5O mRNA levels were quantified using TaqMan Real-Time PCR with an ABI 7900 system (Applied Biosystems, Foster City, CA, USA) using probe and primer pair specific forATP5O covering exon boundary 4–5 (Assays-on-demands, Hs00426889_m1, Ap-plied Biosystems). For the probe/primer set a standard curve was generated that was confirmed to increase linearly with increasing amounts of cDNA. Each sample was run in duplicates and the transcript quantity was normalized to the mRNA level of cyclophilin A (4326316E, Applied Biosystems), which expression was tested to not be affected by age.
Genotyping
Genomic DNA was extracted from blood using conventional methods. Genotype data covering the ATP5O locus (chr21:34230028–34187627, 20 kb upstream and 10 kb down-stream of the ATP5O gene transcript, Fig. 1) was downloaded from the International HapMap project (last accessed March 2008) [16] for the CEPH (Utah residents with ancestry from northern and western Europe) population. 33 SNPs with minor allele frequency .1% were found. Linkage disequilibrium (LD) structure between these SNPs was analyzed using Haploview [17] and 11 tag SNPs [18] were selected such that all alleles are correlated at an r2.0.9 (Fig. 1). These SNPs were genotyped using iPLEXTM assays and matrixassisted laser desorption/ ionization time-of-flight (MALDI-TOF) mass spectrometry on the MassARRAYH system (Sequenom, San Diego, CA, USA) in the Swegene laboratory in Malmo¨. 3 SNPs failed this method and were analyzed by allelic discrimination using TaqManH SNP Genotyping Assays on the ABI7900 (Applied Biosystems). Primer sequences and additional genotyping details are available from the authors.
DNA Methylation
Genomic DNA was isolated from muscle biopsies at the same time as RNA using the Tri Reagent kit according to the manufacturer’s instructions (Sigma-Aldrich). DNA bisulfite mod-ification was accomplished on DNA from 11 young and 11 elderly
Table 1.Clinical characteristics of participants.
Young Twins Elderly Twins Botnia T2D Cases Botnia Controls
n(male/female) 110 (60/50) 86 (38/48) 751 (399/352) 709 (344/365)
n(MZ/DZ) 110 (66/44) 86 (42/44)
Age (years) 28.061.9 62.462.0* 54.569.4 53.5611.5
BMI (kg/m2) 24.1
63.1 26.164.4* 28.964.8 25.963.8* Glucose uptake (mg?kg LBM21?min21) 11.7
63.2 9.963.3*
Fasting plasma glucose (mmol/l) 9.163.2 5.360.5*
Data are expressed as means6SD. DZ, dizygotic; MZ, monozygotic; LBM, lean body mass.
*p ,0.05.
twins using the EZ DNA methylation kit (Zymo Research, Orange, CA, USA). Bisulfite modified DNA was amplified with primers designed using the program MethPrimer [19], forward primer: 59 -TTGGTTAGTAATAATGATTTTATTTTTAGA -39 and re-verse primer 59- CTAACTCTCAAAACCACCTTTCTCT -39. A second, semi-nested PCR was performed using the forward primer 59 GAGGGTTTAGTTTTTATTATTGTTAAGAAT -39(same reverse). The resulting amplicon is 249 basepairs long and includes 19 possible DNA methylation (CpG) sites. This region, which is located within a CpG island, surrounds the ATP5O transcription start site (TSS) including the beginning of exon 1 (293 to+156 in relation to TSS). The PCR products were cloned into plasmid vectors (pCRH4-TOPOH, Invitrogen), furtherE. coliwere transformed and DNA from 10 colonies of each individual muscle sample were isolated (QIAprep 8 Miniprep Kit, Qiagen Inc., Valencia, CA, USA). The individual clones were sequenced and the number of methylated sites was determined using BiQ Analyzer [20]. The sequences from all 22 individuals comprised of data from 8–10 clones. The proportion of methylation for each individual was calculated by dividing the total number of methylated sites in all clones by the total number of possible methylation sites.
Statistical methods
Generalized estimating equations. Conventional tests of differences between variable (y) means are not valid for twin data due to the strong intrapair correlation. Generalized estimating equations (GEE) methodology (y =a+bx) was used to correct for this dependence and provide valid standard errors for the b -coefficients [21,22]. All observations were used for estimation of theb-coefficient, whereas the variance ofbwas calculated using each twin pair as one cluster.
Linear regression. To identify factors independently associated with the response variable, we used backward-elimination multivariate regression analysis with p.0.05 as the defining criteria for exclusion of model terms. GEE methodology was used to obtain valid tests.
Biometric modeling. Intra-class correlations, a method to measure resemblance within twin pairs [23], were calculated for ATP5O mRNA expression in monozygotic (MZ) and dizygotic (DZ) twin pairs. The degree of genetic and environmental influence of a phenotypic variable can be estimated using biometric modeling as previously described [24]. The models tested included the following parameters: genetic variance due to additive genetic effects (VA) or dominant genetic effects (VD) and environmental variance due to an individual environment not shared with co-twin (VE) or a common environment shared among co-twins (VC). Heritability gives the proportion of the total variation (VT) of a trait attributable to additive genetic variation (VA). We used the MX software package, a programme for linear
structural equation modeling, to estimate the variance components and to compare the different models. Biometric modeling was conducted separately in the two age groups. The fit of each model was assessed by maximum-likelihood methods and resulted in ax2 goodness of fit index and probability value that tested the agreement between the observed and the predicted statistics. A small goodness of fit x2 value, a high p-value and a low AIC (Akaike’s information criterion), which equals thex2
value minus 2 times the degree of freedom, indicates good correspondence and were used in comparisons of each model leading to a best fitting model.
Association between genetic variation in theATP5Ogene and type 2 diabetes. The Genetic Power Calculator [25] was used to calculate power for detection of association between SNPs in theATP5Ogene region and T2D. With a minor allele frequency of 5%, a T2D frequency of 6% and a relative risk of 1.3 ata= 0.05 we have 38% power using a dominant model in the Botnia case control study. Association of individual SNPs with T2D was determined by logistic regression adjusted for BMI, sex and age-at-onset (cases) or age-at-visit (controls), assuming an additive model. Hardy Weinbergp-value, LD and haplotype block structure were calculated using Haploview [17].
DNA methylation. Power to detect differences in DNA methylation in our study was calculated to 53.8% (a= 0.05) using DSS research statistical power calculator (www.dssresearch.com; Fort Worth, TX, USA).
Results
Age is associated with reduced skeletal muscle ATP5O mRNA expression levels
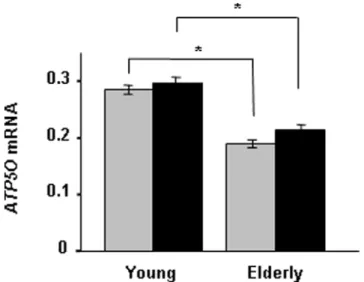
The influence of age on ATP5O mRNA expression was investigated in skeletal muscle biopsies taken from young and elderly twins, before and during a hyperinsulinemic euglycemic clamp. The mRNA level of ATP5O was reduced in elderly compared with young twins, both at the basal (0.1960.007 versus 0.2860.008;p,0.0005) and insulin-stimulated (0.2160.009 versus 0.3060.01;p,0.0005) state (Fig. 2).
Heritability of skeletal muscle ATP5O mRNA expression The degree of genetic and environmental influence on skeletal muscle ATP5O expression was estimated in young and elderly twins by means of intra-class correlations and biometric modeling. In the young twins, the intra-class correlation for skeletal muscle ATP5Oexpression was higher in MZ (0.77) as compared to DZ (0.34) with a heritability of 77% (Table 2). In contrast, intra-class correlations for skeletal muscleATP5Oexpression were similar in elderly MZ and DZ twins, and explained by a combination of shared (41%) and unique (59%) environmental factors (Table 2).
Genetic variation is associated with ATP5O mRNA expression in muscle of young twins
In order to evaluate the genetic factors influencing ATP5O expression in muscle of the young twins, 11 tag SNPs (Fig. 1) were genotyped and related to gene expression. Two polymorphisms, rs12482697 and rs11088262, influenced the expression ofATP5O in muscle of the young twins (rs12482697: T/T [n= 65] 0.3060.010 versus T/G [n= 16] 0.2560.012; p= 0.02 and rs11088262: A/A [n= 70] 0.3160.012 versus A/G [n= 16] 0.2560.011; p= 0.004) during the clamp (Fig. 3A). These two polymorphisms are likely to represent the same association, as they show strong LD (r2= 0.96). rs12482697 is located 5 kb upstream from transcription start whereas rs11088262 is a missense polymorphism in exon 4. However, none of the other SNPs were
Figure 1. Chromosomal position of ATP5O and location of analyzed SNPs.
associated with ATP5O expression in skeletal muscle (data not shown).
DNA methylation in the ATP5O promoter
We also tested if DNA methylation around the transcription start ofATP5O may influence the mRNA expression in skeletal muscle. The degree of DNA methylation was low in both young (0.1460.07%;n= 11) and elderly (0.7360.33%;n= 11) twins and there was no significant difference between the two age-groups (p= 0.16). Of note, eight young and six elderly twins showed no methylation at all of this DNA sequence. Furthermore, we could not observe any significant correlation between ATP5O DNA methylation and mRNA expression (r= 0.24;p= 0.32).
Additional factors associated with ATP5O expression in skeletal muscle
To examine if additional factors are associated with ATP50 expression in muscle a multivariate regression analysis was performed including the following parameters as explanatory
variables: basal and insulin-stimulated skeletal musclePGC-1aand PGC-1b mRNA expression, birth weight, age, sex, BMI and zygosity (Table S1). The final model was reached using backward selection regression. ATP5O expression was positively related to insulin-stimulated PGC-1a expression (regression coeffi-cient = 0.082,p= 0.0001) and inversely related to age (regression coefficient =20.001, p= 0.0001) and female sex (regression coefficient =20.043,p= 0.001).
Impact of ATP5O on in vivo glucose uptake
Oxidative capacity has been suggested to influence insulin sensitivity. We therefore performed a regression analysis to test if ATP5O expression in skeletal muscle is related toin vivo insulin stimulated glucose uptake in young and elderly twins (n= 155). The following variables were included in the regression model: ATP5O mRNA expression, zygosity, birth weight, age, sex and BMI. Indeed, the mRNA level ofATP5Owas positively related to glucose uptake (regression coefficient = 6.6; p= 0.02). Further-more, since rs11088262 and rs12482697 influenced the expression level ofATP5Oin skeletal muscle of the young twins, we tested if these polymorphisms also were associated with glucose uptake. Both rs11088262 and rs12482697 showed association with insulin-stimulated glucose uptake in the young twins (rs11088262: A/A [n= 85] 12.260.4 versus A/G [n= 18] 9.860.5; p= 0.002 and rs12482697: T/T [n= 79] 12.160.36 versus T/G [n= 18] 9.860.6;p= 0.005,Fig. 3B), but not in elderly twins.
ATP5O polymorphisms and risk of T2D
11 common variants in theATP5Ogene region were genotyped in the Botnia case-control cohort in order to assess association to T2D. None of the SNPs showed significant association to T2D (Table S2).
Discussion
The key findings of the present study were that genetic variation in theATP5Ogene region is associated with mRNA expression in skeletal muscle and glucose uptake in young twins. Furthermore, aging proves to have a negative effect on ATP5O mRNA expression, which is in line with findings for other OXPHOS genes [7,8]. Also the positive correlation between the transcrip-tional co-activatorPGC-1aand OXPHOS genes previously shown [3] could be confirmed in our study.
ATP5O was selected for analysis in this study because it was previously shown to be the most strongly downregulated
Table 2.Heritability ofATP5OmRNA expression in skeletal muscle from 86 young and 69 elderly twins during clamp.
Best fitting biometric models Components of variance
Model
Additive genetic a2
Dominant genetic d2
Common environment c2
Unique environment e2
Young AE 0.77 (0.55–0.88) - - 0.23 (0.12–0.45)
Elderly CE - - 0.41 (0.09–0.065) 0.59 (0.35–0.91)
Intra-class correlations Young MZ Young DZ Elderly MZ Elderly DZ
ATP5Oclamp 0.77 (0.56–0.88) 0.34 (0.18–0.58) 0.50 (0.02–0.79) 0.55 (0.16–0.79)
Biometric modeling data are presented as proportion of total variance (95% CI).x2= 0.00,p= 1.00 and Akaike’s information criteria =22.00 for the goodness of fit tests forATP5Oexpression during clamp in both young and elderly twins.
Correlation coefficients (95% CI) are presented for the intra-class correlation ofATP5OmRNA.
AE, model of additive genetic and specific environment variance; CE, model of shared and specific environment variance; DZ, dizygotic; MZ, monozygotic. doi:10.1371/journal.pone.0004793.t002
Figure 2. Age associates with ATP5O mRNA expression in skeletal muscle from young (n= 86) and elderly (n= 69) twins. Presented values are ratios between the mRNA expression ofATP5O
and the endogenous control cyclophilin A, which was calculated for each sample and expressed as mean6SEM. Grey bars, before; and black bars, after a hyperinsulinemic euglycemic clamp. *p,0.05.
OXPHOS gene in diabetic muscle [3]. Furthermore, it encodes a component of ATP synthase, the complex in the respiratory chain responsible for the final step of ATP production. Including twins in the study design gives the opportunity to estimate the relative influence of genetic versus environmental components. Interest-ingly, the genetic influence on ATP5O mRNA expression estimated by both biometric modeling and intra-class correlation was not seen in the elderly subjects, which may suggest an accumulation of environmental factors with advancing age, which masks the genetic component contributing to the ATP5O expression demonstrated in young individuals.
Age is positively associated with insulin resistance and the prevalence of T2D. Furthermore, a correlation between insulin sensitivity and the oxidative capacity of skeletal muscle has been
reported [26]. The glucose disposal rate calculated from a hyperinsulinemic euglycemic clamp is a reliable measure of insulin sensitivity. In the present study, the ATP5O mRNA expression was reduced by one third in elderly compared to young twins, with a concomitant decrease in glucose uptake. This is in line with other reports suggesting that age has a strong influence on mitochondrial OXPHOS activity or OXPHOS gene expression as well as on insulin-stimulated glucose uptake in skeletal muscle [7,27–29]. To understand the mechanisms responsible for this decline it would be useful to relate mRNA expression to mitochondrial content and respiratory chain activity in forthcoming studies.
The association between two genetic variants (rs11088262 and rs12482697) and glucose uptake was only seen in young but not in elderly twins. This was in agreement with the heritability estimates, where the heritability of ATP5O mRNA expression was estimated to 77% in the young twins, but only environmental factors were found to influenceATP5Oexpression in the elderly twins. However, we could not find any genetic association betweenATP5OSNPs and T2D in our case control cohort. T2D is a result of several pathophysiological mechanisms, e.g. impaired insulin secretion and insulin resistance in the liver and peripheral tissues. Here we find in non-diabetic twins an association between SNPs and glucose uptake, whereas the T2D cases are characterized by a concert of different players where perhaps an insulin secretional defect may play the lead part and mask an association with insulin resistance. Also, this could be due to low power as we only had 38% power to detect an association using this design and recent genome-wide association studies suggest that very large cohorts are needed to detect modest association commonly seen for T2D [30]. To partially compensate for low power we also analyzed data from a genome-wide association scan performed by our laboratory [31] and a T2D meta-analysis [32] for this region of the ATP5O locus (chr21:34230028–34187627). A total number of 32 SNPs (including imputed data) were analyzed but none showed evidence for association with T2D.
In the promoter region of some but not all OXPHOS genes, increased DNA methylation in elderly subjects has been reported [7,8]. For PGC-1a, one of the master regulators of OXPHOS genes, there was no difference in the level of DNA methylation in skeletal muscle of young and elderly twins [7], but an increase was found in human pancreatic islets from T2D compared to islets from healthy organ donors [33]. With this background we wanted to investigate the level of DNA methylation in the ATP5O promoter region, but hardly any DNA methylation could be detected and there was no difference between the two age groups. In conclusion, both genetic variation and age were associated with skeletal muscle ATP5O mRNA expression and glucose disposal rate, suggesting that combinations of genetic and non-genetic factors may cause the reduced expression ofATP5O in T2D muscle. These findings propose a role for ATP5O, in cooperation with other OXPHOS genes, in the regulation ofin vivo glucose metabolism.
Supporting Information Table S1
Found at: doi:10.1371/journal.pone.0004793.s001 (0.03 MB DOC)
Table S2
Found at: doi:10.1371/journal.pone.0004793.s002 (0.04 MB DOC)
Figure 3. Two ATP5O SNPs are associated with both mRNA expression during clamp and insulin stimulated glucose uptake in young twins. Effects of rs12482697 respective rs11088262 on theATP50mRNA levels (a) and glucose uptake (mg?kg LBM21
?min21, b). Data are expressed as mean
Acknowledgments
We thank Eleftheria Zeggini, Laura J. Scott, Richa Saxena, Benjamin F. Voight for the Diabetes Genetics Replication And Meta-analysis (DIAGRAM) Consortium for sharing data. We also thank Marianne Modest, Emma Nilsson and Margareta Svensson for technical assistance and Peter Almgren for statistical advice.
Author Contributions
Conceived and designed the experiments: TR PP LCG AV CAL. Performed the experiments: TR CAL. Analyzed the data: TR CAL. Contributed reagents/materials/analysis tools: TR PP TT BI LCG AV CAL. Wrote the paper: TR PP LCG AV CAL.
References
1. Kelley DE, He J, Menshikova EV, Ritov VB (2002) Dysfunction of mitochondria in human skeletal muscle in type 2 diabetes. Diabetes 51: 2944–2950.
2. Huang X, Eriksson KF, Vaag A, Lehtovirta M, Hansson M, et al. (1999) Insulin-regulated mitochondrial gene expression is associated with glucose flux in human skeletal muscle. Diabetes 48: 1508–1514.
3. Mootha VK, Lindgren CM, Eriksson KF, Subramanian A, Sihag S, et al. (2003) PGC-1alpha-responsive genes involved in oxidative phosphorylation are coordinately downregulated in human diabetes. Nat Genet 34: 267–273. 4. Patti ME, Butte AJ, Crunkhorn S, Cusi K, Berria R, et al. (2003) Coordinated
reduction of genes of oxidative metabolism in humans with insulin resistance and diabetes: Potential role of PGC1 and NRF1. Proc Natl Acad Sci U S A 100: 8466–8471.
5. Sreekumar R, Halvatsiotis P, Schimke JC, Nair KS (2002) Gene expression profile in skeletal muscle of type 2 diabetes and the effect of insulin treatment. Diabetes 51: 1913–1920.
6. Ling C, Poulsen P, Carlsson E, Ridderstrale M, Almgren P, et al. (2004) Multiple environmental and genetic factors influence skeletal muscle PGC-1alpha and PGC-1beta gene expression in twins. J Clin Invest 114: 1518–1526. 7. Ling C, Poulsen P, Simonsson S, Ronn T, Holmkvist J, et al. (2007) Genetic and
epigenetic factors are associated with expression of respiratory chain component NDUFB6 in human skeletal muscle. J Clin Invest 117: 3427–3435. 8. Ronn T, Poulsen P, Hansson O, Holmkvist J, Almgren P, et al. (2008) Age
influences DNA methylation and gene expression of COX7A1 in human skeletal muscle. Diabetologia 51: 1159–1168.
9. DiMauro S, Schon EA (2003) Mitochondrial respiratory-chain diseases. N Engl J Med 348: 2656–2668.
10. Devenish RJ, Prescott M, Boyle GM, Nagley P (2000) The Oligomycin Axis of Mitochondrial ATP Synthase: OSCP and the Proton Channel. J Bioenerg Biomembr 32: 507–515.
11. Poulsen P, Levin K, Beck-Nielsen H, Vaag A (2002) Age-dependent impact of zygosity and birth weight on insulin secretion and insulin action in twins. Diabetologia 45: 1649–1657.
12. Poulsen P, Vaag A (2006) The intrauterine environment as reflected by birth size and twin and zygosity status influences insulin action and intracellular glucose metabolism in an age- or time-dependent manner. Diabetes 55: 1819–1825. 13. Groop L, Forsblom C, Lehtovirta M, Tuomi T, Karanko S, et al. (1996)
Metabolic consequences of a family history of NIDDM (the Botnia study): evidence for sex-specific parental effects. Diabetes 45: 1585–1593.
14. Poulsen P, Levin K, Petersen I, Christensen K, Beck-Nielsen H, et al. (2005) Heritability of insulin secretion, peripheral and hepatic insulin action, and intracellular glucose partitioning in young and old Danish twins. Diabetes 54: 275–283.
15. Vaag A, Alford F, Henriksen FL, Christopher M, Beck-Nielsen H (1995) Multiple defects of both hepatic and peripheral intracellular glucose processing contribute to the hyperglycaemia of NIDDM. Diabetologia 38: 326–336. 16. (2003) The International HapMap Project. Nature 426: 789–796.
17. Barrett JC, Fry B, Maller J, Daly MJ (2005) Haploview: analysis and visualization of LD and haplotype maps. Bioinformatics 21: 263–265. 18. de Bakker PI, Yelensky R, Pe’er I, Gabriel SB, Daly MJ, et al. (2005) Efficiency
and power in genetic association studies. Nat Genet 37: 1217–1223. 19. Li LC, Dahiya R (2002) MethPrimer: designing primers for methylation PCRs.
Bioinformatics 18: 1427–1431.
20. Bock C, Reither S, Mikeska T, Paulsen M, Walter J, et al. (2005) BiQ Analyzer: visualization and quality control for DNA methylation data from bisulfite sequencing. Bioinformatics 21: 4067–4068.
21. Liang KY, Zeger SL (1993) Regression analysis for correlated data. Annu Rev Public Health 14: 43–68.
22. Zeger SL, Liang KY (1986) Longitudinal data analysis for discrete and continuous outcomes. Biometrics 42: 121–130.
23. Neale MC, C L (1992) Data summary. In: Methodology for genetic studies of twins and families. Dordrecht, Boston, London: Kluwer Academic Publishers, NATO ASI series. pp 35–53.
24. Storgaard H, Poulsen P, Ling C, Groop L, Vaag AA (2006) Genetic and nongenetic determinants of skeletal muscle glucose transporter 4 messenger ribonucleic acid levels and insulin action in twins. J Clin Endocrinol Metab 91: 702–708.
25. Purcell S, Cherny SS, Sham PC (2003) Genetic Power Calculator: design of linkage and association genetic mapping studies of complex traits. Bioinformatics 19: 149–150.
26. Bruce CR, Anderson MJ, Carey AL, Newman DG, Bonen A, et al. (2003) Muscle oxidative capacity is a better predictor of insulin sensitivity than lipid status. J Clin Endocrinol Metab 88: 5444–5451.
27. Petersen KF, Befroy D, Dufour S, Dziura J, Ariyan C, et al. (2003) Mitochondrial dysfunction in the elderly: possible role in insulin resistance. Science 300: 1140–1142.
28. Trounce I, Byrne E, Marzuki S (1989) Decline in skeletal muscle mitochondrial respiratory chain function: possible factor in ageing. Lancet 1: 637–639. 29. Zahn JM, Sonu R, Vogel H, Crane E, Mazan-Mamczarz K, et al. (2006)
Transcriptional profiling of aging in human muscle reveals a common aging signature. PLoS Genet 2: e115.
30. Frayling TM, McCarthy MI (2007) Genetic studies of diabetes following the advent of the genome-wide association study: where do we go from here? Diabetologia 50: 2229–2233.
31. Saxena R, Voight BF, Lyssenko V, Burtt NP, de Bakker PI, et al. (2007) Genome-wide association analysis identifies loci for type 2 diabetes and triglyceride levels. Science 316: 1331–1336.
32. Zeggini E, Scott LJ, Saxena R, Voight BF, Marchini JL, et al. (2008) Meta-analysis of genome-wide association data and large-scale replication identifies additional susceptibility loci for type 2 diabetes. Nat Genet 40: 638–645. 33. Ling C, Del Guerra S, Lupi R, Ronn T, Granhall C, et al. (2008) Epigenetic