1. Paulista State University Júlio de M esquita Filho – Rio Claro/SP. Received in 30/6/05. Final version received in 3/10/05. Approved in 4/11/05. Correspondence to: Vanessa Santhiago, Av. José Ariano Rodrigues, 112, apto. 32, Jardim Ariano – 16400-400 – Lins, SP. E-mail: [email protected]. br
Physical training during nutritional recovery does
not affect the muscular glucose metabolism in rats
Vanessa Santhiago1, Adelino Sanchez Ramos da Silva1, Claudio Alexandre Gobatto1 and M aria Alice Rostom de M ello1
O
RIGINALA
RTICLEKeyw ords: Training. Protean malnutrition. Nutritional recovery.
ENGLISH VERSION
ABSTRACT
This study had the main aim to assess the food intake, the w eight gain, and the muscular glucose metabolism in rats submitted to aerobic training w hile recovering of protean malnutrition. For this, 60 male Wistar rats w ere separated in tw o groups: normoprotean (NP) and hypoprotean (HP), according to the diet: NP (17% pro-tein), or HP (6% propro-tein), respectively, w hich w as received after the ablactation (21 days) on their 90th day of life. Then, very animal received the NP diet, and they w ere submitted or not (trained – TRA; sedentary – SED) to physical training that consisted in run-ning on a treadmill for 25 m/min., 50 min/day for 5 days a w eek for 30 days, compounding the NP-SED, NP-TRA, HP/NP-SED, and HP/ NP-TRA groups. The glucose metabolism w as assessed in slices of the soleum muscle incubated in the presence of insulin (100 µU/L), and glucose (5.5 mM containing glucose [C14], and 2-deox-yglycose [H3]). The daily food intake (g/100 g of the body w eight) for the HP/NP-TRA group (24.39 ± 4.07) w as larger than the HP/ NP-SED group (21.62 ± 4.69). The w eight gain (g) w as similar in both groups HP/NP-TRA (203.80 ± 34.03) and HP/NP-SED (214.43 ± 30.54). There w as no difference betw een both groups in rela-tion to the follow ing parameters: glucose uptake and oxidarela-tion, and glycogen synthesis by the soleum muscle. Thus, it can be concluded that the aerobic training did not have any impact on the nutritional recovery, as there w as no metabolic or somatic differ-ences among recovered animals in the presence or absence of the training.
INTRODUCTION
Despite several studies have demonstrated that it is possible to produce sufficient food for the w hole w orld population, 826 mil-lion people continue suffering chronic malnutrition. Every year, 36 million people die as consequence of the starvation in the w orld(1). The protean malnutrition implies in several metabolic changes. Several studies on underfed children indicate a decrease in the glycemic levels and low hepatic glycogen content(2). The reestab-lishment of the metabolic variables during the nutritional recovery is slow. According to the literature, the physical exercise can achieve benefits to the nutritional recovery process. Upon the comparison of the grow th rhythm in children recovering from malnutrition in hospitals, it w as verified that the mild active chil-dren w ho participated in activities involving low energetic expen-diture presented more slim mass and had a faster grow th than those performing the hospitals’ standard procedure(3). Furthermore, it is w idely know n that the physical training causes an increase in the tissular glycogen reserves(4), and this can help to re-establish the underfed glycidic metabolism.
For obvious reasons, a great number of researches involving the protean malnutrition have been conducted in lab animals, es-pecially rats, once they present metabolic similarities to the hu-man beings. An experimental model of early chronic malnutrition that is highly accepted and w hich, in many aspects is similar to w hat happens among the Brazilian childish population is the food protean restriction(5). Nevertheless, as to the importance of the problem, there are few studies in the literature involving biochem-ical factors in underfed rats associated to the chronic physbiochem-ical ex-ercise.
Gobatto et al.(4) performed a three steps study the metabolic aspects in rats: protean restriction for 60 days follow ed by a 6 w eeks nutritional recovery, and the subsequent physical training constituted by 1 hour of sw imming sessions a day five days a w eek for seven w eeks. The authors verified that animals treated w ith the hypoprotean diet presented similar performance to the rats that w ere not submitted to the malnutrition, and the tissular glycogen stocks together w ith the blood lactate response to the acute exercise, as w ell as the seric substrate concentrations pre-sented similar values betw een trained groups, regardless their previous nutritional state.
Galdino et al.(2) assessed the effects of the intra-uterine and postnatal protean malnutrition up to the adult age (10 days) in the adaptations of the muscular glucose metabolism on the sw im-ming training. The authors verified an increase in the glucose up-take and in the content of muscular glycogen in trained animals. The glycogen synthesis has been reduced in sedentary underfed animals, but it w as restored in the exercised animals. The authors have concluded that the prolonged protean malnutrition did not damage the metabolic adaptations on training.
Papoti et al.(6) assessed the kinetics of the blood lactate in adult rats recovered from protean malnutrition during a sw imming exer-cise, through the determination of the maximal steady lactate phase. For this, each animal performed four sw imming tests for 20 minutes bearing overloads betw een 4.5 and 7.5% of their body w eight. The maximal steady lactate phase w as attained in the 5.5% load of the body w eight at the 5.5 and 4.7 nmol/I blood concentra-tion, respectively, to the control and recovered of underfeeding rats. These results led the authors to conclude that the early mal-nutrition can affect the lactate kinetics during the exercises.
As there are reports suggesting that the physical training can be benefic to the nutritional recovery process, the present study w as planned to assess the muscular glycidic metabolism in rats submitted to early food protean restriction and later nutritional re-covery associated or not to the physical training.
M ATERIALS AND M ETHODS
Animals and diets
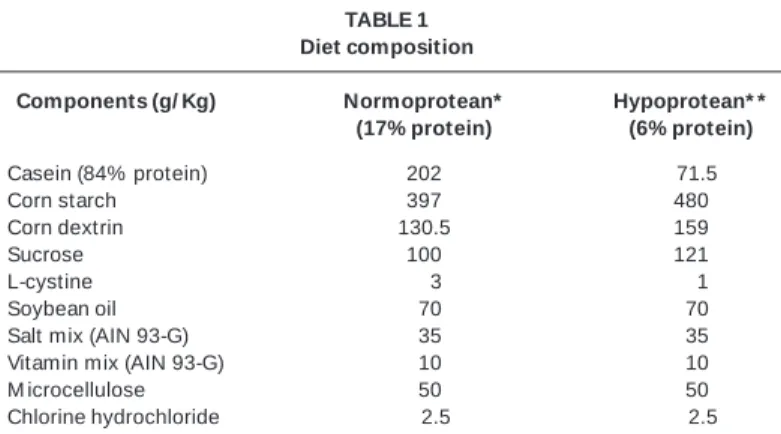
kept in individual polyethylene cages under controlled clare-ob-scure cycle conditions (12/12 h), w ith free access to w ater and food (normoprotean and hypoprotean diets) manipulated at the Laboratory of Biodynamics of the Paulista Júlio de M esquita Filho State University, Rio Claro campus. The diet composition is de-scribed on table 1. Every trial w ith animals w as performed accord-ing to the guidelines provided by the European Convention for Protection of Vertebrate Animals used for Experimental and other Scientific Purposes(7).
dium fluoride) for later blood analysis in an electrochemical analyz-er (YSI 1500 Sport Lactate Analyzanalyz-er).
Sacrifice of animals and obtention of biological material
48 hours after the last strength test, the animals w ere sacri-ficed on rest through decapitation. The trunk’s blood w as collect-ed in glass tubes, w here it w as separatcollect-ed from the serum, in or-der to determine the amount of glucose, free fatty acids (FFA), albumin, and protein. After the blood collection through a median laparotomy, a portion of the liver w as w ithdraw n for later determi-nation of the glycogen and fat. The tw o soleum muscles w ere extracted from the back foot for the incubation procedures, aim-ing to assess the glycidic metabolism. 48 hours after the first strength test, the blood sampling w as collected from the cut lo-cated on the distal end of the animals’ tail, in order to determine the glucose concentrations, the FFA, the amount of protein and the albumin(9).
Incubation of the soleum muscle
The slices of the soleum muscle w ere placed in siliconized 20 mL scintillation vials containing 1.5 mL of Krebs-Ringer bicarbon-ate buffer.
The vials w ere closed w ith rubber lids, sealed w ith plastic rings and submitted to 30 minute pre-incubation under agitation in Du-binoff bath at 60 rpm and continuing gas injection w ith O2/CO2 (95% /5% ). After that period, the muscle slices w ere transferred to new scintillation vials (external vial), and inside the vial it w as installed small shell-shaped tubes (internal vial) w ith an approxi-mately 3 cm straight stick inserted through the rubber lid of the external vial. Each external vial contained 1.5 mL of the Krebs-Ringer buffer, and each internal vial had 700 mL of 10x hyamine. After 60 minute incubation in that system w ith gas injection for the first 15 minutes, it w as added 100 µL of 25% trichloroacetic acid (TCA) in the external vial, w ith the purpose to release the CO2. The preparation w as kept in that system for more than three hours. After that period, 200 µL of the liquid contained w ithin the internal vial w as w ithdraw n, in order to determine the produced CO2. The acidified incubation media contained in the external vial w as stored to determine the lactate, and the muscle slice w as immediately digested in 0.5 mL KOH, in order to assess the mus-cular glycogen content(11). The pre-incubation and incubation tem-perature w as 37o.
The Krebs-Ringer buffer, w hich w as the basis to the pre-incuba-tion and incubapre-incuba-tion medias consisted in 6% NaCl, 6.64 mM HEPES, 0.032% KCL, 1.12 nM CaCL2, 0.015% KH2PO4, 0.19% NaCO3, 0.03% M gSO4. That solution w as gas injected for 30 minutes in O2/CO2 (95% /5% ), and the pH w as adjusted at 7.4. It w as added 20 volumes of fat free seric albumin to that solution, and sodium pyruvate w as added to the pre-incubation media in the 5 mM con-centration, and (5.5 mM ) glucose w as added to the incubation me-dia containing (0.25 µCi/mL) glucose [U-14C], (DG = 0.5 µCi/mL) 2-deoxyglucose [3H], and (10025 µUL/mL) insulin.
After these additions, the pH w as adjusted at 7.4, and the media w as transferred to the vials that w ere sealed and balanced into a 37oC bath under O
2/CO2 gas injection for at least 15 minutes. Slic-es of the same muscle of similar w eight than the incubated onSlic-es w ere used to determine the controlling glycogen concentration. It w as assessed the glucose uptake using the 2-DG as marker, incor-porating the 14C to the glycogen (synthesis), and measuring the radioactivity of the glycogen’s 14C and the 2-DG’s 3H contained re-spectively in the precipitate and in the alcoholic phase of the glyco-gen extraction using the counter of the beta particles. The lactate released into the incubation media w as determined separating the metabolites in the ionic exchange column (Dow ex-2, Sigma), and this represents an index of the glucose transportation under these conditions. Besides the radioactive lactate, the total lactate w as also determined into the incubation media using the enzymatic
TABLE 1 Diet composition
Components (g/ Kg) Normoprotean* Hypoprotean* * (17% protein) (6% protein)
Casein (84% protein) 202 071.5
Corn starch 397 480
Corn dextrin 130.5 159
Sucrose 100 121
L-cystine 003 001
Soybean oil 070 070
Salt mix (AIN 93-G) 035 035
Vitamin mix (AIN 93-G) 010 010
M icrocellulose 050 050
Chlorine hydrochloride 002.5 002.5
** Diet to the grow th, pregnancy, and lactation phases in rodents – AIN – 93G(33).
* * Diet to induce a malnutrition picture(33).
Planning and experimental groups
The study w as composed of tw o steps. In the first step, the animals w ere separated in tw o groups according to the diet: nor-moprotean – fed on a nornor-moprotean diet from their ablactation in the 60th day of life, and hypoprotean – fed on a hypoprotean diet from their ablactation in the 60th of life.
Next, it started the second step, w hen the animals from both groups received a normoprotean portion, thus compounding 4 groups according to their nutritional state and the presence or absence of the physical training: Sedentary Normoprotean (NP-SED), Trained Nor-moprotean (NP-TRA), Sedentary Hypo/NorNor-moprotean (HP/NP-SED), and Trained Hypo/Normoprotean (HP/NP-TRA). In case of animals initially submitted to the protean malnutrition, the normoprotean portion nutrition had as purpose the nutritional recovery.
During the w hole experiment, the animals had their w eight gain and amount of food ingestion recorded once a w eek. Also, they had their muzzle-anus length measured at the end of the first and second steps.
Physical training protocol
Before beginning the training period, the rats assigned to the NP-TRA and HP/NP-TRA groups performed a 10 days adaptation on the treadmill, w here they ran for 5 minutes at a 10 m/min ve-locity for 3 days, 6 minutes at the 15 m/min veve-locity for 3 days, and 7 minutes at a 20 m/min velocity for 3 days.
After the adaptation, the training period initiated, and it w as com-posed by daily running sessions 5 days a w eek for 4 w eeks. The time of the exercising and the treadmill velocity w ere gradually incremented up to the animals ran for 50 minutes at a 25 m/min velocity. Such training protocol w as chosen because these are aerobic exercises prescribed for rats(8).
Strength test
so-method. In order to assess the oxidant glucose (CO2 production), the 14C radioactivity present in the liquid (hyamine) collected in the internal vial of the incubation system w as determined.
Biochemical determinations
The seric glucose w as determined using the enzymatic method of the oxidase glucose, the total proteins w as determined by the biuret reagent, the albumin w as determined by the bromokresol green, and the FFA w as determined by the carbamate diethyl. The tissular glycogen w as extracted according to the Sjorgren et al.(10) method, and the color of the precipitate w as performed using the phenol, follow ing Dubois et al.(11).
Statistical analysis
The statistical procedures included the unpaired t Student or the tw o-entry ANOVA test, and w henever necessary, this w as fol-low ed by the post-hoc Bonferroni test. In every case, it w as adopted p < 0.05 as significance level.
RESULTS
In the first phase of the study, the animals that received the hypoprotean diet had a significantly low er w eight gain, and a sig-nificantly higher food intake compared to the normoprotean groups after the 8 w eek training period w ith the diets (table 2). The ani-mals kept in the hypoprotean diet presented significantly higher seric FFA concentrations, and significantly low er total proteins, albumin, and glucose related to the normoprotean group (table 2).
TABLE 2
Weight gain (g) and daily food intake (g/ 100 g of body w eight), seric contents of free fatty acids (FFA IN µEq/ L), total proteins (g/ dL), albumin
(g/ dL) and glucose (mg/ dL) at the end of the first step of the study Control Underfed
Weight gain 232.18 ± 21.11 76.16 ± 21.01* Food intake 017.4 ± 4.11 22.1 ± 4.09*
FFA 260.0 ± 12.0 322.0 ± 45.0*0
Total protein 06.5 ± 0.2 5.5 ± 0.1*
Albumin 05.9 ± 0.1 4.7 ± 0.1*
Glucose 122.1 ± 5.10 100.0 ± 4.2*00
Results expressed as mean and standard deviation in 20 animals per group. * Significant difference (p < 0.05, test t) related to the control.
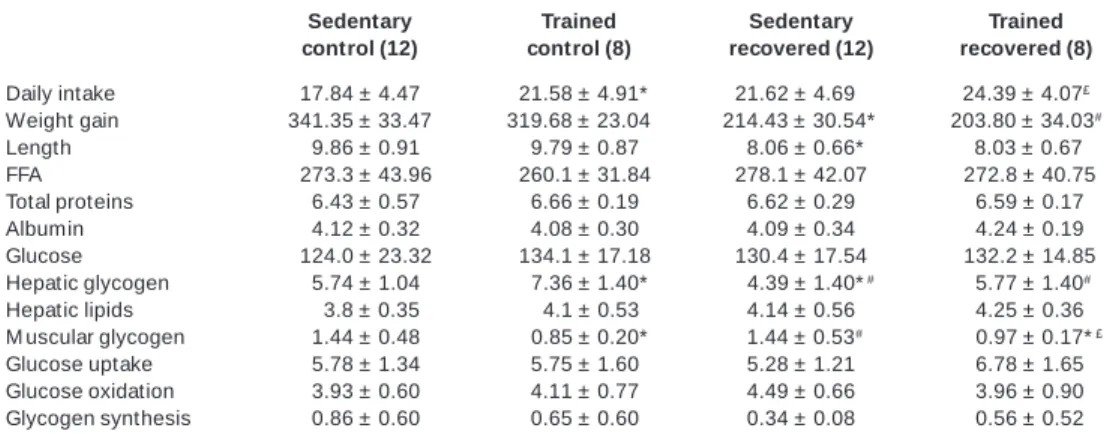
TABLE 3
Daily rats’ food intake (g), w eight gain (g), length of the rats (cm), hepatic glycogen (mg/ 110 mg), hepatic lipids (mg/ 100 mg) and muscular glycogen (mg/ 110 mg), seric content of free fatty acids (FFA in µEq/ L), total proteins (g/ L), albumin (g/ L) and glucose (mg/ dL), glycogen concentration
(mg/ 100 mg), glucose uptake, oxidation and incorporation (synthesis) in glycogen (mmol/ g.hour) by the isolate soleum muscle in the end of the second step of the study
Sedentary Trained Sedentary Trained control (12) control (8) recovered (12) recovered (8)
Daily intake 17.84 ± 4.47 *21.58 ± 4.91* 21.62 ± 4.69* 24.39 ± 4.07£
Weight gain 341.35 ± 33.47 319.68 ± 23.04 214.43 ± 30.54* 203.80 ± 34.03#
Length 09.86 ± 0.91 09.79 ± 0.87 08.06 ± 0.66* 08.03 ± 0.67#
FFA 0273.3 ± 43.96 0260.1 ± 31.84 278.1 ± 42.07 #272.8 ± 40.75
Total proteins 06.43 ± 0.57 06.66 ± 0.19 6.62 ± 0.29 #6.59 ± 0.17
Albumin 04.12 ± 0.32 04.08 ± 0.30 4.09 ± 0.34 #4.24 ± 0.19
Glucose 0124.0 ± 23.32 0134.1 ± 17.18 130.4 ± 17.54 #132.2 ± 14.85
Hepatic glycogen 05.74 ± 1.04 * 07.36 ± 1.40* *#4.39 ± 1.40*# ##5.77 ± 1.40#
Hepatic lipids 003.8 ± 0.35 004.1 ± 0.53 4.14 ± 0.56 #4.25 ± 0.36
M uscular glycogen 01.44 ± 0.48 * 00.85 ± 0.20* #1.44 ± 0.53# *£#0.97 ± 0.17*£
Glucose uptake 05.78 ± 1.34 05.75 ± 1.60 5.28 ± 1.21 #6.78 ± 1.65
Glucose oxidation 03.93 ± 0.60 04.11 ± 0.77 4.49 ± 0.66 #3.96 ± 0.90
Glycogen synthesis 00.86 ± 0.60 00.65 ± 0.60 0.34 ± 0.08 #0.56 ± 0.52
Results expressed as mean ± standard deviation, w ith the amount of animals are parenthesized. * Significant difference (p < 0.05, tw o-w ay Anova) related to the sedentary control.
£ Significant difference (p < 0.05, tw o-w ay Anova) related to the recovered sedentary. # Significant difference (p < 0.05, tw o-w ay Anova) related to the trained control.
Figure 1 – Blood lactate of groups CT and RT during the strength tests
performed before (upper panel) and after (low er panel) the physical train-ing. Before the training, the blood lactate stabilized after 5 minutes of the exercising in the recovered group (3.72 ± 1.06 mmol/L), and after 10 min-utes in the control group (4.60 ± 1.44 mmol/L). After the training, the blood lactate stabilized 5 minutes after the exercise in both groups (con-trol, 2.98 ± 1.02, and recovered 2.15 ± 0.97* mmol/L). As stabilization criterion, it w as considered the difference low er than 1.0 mmol/L betw een groups. The recovered group presented a significant decrease in the lac-tate concentration or a significant decrease in the laclac-tate concentration after the 30 days training on treadmill. Resultados expressos como média e desvio padrão de 8 amostras teciduais em cada grupo.
* Significant difference p < 0.05, related to the exercise performed before the 30 day training in the same group.
Lactate obtained during pre-training strength test
L
ac
tat
e c
onc
ent
rat
ion
Control Recovered
Time (minutes)
Control Recovered Lactate obtained during
post-training strength test
L
ac
tat
e c
onc
ent
rat
ion (m
M
)
In the second step of the study, the trained groups (NP-TRA, and HP/NP-TRA) show ed a daily food intake higher than the re-spective sedentary groups (NP-SED, and HP/NP-SED) (table 2). Related to the w eight gain, the trained recovered groups (HP/NP-TRA) had a significantly low er gain compared to the remaining groups (HP/NP-SED, NP-TRA, and NP-SED).
Figure 1 show s the blood lactate values of the trained groups (NP-TRA, and HP/NP-TRA) on the strength tests performed before (upper panel) and after (low er panel) the physical training. In the test performed before the training, the blood lactate w as stabi-lized from 5 minutes of the exercise in the recovered group (HP/ NP-TRA), and after 10 minutes in the control group (NP-TRA) w ith similar values (3.72 ± 1.06, and 4.60 ± 1.44 mmol/L to the NP-TRA, and the HP/NP-NP-TRA, respectively).
In the test performed after the 4 w eek training period, the blood lactate stabilized after 5 minutes of the exercise in both groups, presenting low er values than those observed in the first test (2.98 ± 1.02, and 2.15 ± 0.97 mmol/L, to the HP-TRA and HP/NP-TRA, respectively). The reduction w as significant only to the recovered group (HP/NP-TRA).
The trained control group (NP-TRA) presented a significantly high-er hepatic glycogen concentration compared to the remaining groups (NP-SED, HP/NP-SED, and NP-TRA). As to the hepatic lip-ids, it w as verified no significant differences betw een groups. The muscular glycogen presented significant low er values in trained animals TRA, and HP/NP-TRA) than the sedentary ones (NP-SED, and HP/NP-SED (table 3).
There w as no significant difference betw een the values of the glucose uptake, the glucose oxidation and incorporation (synthe-sis) in the glycogen by the isolate soleum muscle in rats (table 3).
DISCUSSION
The results related to the gain in the body w eight, food intake and the length in rats in the first step of the study indicated that the 6% protein diet w as effective in inducing a malnutrition state in animals. Likew ise, the blood glucose concentrations, the total protein, low albumin and high seric FFA content are commonly observed features in underfed human beings(12) and in underfed animal models(2,13,14).
The reduction in the body w eight gain in rats submitted to pro-tean restriction is a w idely reported phenomenon in the literature(15), and this has been associated to functional and morphological changes.
Rats kept in a hypoprotean diet show ed a similar picture than the childish Kw ashiorkor-type malnutrition that has as basic char-acteristics: low w eight, hypoproteinia, hypoalbuminemia, high seric FFA contents and hepatic steatosis or fatty liver(1,2).
An important aspect is that the alterations observed w ere con-sequence of the protean instead of the caloric deficiency, as both w ere isocaloric diets and the underfed rats of such model pre-sented a higher food intake than the control group. Several prior studies w ithin our group have show n a high food intake in rats kept in a hypoprotean diet(4,8,16).
Among other factors, such alteration may be due to modifica-tions in the mediators such as the ghrelin and the leptin. Leptin is a protein produced by the adipose tissue that has an important role through the increase in the calories burning and in the reduc-tion in the food intake(17-19). Ghrelin is a gastrointestinal hormone recently identified in the rats’ stomach(20). Studies in animal mod-els indicate that the ghrelin has an important role in the signaliza-tion of the hypothalamic centers that regulate the food intake and the energetic balance(21-25).
Still, it is know n that the seric ghrelin concentrations are influ-enced by the acute and chronic changes in the nutritional state, and they rise in the presence of nervous anorexia, and reduced in the obesity, unlike the leptin that is high in obese rats(24,26-28). Thus,
it is necessary to assess the protean malnutrition model, in order to precisely interfere in the contribution of those mediators as to the food intake alterations observed in the present study.
In the second step of the study, it w as verified that the amounts of seric protein, glucose, albumin, and FFA, as w ell as the hepatic and muscular glycogen and the hepatic lipids presented similar concentrations in the recovered animals than the amounts found in the control animals. The body mass remained reduced. These data are in accordance to the previously found results(1,6), and they suggest the partial nutritional recovery in previously underfed rats. The glucose uptake, oxidation, and incorporation (synthesis) in glycogen by the isolate soleum muscle in rats at the end of the second phase of the study present no significant differences be-tw een the recovered and control groups both in trained and sed-entary animals, suggesting that the early food protean restriction does not interfere in the muscular metabolism of the glucose af-ter the recovery.
Crace et al.(29) reported an increase in the glycogen synthesis in rats submitted to protean restriction, and also a higher glucose uptake by the isolate soleum muscle in rats submitted to hypopro-tean diet compared to rats fed w ith a normoprohypopro-tean diet. On the other hand, Nolte et al.(30) found no difference in the glycogen syn-thesis betw een the control and protein recovered animals, and they studied muscular slices incubated upon the absence and pres-ence of FFA.
The results in the strength tests show ed that the training tread-mill running protocol led to a reduction in the blood lactate accu-mulation during the exercise, suggesting an improvement in the aerobic conditioning in these animals. Normally, the physical train-ing reduces the lactate accumulation durtrain-ing the exercistrain-ing at the same submaximal intensity of the strength due to a higher remov-al capability of the circulating substrates(31).
On the other hand, the reduction in the blood lactate during the exercises in the trained groups compared to the sedentary groups may be due simply to the reduction in the muscular reserves of the glycogen, since in the present study the animals submitted to the physical training, regardless their nutritional state, presented a reduction in the muscular glycogen concentrations. These re-sults are opposed to the classical reports found in the literature, indicating the presence of high muscular glycogen stocks in hu-man beings and animals submitted to the physical training(32).
Considering that trained and sedentary animals have show n sim-ilar values for the glucose uptake and in vitro glycogen synthesis by the isolate soleum muscle, the low muscular glycogen concen-trations in the trained groups assessed in the resting state may be consequence of the incomplete recovery after each exercising session.
Summarizing, it can be concluded that the hypoprotean diet in the first step w as efficient in inducing the protean malnutrition state in rats. In the second step, there w as a return of the bio-chemical parameters values analyzed in the normal state.
As to the training, it had no impact on the nutritional recovery, as there w ere no metabolic or somatic changes betw een the re-covered animals in the presence or absence of the training. It w as detected only an increase in the food intake among the trained groups, suggesting a reduction in the alimentary efficiency, in func-tion of the increasing energetic demand that is consequence of the training.
Probably, the frequency of the exercise w as inadequate to ob-serve the desired effects. Further studies are in progress in our laboratories aiming to enlarge the animals’ training period, as w ell as to assess the oxidant adaptation of the skeletal muscle through the enzymatic activities.
REFERENCES
1. Torun B, Chew F. Protein energy malnutrition. M odern nutrition in healthy and disease. Philadelphia: Lea e Febiger, 1994.
2. Galdino R, M ello M AR, Almeida RL, Almeida CCS. Desnutrição protéico-calórica. In: Dâmaso A, editor. Nutrição e exercício na prevenção de doenças. São Paulo: M edsi, 2001;10:433.
3. Torun B, Viteri FE. Influence or exercise on linear grow th. Eur J Clin Nutrition 1994;48(Suppl I):S186-90.
4. Gobatto CA. Alterações metabólicas decorrentes do treinamento físico em ratos previamente desnutridos e recuperados. [Dissertação de M estrado]. UNICAM P, Campinas, 1993.
5. Gopalan S. M alnutrition: causes, consequences, and solutions. Nutrition 2000; 16:7-8.
6. Papoti M , Almeida PBL, Prada FJA, Eleno TG, Hermini HA, Gobatto CA, et al. M áxima fase estável de lactato durante a natação em ratos recuperados de des-nutrição protéica. M otriz, Rio Claro 2003;9:97-103.
7. Concil of Europe. Strasbourg, no. 123, 1985.
8. M anchado FB, Gobatto CA, Contarteze RVL, Papoti M , M ello M AR. M aximal lac-tate steady slac-tate in running rats. J Exerc Physiol online 2005;8:1-8.
9. Nogueira DM . M étodos de bioquímica clínica. São Paulo: Pancast, 1990;468p.
10. Sjorgren B, Nordensklold T, Holmegren H, Wollerstrom J. Beitrag zur kenttnis des lebernrhytmik. Pflugers Archiv fur die Gesamte Physiologie des M enschem und der Tiere 1938;240-7.
11. Dubois B, Gilles KA, Hamilton JK, Rebers PA. Colorometric method for determi-nation of sugar relate substances. Analytical Chemistry 1956;28:350-6. 12. Waterlow JC, Alleyne GAO. M á nutrição protéica em crianças. Evolução dos
co-nhecimentos nos últimos dez anos. São Paulo: L.P.M . Editora, 1974;120p.
13. Lunn PGE, Austin S. Differences in nitrogen metabolism betw een protein-defi-cient and energy-defiprotein-defi-cient rats w ith similary restricted grow th rates. Ann Nutr M etab 1983;27:242-51.
14. Gobatto CA, Sibuya CY, Azevedo JRM , Luciano E, Kokubun E, M ello M AR. Carac-terização da intensidade de exercício e do efeito de treinamento físico no modelo de natação de ratos W istar. M otriz, Rio Claro 2001a;7:S57-S62.
15. Escriva F, Kergoat M , Bailbé D, Pascual-Leone AM , Portha B. Increased insulin action in the rat after protein malnutrition early in life. Diabetologia 1991;34:559-64.
16. Carneiro EM , M ello M AR, Gobatto CA, Boschero AC. Low protein diet impairs glucose-induced insulin secretion from and 45Ca uptake by pancreatic rats islets. Nutr Biochem 1995;6:314-8.
17. Romero CEM , Zanesco A. O papel dos hormônios leptina e grelina na gênese da obesidade. Braz J Nutr 2005 (in press).
18. Ahima RS, Osei SY. Leptin signaling. Physiol Behav 2004;81:223-41.
19. M oraes C, Romero CEM , Zanesco A. Serum leptin level in hypertensive middle-aged obese w omen. The Endocrinologist 2005;15:219-21.
20. Kojima M , Hosoda H, M atsuo, H, Kangaw a K. Ghrelin: discovery of the natural endogenous ligand for the grow th-hormone secretagogue receptor. Trends Endo-crinol M etabol 2001;12:118-22.
21. Hosoda H, Kojima M , M atsuo H, Kangaw a K. Ghrelin and des-acyl ghrelin: tw o major forms of rat ghrelin peptide in gastrointestinal tissue. Biochem Biophys Res Commun 2000;279:909-13.
22. Nakazoto O, M urakami N, Date Y, Kojima M , M atsuo H, Kangaw a K, et al. A role for ghrelin in the central regulation of feeding. Nature 2001;409:194-8.
23. Broglio F, Benso A, Castiglioni C, Gottero C, Prodam F, Destefanis S, et al. The endocrine response to ghrelin as a function of gender in humans in young and elderly subjects. J Clin Endocrinol M etab 2003;88:1537-42.
24. Rosická M , Krsek M , M atoulek M , Jarkovská Z, M arek J, Justová V, et al. Serum ghrelin levels in obese patients: the relationship to serum leptin levels and solu-ble leptin receptors levels. Physiol Res 2003;52:61-6.
25. Vendrell J, Broch M , Vilarrasa N, M olina A, Gómez JM , Gutiérrez C, et al. Resis-tin, adiponecResis-tin, ghrelin, lepResis-tin, and proinflammatory cytokines: relationship in obesity. Obes Res 2004;12:962-71.
26. Tshop M , Smiley DL, Heiman M L. Ghrelin induces adiposity in rodents. Nature 2000;407:908-13.
27. Ukkola O, Poykoo S. Ghrelin, grow th and obesity. Ann M ed 2002;34:102-8.
28. Salbe AD, Tshop M H, Delparigi A, Venti C, Tataranni PA. Negative relationship betw een fasting plasma ghrelin concentrations and ad libitum food intake. J Clin Endocrinol M etab 2004;89:2951-6.
29. Crace CJ, Sw enne I, Khon PG, Strain J, M ilner ROG. Protein energy malnutrition induces changes in insulin sensitivity. Diabetes M etab 1995;16:484-91.
30. Nolte LA, Galuska D, M artin IK, Zierath JR, Wallberg-Henriksson H. Elevated free fatty acid levels inhibit glucose phosphorylation in slow -tw itch rat skeletal mus-cle. Acta Physiol Scand 1994;151:51-9.
31. Pyne BD, Lee H, Sw anw ick KM . M onitoring the lactate threshold in w orld-ranked sw immers. M ed Sci Sports Exerc 2001;33:291-7.
32. Gobatto CA, M ello M A, Sibuya CY, Azevedo JR, Santos LA, Kokubun E. M aximal lactate steady state in rats submitted to sw imming exercise. Comp Biochem Physiol A M ol Integr Physiol, New York 2001;130:21-7.