INTRODUCTION
The rubber tree [Hevea brasiliensis (Willd ex Adr. de Juss.) Muell. Arg.] is considered a preferentially cross pol-linating, perennial species, with a long breeding cycle. Usu-ally, three selection stages are involved and 25 to 30 years are required until the final choice of clones for large scale planting can be made (Gonçalves et al., 1988). This long breeding process has led to considerable investment in stud-ies of genetic parameters to maximize the selection progress. Of particular interest to breeders are the genetic variance, heritability and gains provided by different selec-tion methods.
Studies on genetic variation have been carried out in Malaysia (Nga and Subramanian, 1974; Tan et al., 1975; Tan and Subramanian, 1976; Tan, 1977, 1978a,b) and Nigeria (Alika and Onokpise, 1982; Alika, 1985). In Brazil, studies on the heritability of various traits have been done by Siqueira (1978), Valois et al. (1978), Paiva et al. (1982, 1983), Gonçalves et al. (1990, 1992, 1996), Moreti et al. (1994) and Boock et al. (1995).
These studies have considered the rubber tree as an open pollinating species. Simmonds (1989), however, re-ported an average self pollination rate of 22% with an
esti-mated amplitude of 16-28%. More recently, Paiva (1992) obtained a mean inbreeding rate above 20% in natural popu-lations. These findings identify the rubber tree as a species with a mixed reproductive system.
The assumption that the covariance among individu-als within the progeny (COVp) of an open pollination
popu-lation in a forest ambient corresponds to 25% of the addi-tive genetic variance (σ2
A) usually leads to an
overestima-tion of this variance. Consequently, the heritability coeffi-cient and genetic gains from selection are equally overesti-mated (Squilace, 1974; Namkoong, 1981). This occurs be-cause some species allow a certain rate of self pollination, which normally increases the covariance among individu-als in the progeny. In addition, use of the relationship σ2
A =
4 COVp results in the overestimation of additive variance
(Resende et al., 1995b).
This situation is typical of Eucalyptus species, which have rates of self pollination ranging from 8 to 40%. Moran and Bell (1983) and Griffin et al. (1987) considered Euca-lyptus species to have a mixed reproductive system.
Adoption of the model presented by Cockerham and Weir (1984) for species with a mixed reproductive system allows better characterization of the genetic structure of such populations. This practice provides a more suitable METHODOLOGY
Selection and genetic gain in rubber tree (
Hevea
) populations using
a mixed mating system
Reginaldo Brito da Costa1, Marcos Deon Vilela de Resende2, Antonio José de Araujo3,
Paulo de Souza Gonçalves4 and Antonio Rioyei Higa3
1Curso de Biologia/Zootecnia, Programa Desenvolvimento Local, Universidade Católica Dom Bosco, Av. Tamandaré, 6000, Caixa Postal 100, 79117-100 Campo Grande, MS, Brasil.
2EMBRAPA - Centro Nacional de Pesquisa de Florestas (CNPF), Caixa Postal 319, 83411-000 Colombo, PR, Brasil. 3Departamento de Silvicultura e Manejo,Universidade Federal do Paraná (UFPR), Caixa Postal 886, 80001-970 Curitiba, PR, Brasil. 4Programa Seringueira, Centro de Café e Plantas Tropicais, Instituto Agronômico de Campinas (IAC), Caixa Postal 28, 13001-970 Campinas, SP, Brasil.
Send correspondence to P.S.G. E-mail: [email protected]
Abstract
The components of genetic variation and genetic gain obtained with three selection methods - individual, combined and multi-effect index
selection - were compared in rubber tree [Hevea brasiliensis (Willd. ex Adr. de Juss.) Muell. Arg.] progenies. The rubber tree is a cross
definition of the components of genetic variation and, con-sequently, of the effects of self pollination in estimating genetic parameters (Resende et al., 1995b, 1996). In addi-tion, the considerations presented by Namkoong (1966) and Squilace (1974) were based only on additive genetic vari-ance, and did not consider the other components of genetic variation which occur where there is inbreeding.
Thus, any recommendations on how to choose the genetic material for large scale planting should take into consideration the variability associated with a mixed repro-ductive system, which, in the case of the rubber tree, in-cludes the self pollination rate.
In the present study, the genetic variation and genetic gain associated with individual, combined and multi-effect index selection in rubber tree progenies were compared, assuming an open pollinating species with a mixed repro-ductive system.
MATERIAL AND METHODS
The genetic material used consisted of 22 progenies of half sibs from open pollinated seeds, obtained from 22 parent clones selected phenotypically from an H. brasilien-sis population composed of material of Asian origin intro-duced to Instituto Agronômico de Campinas (IAC) in 1952. The progeny tests were set up at three experimental stations belonging to IAC in São Paulo State. The charac-teristics of these localities are described below.
a) Jaú experimental station: latitude 22o17’S,
longi-tude 48o34’W and altitude of 580 m. The soil is clay
tex-tured dark red latosoil deep and flat with a well-drained to-pography. An Aw (Köppen) climate predominates in this re-gion, with a defined dry season, annual mean temperature of 21.6°C, average humidity of 70% with extremes of 77% in February and 59% in August. The mean annual rainfall is 1,344 mm.
b) Pindorama experimental station: latitude 21o13’S,
longitude 48o56’W and altitude of 560 m, with
red-yel-low podzolic soil of medium texture which was TB eutro-phic, deep, abrupt and well drained (Lepsch and Valadares, 1976). The climate is tropical continental, with a wet sum-mer and a dry winter period with reduced temperatures and rainfall. The mean annual temperature is 22.2°C, with a maximum of 28.9°C and a minimum of 16.6oC. The mean
annual rainfall is 1,390 mm. The period from October to April usually has a favorable precipitation for growth and production. Low precipitation and temperatures occur from May to September.
c) Votuporanga experimental station: latitude 20o25’S,
longitude 49o50’W and altitude of 450 m. The soil is
pod-zolic sandy phase type and the climate tropical continental, with a hot, wet summer and a cool, dry winter period with low temperatures and rainfall. The mean annual tempera-ture is 22.3°C and the mean annual rainfall is 1,420 mm.
The seeds were collected at the IAC experimental cen-ter, then germinated in polyethylene bags, at the three
ex-perimental stations and taken to their definitive locations when they showed two leaf umbrellas. The seedlings were set out in a randomized complete block design with 22 treat-ments, five replications and ten plants per plot (1.5 m x 1.5 m) in single rows. The progenies were assessed for rubber production when they were three years old.
Dry rubber production (RP) was determined by the Hamaker-Morris-Mann (HMM) test modified for three-year-old seedlings (Tan and Subramanian, 1976) using the mean dry rubber production from three cuts per plant. The tapping panel was opened 20 cm from the soil, using the 1/ 2S d/3 system, with a total of 35 cuts. The first five samples, which corresponded to the “breaking in of the panel” stage, were discarded. The term 1/2S corresponded to the half spiral cut and the term d/3 expressed the interval between tappings, i.e., tapping three days.
The analysis using the statistical model below con-sidered all variables (except the mean) as random effects.
Yijk = µ + pi + bj + eij+ dijk
where Yijk = observed value of the kth plant in the jth
repli-cation within the ith progeny, µ = general mean, pi = effect
of the ith progeny (i = 1, 2,...22), bj = effect of the jth
rep-lication (j = 1, 2, ..3), eij = experimental error associated
with the ijth plot and dijk = effect of the kth plant within the
ijth plot.
Estimates of the genetic and phenotypic parameters were obtained using the SELEGEN genetic statistical soft-ware developed by Resende et al. (1994).
Heritability coefficients at the individual within plot level (h2
d), progeny mean (h2f), plot mean (h2p), individual
within blocks (h2
ib) and individual plants (h2ie) associated with
the different effects of the linear model, were estimated by the following expressions (Resende and Higa, 1994).
h2 =
h2 =
h2 =
3 / 4σ2
A σ2
d d
[(3 + nb) / (4nb)]σ2
A
e σ2d
nb +
σ2
p σ2
b +
f
σ2
e σ2
n + [(3 / (4n)]σ2
A
d p
σ2
p+σ2e+σ2d σ2
A
h2 =
ib
σ2
p+σ2e+σ2d+σ2b σ2
A
h2 =
where σ2
A = 4σ2p, σ2A = additive genetic variance, σ2e = among
plots environmental variance, σ2
d = among plants within plots
phenotypic variance, σ2
p = among progenies genetic variance,
n = number of plants/plot and b = number of blocks. The coefficients of genetic (CVg%) and experimental
(CVe%) variation were estimated using the following
for-mulas presented by Vencovsky (1987):
CVg (%) =
CVe(%) =
Estimates of the genetic values and the genetic progress were obtained by individual (Ii), combined (Ic) or
multi-ef-fect (Ime) index selection in a univariate situation, using the
expressions described by Resende and Higa (1994):
Ii = h2 (Xijk - X)
Ic= h2 . Xijk - h2 . Xij. + h2. Xi.. - h2. X...
Ime = h2(Yijk) + (h2 - h2) Xij. - h2X.j. +
+ (h2 - h2) X
i.. + (h2 - h2) X...
where h2
ie is the heritability coefficient in the restricted
sense at the individual level in the experiment, Xijk is the
value of the kth of the individual in the ijthplot, X is the general experimental mean, Xi.. is the progeny mean, Xij.. is
the plot mean, Xijk is the deviation of the individual value
(plot) and X.j. is the block mean.
The progress with combined selection was equivalent to the mean of the genetic values (index) of the selected individuals. Selection by the multi-effect index was based on the product of the individual phenotypic value, plot mean, progeny mean, block mean and the general mean of the ex-periment using the index weighting coefficients. The method reduced the weight attributed to the general family means thus allowing a better distribution of selected individuals in the various families.
The index weighting coefficients were determined to maximize the correlation between the index and the genetic value. This maximization was obtained by regressing the genetic value on the phenotypic values, which lead to a ma-trix system (Henderson, 1963).
The following accuracy estimators derived by Resende et al. (1995a) for the different selection methods were used:
a) Individual:
b) Combined selection:
c) Multi-effect index:
where σ2
F = genotypic variance at the mean progeny level, σ2
Fie = phenotypic variance at the individual level, σ2 =
re-sidual variance at the plot level, r = genetic correlation coef-ficient among individuals of a single progeny (1/4 for half sibs) and n, b, p = number of plants per plot, block and prog-eny, respectively (see appendix).
The accuracy parameter is a very useful measurement of the precision of the genetic values predicted and it cor-responds to the correlation between the true and the pre-dicted genetic values.
The genetic parameters obtained were also estimated using the SELEGEN software (Resende et al., 1994) for the dry rubber production trait by adopting a model for a species with a mixed reproduction system, and a self polli-nation rate of 22%. The models were considered complete (0.155 kinship coefficient) and additive (0.18 kinship co-efficient) as defined by Resende et al. (1995b).
The complete model considered the additive genetic merit of the individuals and the dominance deviations. The additive model only considered the additive genetic merit of the individuals, i.e., the variation in genetic values was attributed to an additive effect of the genes.
The genetic model adopted corresponded to that pre-sented by Cockerham and Weir (1984):
VG = (1 + F) σ2 + (1 - F) σ2 + 4FD
1 + FD2 +
+ F(1 - F)H’ + (Fc - F2)(H2 - H’)
where F = the endogamy coefficient; Fc = two loci joint
endogamy coefficient, equivalent to
σ2
A = additive genetic variance, σ2D = dominant genetic
vari-ance, D1 = covariance among the additive effects of the
al-leles and the dominance effects of homozygotes, D2=
ge-netic variance of the homozygote dominance effects, H’ = sum of the squares of depression caused by endogamy and
σ2 p . 100 X . 100 σ2 e σ 2 d + X ie
d d f f
d p d p
f p p f
F (1 + 2F) 2F Fc =
A D σ2 A σ2 Fie
1 2 2(1 - r)2σ
2
A σ2
d
+p - 1 p
1 + (nb - 1) nb σ2 A σ2 F
n - 1 n 1 2
(1 - r)2σ2A
σ2
d
+ n - 1
n
p - 1 p
1 + (nb - 1)r nb σ2 A σ2 F 2 +
1 2p - 1 p
2
+ b - 1 b
H2 = square of the sum of the effects of endogamy
depres-sion at each locus.
RESULTS AND DISCUSSION
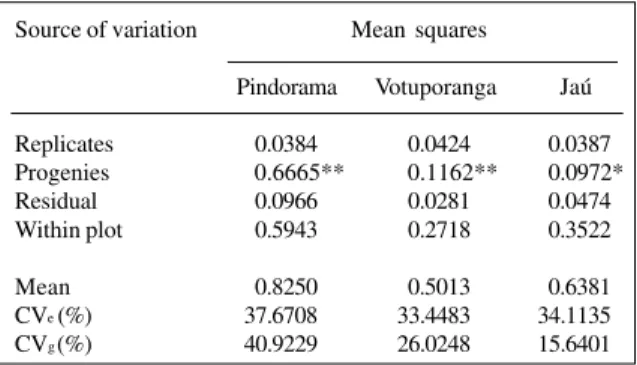
Table I shows the analysis of variance for RP. Signifi-cant among-family differences were detected by the F test. This variability was an essential condition for establishing a genetic breeding program and it could be effectively ex-ploited to increase rubber production.
The experimental coefficients of variation (CVe%)
obtained for RP at Pindorama (37.7%), Votuporanga (33.5%) and Jaú (43.1%) indicated that this trait is subject to great experimental errors. However, these values agree with similar estimates by Paiva et al. (1982) and Alves et al. (1987) who obtained CVe% of 38.3% and 50.4%. The
lev-els were similar to those reported by Moreti et al. (1994). The genetic variation coefficient, which expresses the amount of existing genetic variation as a percentage of the general mean, was higher at Pindorama (40.9%) than at Votuporanga (26.0%) and Jaú (15.6%). This result confirmed the F test results for progeny differences and characterized Pindorama as a more suitable environment for expression of the genetic variability in this population. These results also agreed with those reported by Moreti et al. (1994) for the same trait.
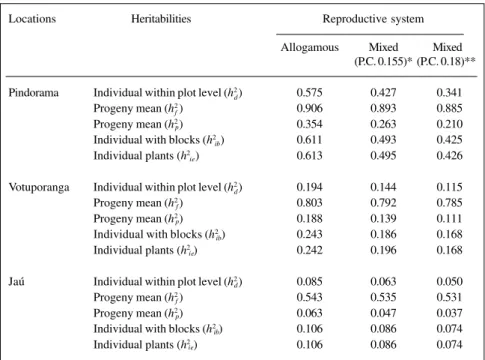
The RP heritability coefficients associated with the different genetic effects used in the selection methods are shown in Table II. The heritability estimates obtained by the different models varied within and among locations accord-ing to the selection method used. Higher heritability values were observed for effects where the rubber tree was con-sidered as a cross pollinating species, with greater values for Pindorama, followed by Votuporanga and Jaú.
The estimates obtained for the species, when consid-ered as cross pollinating, compared to those found in mod-els used for a mixed reproductive system, showed that
heri-tability at the progeny level was practically unaffected at the three locations studied, even after allowing for the pre-sumable inbreeding rate for the population. On the other hand, heritability at the individual level was considerably affected when progenies from open pollination were con-sidered as half sibs.
When the rate of self pollination was not considered, the overestimation of heritability between the cross pollina-tion and mixed models was 2% for Jaú, 4.6% for Votuporanga and 11.8% for Pindorama for the complete model. With the additive model, this variation was even more expressive: Pindorama, 18.7%, Votuporanga 7.4% and Jaú 3.2%.
These results agree with those reported by Resende et al. (1995b) for various Eucalyptus populations, for which the genetic gain (directly proportional to heritability) was overestimated during mass selection. More specifically for heritability, Hodge et al. (1996) pointed out that estimates for E. globulus and E. nitens progenies were overestimated mainly because of the effects of inbreeding depression which were disregarded when open pollination progenies were considered as half sibs.
For among-progeny selection, using open pollination and half sibs, the covariance (COVus,pm) between a selection
unit and the breeding population was exactly the same as the genetic variance among progenies (Resende et al., 1995a). Consequently, there was no error in among-prog-eny selection and the heritability obtained could be used in expressing the genetic gain when working with legitimate half sibs. On the other hand, for mass selection among-half sib progeny, the among-progeny variance component was multiplied by four, increasing the covariance among the in-dividuals in the progeny. Thus, use of the relationship σ2
A=
4 COVp caused overestimation of σ2A (Resende et al.,
1995b). This overestimation will be bigger the greater the self pollination rate.
Table III shows the accuracy and direct genetic gains associated with the different effects used in the selection methods for RP, assuming the species was cross pollinat-ing with a mixed reproductive system.
The accuracy and genetic gain estimates for RP var-ied within and among locations in the different selection methods. When the accuracy values associated to the ge-netic gain are greater, the expected progress with selection was also greater, i.e., the greater the precision in selection the greater the gain. The genetic gain was much more ex-pressive at Pindorama than at Votuporanga or Jaú. These results agree with those obtained by Moreti et al. (1994) for mass selection and can be explained by the high herita-bility values at the individual level at Pindorama compared to those at Votuporanga and Jaú. They also indicate that Pindorama was a more favorable environment for the ex-pression of genetic variability, as shown by the RP coeffi-cients of genetic variation (CVg%).
The multi-effect index approach was more advanta-geous than individual or combined selection because the gain estimates were always superior. This tendency was
simi-Table I - Mean squares from ANOVA of the experimental coefficient of variation (CVe) and genetic coefficient of variation (CVg) for
rubber production (RP) in 22 three-year-old open pollinated progenies of Hevea, at three locations. Source of variation Mean squares
Pindorama Votuporanga Jaú
Replicates 0.0384 0.0424 0.0387
Progenies 0.6665** 0.1162** 0.0972*
Residual 0.0966 0.0281 0.0474
Within plot 0.5943 0.2718 0.3522
Mean 0.8250 0.5013 0.6381
CVe (%) 37.6708 33.4483 34.1135
CVg(%) 40.9229 26.0248 15.6401 1The degrees of freedom for repetition, progenies and residual
lar to that reported by Sturion et al. (1994), Resende et al. (1995a, 1996), and Sampaio (1996).
Resende and Higa (1994) discussed the tendency for higher gains in selection using the multi-effect index and explained that selection among and within progenies and combined selection used two sources of information for selection: the deviation of the individual value relative to the progeny mean in the block and the progeny mean
rela-tive to the general mean of the progeny test. These authors noted that in breeding schemes where the remaining seeds were not used, the additive genetic variance fraction was not considered, but was retained in the plot effects. The multi-effect index, in addition to using these two sources of information, further considers the plot effect and adds to the estimated gain those fractions of additive genetic variance retained in the plots.
Table II- Heritability coefficients (species considered allogamous with a mixed reproductive system) associated with different effects in the selection methods for rubber
production (RP) in three-year-old Hevea at three locations.
Locations Heritabilities Reproductive system
Allogamous Mixed Mixed (P.C. 0.155)* (P.C. 0.18)** Pindorama Individual within plot level (h2 ) 0.575 0.427 0.341
Progeny mean (h2) 0.906 0.893 0.885
Progeny mean (h2) 0.354 0.263 0.210
Individual with blocks (h2
) 0.611 0.493 0.425
Individual plants (h2
) 0.613 0.495 0.426
Votuporanga Individual within plot level (h2) 0.194 0.144 0.115
Progeny mean (h2) 0.803 0.792 0.785
Progeny mean (h2) 0.188 0.139 0.111
Individual with blocks (h2
) 0.243 0.186 0.168
Individual plants (h2
) 0.242 0.196 0.168
Jaú Individual within plot level (h2) 0.085 0.063 0.050
Progeny mean (h2) 0.543 0.535 0.531
Progeny mean (h2) 0.063 0.047 0.037
Individual with blocks (h2
) 0.106 0.086 0.074
Individual plants (h2
) 0.106 0.086 0.074
*22% self-fertilization rate; complete model with 0.155 parental coefficient (P.C.).**22% self-fertiliza-tion rate; additive with 0.18 P.C.
d f
p
ib ie
d f
p ib ie
d f
p ib ie
Table III - Accuracy and direct genetic gain (%) associated with different univariate selection units for rubber production, considering the species allogamous with a mixed
reproductive system for three-year-old Hevea at three locations.
Locations Selection* Allogamy Mixed Mixed
(P.C. 0.155)** (P.C. 0.18)*** Accuracy Gain (%) Accuracy Gain % Accuracy Gain (%) Pindorama Individual 0.783 218.7 0.703 176.3 0.653 151.9
Combined 0.786 211.2 0.735 174.1 0.715 154.1 Multi-effects 0.789 218.6 0.745 178.8 0.722 157.5 Votuporanga Individual 0.492 94.7 0.442 76.3 0.410 65.8
Combined 0.578 91.2 0.578 76.6 0.588 68.6
Multi-effects 0.587 95.9 0.584 80.0 0.592 71.1
Jaú Individual 0.326 31.7 0.293 25.5 0.272 22.2
Combined 0.441 34.9 0.452 30.6 0.467 28.4
Combined selection tends to select many individuals from certain families because of the greater weight given to the progeny information. In breeding populations, this does not present major problems, since in the next generation there will be selection against inbred individuals with undesirable traits, as long as the effective population size is adequate for obtaining the selective limit. Special care should be taken in production populations to prevent crossing among related individuals, which can lead to inbreeding depression. These precautions include careful orchard installation with a good distance among relations (Resende and Higa, 1994).
Higher accuracy and gains were observed for selec-tion methods where the rubber tree was considered a cross pollinating species, with more expressive values at Pindo-rama, followed by Votuporanga and Jaú.
The overestimation of genetic gains in individual se-lection was 19.4% at Pindorama and Votuporanga and 19.5% at Jaú. With combined selection it was 17.6% at Pindorama, 16.1% at Votuporanga and 12.4% at Jaú. For multi-effect index selection, the rate was 18.2% at Pindorama, 16.6% at Votuporanga and 12.9% at Jaú.
More expressive values of the overestimation of ge-netic gains were obtained in the cross pollinating and mixed-additive models. For individual selection the overestima-tion was 30.5% at Pindorama and at Votuporanga and 29.9% at Jaú. For combined selection, it was 27.0% at Pindorama, 24.8% at Votuporanga and 18.8% at Jaú. For selection by the multi-effect index, it was 27.9% at Pindorama, 25.8% at Votuporanga and 20.2% at Jaú.
These results agree with those reported by Resende et al. (1995b) for several Eucalyptus species where the genetic gain was overestimated in individual selection. Over-estimation was caused mainly when inbreeding depression was not considered and the open pollination progeny was treated as half sibs. In this context, the discussion by Resende et al. (1995b) about heritability is fully applicable when dealing with genetic progression and selection.
Our findings are similar to these of Moran and Bell (1983) and Griffin et al. (1987) for Eucalyptus species, which led to these species being considered as having a mixed reproductive system. The model suitable for popula-tions with a mixed reproductive system has not been ap-plied to the rubber tree.
The specific model for species with mixed reproduc-tive systems presented by Cockerham and Weir (1984) al-lows better characterization of genetic structure of such populations. This practice provides a more suitable defini-tion of the components of genetic variadefini-tion and conse-quently of the effects of self pollination when estimating genetic parameters (Resende et al., 1995b). This approach should be useful for obtaining precise estimates of genetic parameters in rubber trees.
ACKNOWLEDGMENTS
R.B.C. is the recipient of a CAPES fellowship. Publication supported by FAPESP.
RESUMO
O presente trabalho objetivou comparar os componentes da variação genética e ganho genético obtidos através da seleção in-dividual, combinada e pelo índice multi-efeitos em progênies de
seringueira [Hevea brasiliensis (Willd ex Adr. de Juss.) Müell. Arg.],
considerando-a como espécie alógama e de sistema reprodutivo misto, com taxa de aufecundação de 22%. Vinte e duas progênies de meio-irmãos foram plantadas nas Estações Experimentais de Pindorama, Votuporanga e Jaú, no estado de São Paulo, no deli-neamento de blocos ao acaso, com cinco repetições e dez plantas por parcela. Aos três anos de idade o caráter produção de borra-cha seca foi avaliado. Os resultados demonstraram haver varia-bilidade genética nas populações, bem como caracterizaram Pindo-rama como um ambiente mais propício para a expressão da referida variabilidade. As herdabilidades ao nível de indivíduos são consi-deravelmente afetadas ao assumir progênies de polinização aberta como sendo de meio-irmãos. Superestimativas consideráveis de ganhos genéticos ocorrem na seleção individual, combinada e índice multi-efeitos, quando não se considera o sistema reprodutivo misto para a seringueira. A seleção com base no índice multi-efeitos maxi-miza o progresso genético e deve ser utilizada.
APPENDIX
Derivation of the multi-effect index and associated accuracy.
The linear model for an individual observation in a pro-geny test is: Yijk = u + bj + pi + eij + dijk, where:
u = general mean, fixed, E(u) = u and E(u2) = u2
bj = block effect, random, E(bj) = 0 and E(b2) = σ2
pi = progeny effect, random, E(pi) = 0 and E(p2) = σ2
eij = plot effect ij, random, E(eij) = 0 and E(e2) = σ2
dijk= within plot effect ijk, random, E(dijk) = 0
and E(d 2
) = σ2
In terms of deviations the model is of the form:
Yijk = Y… + (Yijk - Yij.) + (Yij. - Yi.. - Y.j. + Y…) +
(Yi.. - Y…) + (Y.j. - Y…),
The covariances between the components of the model with the additive genetic value are (Resende, 1991; Resende and Higa, 1994):
COV(A, Yijk) = 2COV(MF) = σ2
COV(A, Yij.) = 2 COV(MF) + 2 COV(MTS or
b j
i p
ij e
d ijk
A
1 n
(n - 1) n
TS) = σ2 + σ2
A A
1 n
COV(A, Yi..) = 2 COV(MF) + 2 COV(MTS
or TS) = σ2 + σ2
COV(A, Y.j.) = 2 COV(MF) + 2 COV(MTS
or TS) = σ2 + σ2
COV(A, Y…) = 2 COV(MF) + 2 COV(MTS
or TS) = σ2 + σ2 , where:
r = additive genetic correlation between individuals within family: r = (1/4) for half-sibs and r = (1/2) for full-sibs; COV(MF) = parent-offspring covariance;
COV(MTS or TS) = half-uncle-nephew (for half-sib fami-lies) or uncle-nephew (for full-sib famifami-lies) covariances.
The covariances between the effects and the additive genetic effects are:
a) Within plot effect
COV [A, (Yijk - Yij.)] = COV (A, Yijk) - COV (A, Yij.) =
= {[(n - 1)(1 - r)]/n}σ2
b) Progeny effect
COV [A, (Yi.. - Y…)] = COV (A, Yi..) - COV (A, Y...) =
c) Plot effect
COV [A, (Yij. - Yi.. - Y.j. + Y…)] = COV(A, Yij.)
-- COV (A, Yi..) - COV (A, Y.j.) + COV (A, Y…)
d) Block effect
COV [A, (Y.j. - Y…)] = COV (A, Y.j.) - COV (A, Y…) =
The block effects can be neglected as a function of its 1
np
(n - 1) np
1 np A
(n - 1) r
np A
1
nb A A
1 nb
(nb - 1) nb
(nb - 1) r nb
A
1 npb
(nb - 1) npb
1
npb A A
(nb - 1) r npb
= σ[1 + (nb - 1) r] 2
nb A
(p - 1) p
b - 1
b σ
2
A
(1 - r) np =
(b - 1)
b σ
2
(p - 1) p
1 - r
n A
COV [A, (Yij. - Yi.. - Y.j. + Y…)] =
low covariance with the genetic value. The variances of the relevant effects are:
a) Within plot effect
Var (Yijk - Yij.) = E(Y2ijk) - 2E(YijkYij.) = E(Y2ij.) =
= [(n - 1)/n] σ2
b) Progeny effect
Var (Yi.. - Y…) = E(Y2i..) - 2E (Yi..Y…) + E(Y2…) =
= [(p - 1)/p] (σ2 + σ2/b + σ2/nb)
c) Plot effect
Var (Yij. - Yi.. - Y.j. + Y…) = E(Y2ij.) + E(Y2i..) + E(Y2.j.) +
+ (Y2…) - 2E (Y
ij.Yi..) - 2E(Yij.Y.j.) + 2E(Yij.Y…) +
+ 2E(Yi..Y.j.) - 2E (Yi..Y…) - 2E(Y.j.Y…)
The optimal selection procedure (the one that maxi-mizes the correlation between predictand and predictor) is given by the multi-effect index (Resende and Higa, 1994):
I = b1dijk + b2pi + b3eij
= b1(Yijk - Yij.) + b2(Yi.. - Y…) + b3 (Yij. - Yi.. - Y.j. + Y…)
The bi coefficients are given by:
Continued on next page (b - 1)
b σ
2
e+ σ2
d
n 0
0
b1
b2
b3
=
(p - 1) p
(b - 1)
b e d
(p - 1) p
Var (Yij. - Yi.. - Y.j. + Y…) = (σ2 + σ2/n) d
p e d
(n - 1)
n σ
2
d
0
0
0
0
σ2
e
b
σ2
p+ +
σ2
d
nb (p - 1)
p
Resolving these equations, the multi-effect index co-efficients are:
= “heritability” of the within plot effect;
b2 =
= “heritability” of the progeny effect;
b3 =
= “heritability” of the plot effect;
The multi-effect index can be alternatively expres-sed as:
I = b1Yijk + (b2 - b3)Yi.. + (b3 - b1)Yij. - b3Y.j. + (b3 - b2) Y…
For the balanced case, the multi-effect index is equiva-lent to individual (animal model) BLUP, as demonstrated by Resende and Fernandes (1999).
The accuracy of the index is given by
rIA = [α1b1 + α2b2 + α3b3]
This is equivalent to:
rIA
REFERENCES
Alika, J.E. (1985). Heritability and genotypic gain from selection rubber (Hevea brasiliensis). Silvae Genet.34: 1-4.
Alika, J.E. and Onokpise, O.U. (1982). Estimation of heritability parameter for yield, girth and bark thickness in rubber (Hevea brasiliensis) from a single pair mating (S.P.M.) design. J. Plant. Crops10: 102-108.
Alves, M.R., Bandel, G. and Vencovsky, R. (1987). Avaliação de seleção em seringueira (Hevea spp.) Bol. Fac. Ciênc. Agrar. Pará 16: 53-63.
Boock, M.V., Gonçalves, P. de S., Bortoletto, N. and Martins, A.L.M. (1995). Herdabilidade, variabilidade genética e ganhos genéticos para produção e caracteres morfológicos em progênies jovens de seringueira. Pesqui. Agropecu. Bras. 30: 673-681.
Cockerham, C.C. and Weir, B.S. (1984). Covariances of relatives stemming from a population undergoing mixed self and radom mating. Biometrics 40: 157-164.
Gonçalves, P. de S., Cardoso, M. and Bortoletto, N. (1988). Redução do ciclo de melhoramento e seleção na obtenção de cultivares de seringueira (Hevea spp.). Agronômico 40: 112-130.
Gonçalves, P. de S., Cardoso, M., Colombo, C.A., Ortolani, A.A., Martins, A.L.M. and Santos, I.C.I. (1990). Variabilidade genética da produção anual da seringueira: estimativas de parâmetros genéticos e estudo de interação genótipo x ambiente. Bragantia49: 305-320.
Gonçalves, P. de S., Martins, A.L.M., Gorgulho, E.P., Bortoletto, N., Cardoso, M. and Bermond, G. (1992). Variação genética dos componentes do crescimento em progênies jovens de uma população de clones de Hevea.
Bragantia51: 161-171.
Gonçalves, P. de S., Martins, A.L.M., Bortoletto, N. and Tanzini, M.R. (1996). Estimates of genetics parameters and correlations of juvenile charac-ters based on open pollinated progenies of Hevea. Braz. J. Genet.19: 105-111.
Griffin, A.R., Moran, G.F. and Fripp, Y. (1987). Preferential outcrossing in
Eucalyptus regnans. Aust. J. Bot.35: 465-475.
Henderson, C.R. (1963). Selection index and expected genetic advance.In:
Statistical Genetics and Plant Breeding (Hanson, W.D. and Robinson, A.F., eds.). Publication 982: NAS-NRC, Washington, pp. 141-163.
Hodge, G.R., Volker, P.W., Potts, B.M. and Owen, J.V. (1996). Comparison of genetic information from open-pollinated and control-pollinated prog-eny tests in two eucalyptus species. Theor. Appl. Genet.92: 53-63.
Lepsch, I.F. and Valadares, J.M.A. (1976). Levantamento pedológico deta-lhado da Estação Experimental de Pindorama, SP. Bragantia35: 13-40.
Moran, G.F. and Bell, C. (1983). Eucalyptus. In: Isozymes in Plant Genetics and Breeding(Tankley, S.D. and Orion, T.Y., eds.). Part B. Elsevier, Amsterdan, pp. 423-441.
Moreti, D., Gonçalves, P. de S., Gorgulho, E.P., Martins, A.L.M. and
Bortoletto, N. (1994). Estimativas de parâmetros genéticos e ganhos esperados com a seleção de caracteres juvenis em progênies de serin-gueira. Pesqui. Agropecu. Bras.29: 1099-1109.
Namkoong, G. (1966). Inbreeding effects on estimation of genetic additive variance. For. Sci.12: 8-13.
Namkoong, G. (1981). Introduction to Quantitative Genetics in Forestry. Castle House Publications, London.
Nga, B.H. and Subramanian, S. (1974). Variation in Hevea brasiliensis. I. Yield and girth data of the 1937 hand pollinated seedlings. J. Rubber Res. Inst. Malays. 24: 69-74.
Paiva, J.R. (1992). Variabilidade enzimática em populações naturais de seringueira.Doctoral thesis, ESALQ-USP, Piracicaba, São Paulo.
Paiva, J.R., Miranda Filho, J.B., Siqueira, E.R. and Valois, A.C.C. (1982). Predição do ganho de alguns caracteres em seringueira em três esquemas
σ2 /nb
d
+
σ2
p σe/b2 +
σ2
A=
nb 1+ (nb - 1)r
(n - 1)
n where: α1 = (1 - r)
1 + (nb - 1) r nb
(p - 1)
p
α2 =
b - 1 b p - 1
p
α3 =
(1 - r)
n / n σ2 e σ 2 d + σ2 A
[(1 - r) /n] =
2
+
1
1 - r
n p - 1
p σ2
σ2 A
b - 1 b 2
^
(1 - r)2 d+ p - 1
p +
n - 1
n σ2
σ2
A 1 + (nb - 1) r
nb 2 σ2 F σ2 A
σ2 d σ2 Ab1 = =
(1 - r) Appendix - Continued
=
(p - 1)
p σ
2
A
(1 - r) n
(b - 1) b (p - 1)
p
(n - 1)(1 - r)
b σ
2
A
nb 1+(nb - 1)r
de seleção. Pesqui. Agropecu. Bras.17: 1646-1653.
Paiva, J.R., Gonçalves, P. de S. and Valois, A.C.C. (1983). Avaliação preliminar do comportamento de novos clones de seringueira em Manaus. Pesqui. Agropecu. Bras.18: 147-158.
Resende, M.D.V. (1991). Correções nas expressões do progresso genético com seleção em função da amostragem finita dentro de famílias e popu-lações e implicações no melhoramento florestal. Bol. Pesqui. Florestal 22/23: 61-77.
Resende, M.D.V. de and Fernandes, J.S.C. (1999). Procedimento BLUP indi-vidual para delineamentos experimentais aplicados ao melhoramento florestal. Rev. Matemát. Estat. 17: 89-107.
Resende, M.D.V. and Higa, A.R. (1994). Maximização da eficiência da seleção em testes de progênies de Eucalyptus através da utilização de todos os efeitos do modelo matemático. Bol. Pesqui. Florestal.28/29: 37-56.
Resende, M.D.V., Oliveira, E.B., Melinski, L.C., Goulart Junior, F.S. and
Oaida, G.R.P. (1994). Seleção Genética Computadorizada - Selegen “Best Prediction”.Manual do Usuário. EMBRAPA - CNPF, Colombo.
Resende, M.D.V., Araujo, A.J., Sampaio, P.T.B. and Wiecheteck, A.S. (1995a). Acurácia seletiva, intervalos de confiança e variância de ganhos gené-ticos associados a 22 métodos de seleção em Pinus caribaea var.
hondurensis. Rev. Floresta24: 35-45.
Resende, M.D.V., Vencovsky, R. and Fernandes, J.S.C. (1995b). Selection and genetic gains in populations of Eucalyptus with a mixed mating system. In: Proceedings of the Eucalypt Plantations Conference, Hobart, Australia, pp. 191-193.
Resende, M.D.V., Moraes, M.L.T. and Paiva (1996). Comparação de métodos de avaliação genética e seleção no melhoramento da seringueira [Hevea brasiliensis (Willd. ex Adr. de Juss.) Müell. Arg.]. Floresta 26: 27-48.
Sampaio, P.T.B. (1996).Variação genética entre procedências e progênies de
Pinus oocarpa Schiede, Pinus caribaea var. hondurensis Barr. & Golf. e Pinus maximinoi, H.E. Moore e métodos de seleção para melhoramento genético. Doctoral thesis, UFPR, Curitiba, PR.
Simmonds, N.W. (1989). Rubber breeding. In: Rubber (Webster, C.C. and Baulkwill, W.J., eds.). Longman, London, pp. 85-124.
Siqueira, G.R. (1978). Estimativas de parâmetros genéticos de seringueira
(Hevea spp.) em condições de viveiro. Master´s thesis, UFV, Viçosa, MG.
Squilace, A.E. (1974). Average genetic correlations among offspring from open pollinated forest trees. Silvae Genet.23: 149-156.
Sturion, J.A., Resende, M.D.V., Carpanezzi, A.A. and Zanon, A. (1994). Variação genética e seleção para características de crescimento em teste de progênies de Mimosa scabrella var. aspericarpa. Bol. Pesqui. Flo-restal28/29: 73-83.
Tan, H. (1977). Estimates of general combining ability in Hevea breeding at the Rubber Research Institute of Malaysia. I. Phases II and III a. Theor. Appl. Genet.50: 29-34.
Tan, H. (1978a). Assessment of parental performance for yield in Hevea
breeding. Euphytica27: 521-512.
Tan, H. (1978b). Estimates of parental combining abilities in rubber (Hevea brasiliensis) based on young seedlings progeny. Euphytica27: 817-823.
Tan, H. and Subramanian, S. (1976). A five-parent diallel cross analysis for certain characters of young Hevea seedlings. In: Proceedings of Inter-national Rubber Conference, 1975, RRIM, Kuala Lumpur, pp. 13-16.
Tan, H., Mukherjee, T.K. and Subramanian, S. (1975). Estimates of genetic parameters of certain characters in Hevea brasiliensis. Theor. Appl. Genet.46: 181-190.
Valois, A.C.C., Pinheiro, E., Conceição, H.E.O. and Silva, M.N.C. (1978). Competição de porta-enxertos de seringueira e estimativas de parâmetros genéticos. Pesqui. Agropecu. Bras. 13: 49-59.
Vencovsky, R. (1987). Herança quantitativa. In:Melhoramento e Produção do Milho (Paterniani, E. and Viegas, G.P., eds.). 2nd edn. Fundação Cargill, Campinas, pp. 137-214.