RAAE
REGULAR ARTICLE
DETERMINATION OF SPATIAL INTEGRATION AND SUBSTITUTION OF FOREIGN
RICE FOR LOCAL RICE IN GHANA
Philip Kofi ADOM
Address:
University of Professional Studies, Faculty of Accounting and Finance, Department of Banking and Finance, P.O.Box LG 149, Accra, phone:+233246763661
e-mail: [email protected]
ABSTRACT
This study tested for spatial integration in the rice market and the substitution of imported rice for local rice in Ghana. It is established that the markets for domestic imported rice are well-integrated, but not complete. The imperfect spatial integration of domestic foreign rice markets implies that the market provides opportunities for arbitrage. Price leadership roles are found to be determined by the kind of sub-inter-regional-trade network defined. However, in all, the Accra market emerged as a dominant market leader in the domestic foreign rice market. There is evidence of significant regional substitution of foreign rice for local rice in the long run, but the result is mixed in the short run. The result that local rice is not a perfect substitute for imported rice implies that price disincentive measures such as increasing the import tariffs on foreign rice will only produce a mild effect on increasing the producer price faced by local rice farmers, but aggravate the burden on households’ budget.
Keywords: Spatial integration; Commodity substitution; Ghana; Rice market JEL: Q00, Q1, Q11, Q18
INTRODUCTION
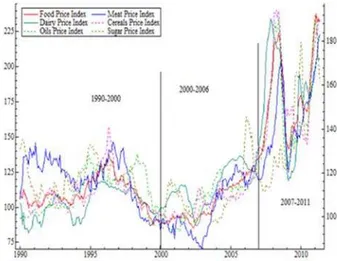
Recent review of the Millennium Development Goals has shown that some developing countries are making progress in terms of achieving the set targets. However, prevalent domestic and external shocks continue to present themselves as important downside risks that act against this course. Food price hikes continue to put pressure on households’ already overburden budget. Though food price hikes have been experienced in the past, the levels achieved in 2007/2008 was highly marked. Figure 11 shows the plot of the global food
price indices for major food staples from 1990 to 2011. It is obvious from the figure that the price hike experienced in 2007/2008 was unique as the world for the first time experienced a price regime shift. The variances and means for the price indices for meat, cereals, dairy, and oils shifted from their historical levels. Prices of dairy products, cereals, meat, and oil during this period more than doubled relative to their levels in 1990-2000 and 2000-2006.
Among the food categories, cereals experienced the highest price increase followed by dairy products, oils, and meat. In the second half of 2008, however, food prices fell drastically but never returned to their historical levels. However, in the later part of 2008, the world again witnessed a significant increase in food prices. The sugar price index crossed 200 percentage points in 2010 whilst the meat; dairy, oils price indices
1 With the exception of the overall food price index, all other
indices are on the right-side of the figure.
remained below their 2007 level. During this period, prices of cereals remained low. However, from 2010, the price of cereals, meat, and oils drastically increased with the oil and meat price indices exceeding the 2007/2008 level. The following key points are worth noting. First, what the world referred to as a food crisis in 2007/2008 denoted increases in the price of cereals, meat, and dairy products. Second, the period 2010/2011 also marked another period of the food crisis, and this is comparable with the period 2007/2008. The huge increase in food prices has sparked up fears among governments, particularly in developing countries, on the consequential impact on food security, poverty and child malnutrition.
In Ghana, cereal consumption continues to dominate among households. Among the cereals, rice emerges as the second largely consumed staple food after maize in the country. Per capita consumption of ice was estimated as 28kg in 2010/2012. Urban consumption constituted about 75% of total rice consumption (CARD, 2010). Unfortunately, the major source of supply for this increased demand is through imports. This suggests that imports have been driven high in the country due to the high demand for rice in the country. It is estimated that rice import accounts for about 58% of cereal import and 5% of agricultural imports between 2005 and 2009 (CARD, 2010).
have increased greatly in recent times. It is estimated that, on the average, import bills of rice for Ghana is USD 450 Million annually (MOFA, AGRA, 2010). Between 2008 and 2009, for instance, import bills alone for broken rice and milled rice amounted to USD 2,756,783,902.
Fig 1: Monthly world price indices for major food
staples
The huge increase in import bills of rice has increased public demand for foreign currency, which has exerted a negative influence on the value of the local currency. The resulting depreciation of the cedi has resulted in inflationary pressures, dollarization, and capital flight, which has adversely affected the growth of the Ghanaian economy. As a policy initiative, government in recent times has made attempts to encourage substitution of imported rice for local rice through disincentive measures such as import taxes and tariffs. The main presumption of this policy is that the local rice market and the foreign rice market are not segmented and that there is significant substitution of foreign rice for local rice among households in the country. This has, however, not been established empirically. The main motivation for this study is to examine the market segmentation hypothesis, the existence or otherwise of substitution of foreign rice for local rice across regions and the extent of substitution if it indeed exists. Regional price data is used in order to take into account cultural dynamics, which defines the consumption patterns and taste of people. Contrary to previous studies, this study investigates an important aspect of agricultural economics, which is the substitution of commodities, which has not received much attention in the literature.
The rest of the study is organised as follows. Section two focuses on review of previous studies on market integration with emphasis on the cereal market. Section three presents the discussion of the methods applied. Section four discusses the major findings of the study. Lastly, section five concludes and makes policy recommendations.
LITERATURE REVIEW
Spatial integration has been defined in the literature as when the prices of homogenous products in spatially dispersed markets converge into a uniform market. The existence of spatial integration is important for the effectiveness of macroeconomic policies, technological adaptation, and adjustment in net export flows across space. Not well-functioning markets can choke the gains from technological change. The importance of spatial integration has spurred the interest among researchers. However, majority of these studies focused on the integration of international rice market and the domestic rice markets (Dawe 2008; Robles 2011; Abbot and Borot de Battisti 2011; de Janvry and Sadoulet 2010; Benson et al. 2008; Cudjoe et al. 2010; Minot 2011). Evidence from the literature shows that, on the average, the transmission rate for Africa is low due to poor integration into the world economy and infrastructural deficits. Intra-regional integration of domestic markets is important because of the structural differences that exist between and among regions. In this section, the discussion focuses on spatial integration of domestic markets with emphasis on developing economies.
Studies on spatial integration of the rice market in Asia include Ghosh (2000), Jha et al. (2005), Pramod Kumar and Sharma (2003), Trung et al. (2007), and Hossain and Verbeke (2010). Ghosh (2000) investigated spatial integration of rice markets in India using the Johansen approach and monthly data from March 1984 to April 1997. The result showed one common stochastic trend for Uttar Pradesh, which suggests that all prices are pair-wise cointegrated. However, multiple common stochastic trends were found in Bihar, Orissa and West Bengal, which suggests that prices are not pair-wise cointegrated.
Pramod Kumar and Sharma (2003) examined price integration and pricing efficiency in the state of Haryana. The result showed that all four paddy markets are cointegrated and, hence, exhibit a long run relationship. However, the error correction model revealed weak association among the markets. This is attributed to the paucity of availability of information and lack of quicker dissemination of available information. Relatively, adjustment was found to be quicker in the post-liberalization period than the pre-liberalization period. Jha et al. (2005) also examined market integration in 55 wholesale rice markets in India using monthly data from Jan 1970 to Dec 1999. The authors found evidence of market integration, but it was far from complete. This was explained by the authors, as a result, of excessive interventions by the government in the rice market.
The above studies employed symmetric models in analysing spatial integration. The major assumption of these models is that transport cost is linear. However, the symmetric models particularly the Johansen multivariate model allows for multiple trade relation analyses. Trung et al. (2007), however, employed asymmetric model to analyse integration of rice markets in Vietnam. The study covered three empirical questions relating to market integration in Vietnam. In the first empirical question, the authors tested spatial integration between paddy markets in the North and South of Vietnam. The result showed weak evidence of market integration in the North and South of Vietnam with an absence of threshold effects. In the second empirical question, the authors tested for spatial integration in paddy markets within the North and within the South. The result showed evidence of spatial market integration for paddy markets within the North and within the South. Lastly, the study determined whether within-region integration is stronger and faster than between-region integration. The result showed that the extent and speed of price transmission within regional paddy markets is faster in the South than the North of Vietnam. However, the study found that the law of one price only holds for a few regions and market pairs. The weakness of this approach is that it is only bivariate in nature and, therefore, defines trade relations to be only bilateral. The bivariate nature of the model also requires the researcher to define local and central markets that are arbitrary in nature.
In Africa, a reasonable number of studies have analysed spatial integration in the rice market. Most recent of this review include Ojo et al. (2013), Ifejirika (2013), Mafimisebi et al. (2014), Fiamohe et al. (2013), Amikuzuno et al. (2013), Cudjoe et al. (2008), and Asuming-Brempong and Osei-Asare (2007).
Ojo et al. (2013) examined the existence of spatial market integration in Kwara and Niger states. The study used monthly data covering the period from 2006 to 2010. The Vector error correction model and the Engle granger causality were used in the data analysis. The result showed that markets are spatially integrated in the long run, but in the short run no evidence of market integration was found. Ifejirika (2013) analysed the degree and determination of market integration in rural and urban rice markets in Nigeria. The result showed that rice markets in the study area are integrated albeit the level of integration is low (Mafimisebi et al. 2014) also analysed market efficiency in the local rice market using data from the six Southwest states of Nigeria. The authors, also, applied Johansen multivariate cointegration and Engle and Granger causality. The result of both the pairwise and Johansen multivariate cointegration showed evidence of the existence of high degree of market efficiency.
Fiamohe et al. (2013) examined spatial integration of local rice markets in Benin and Mali using Enders and Siklos’s threshold models. The data period covered Jan 2000 to Dec 2010. The result showed that increases in price in the surplus-zone
market are transmitted quickly to the consumer market than decreases in price in Benin. Thus, there is asymmetric price transmission. However, the result for Mali showed symmetric price transmission between the market in the surplus-zone and the consumer market.
In Ghana, a few studies on spatial integration of rice markets exist in the literature. Assuming Brempong and Osei-Asare (2007) analysed the relationship between imported rice and local rice in Ghana using the Engle and Granger two-stage approach. The result showed that imported rice market is segmented from the domestic rice markets in Ghana. However, Amikuzuno et al., (2013) and Cudjoe et al., (2008) provided evidence of integration of local rice market and imported rice market. Amikuzuno et al. (2013) examined the transmission of price signals between imported and local wholesale rice prices from 2006 to 2011 in Ghana. Result revealed the existence of long run relationships and partial transmission of price shocks from local to imported rice prices, but the latter do not dominate prices of the local rice. Cudjoe et al. (2008) also confirmed that the rice markets in Ghana are relatively integrated, but not perfect.
Though spatial integration and the relationship between local rice and imported rice have been analysed, the important question of the existence of substitution of commodities remains unanswered. In this study, we analyse the spatial integration of imported rice. Secondly, we determine whether there exists significant substitution of foreign rice for local rice among consumers. In addition, complementary hypotheses including market segmentation, common dynamics, law of one price and price leadership role are developed and tested.
MATERIAL AND METHODS
This section provides a brief description of the methods employed in this study. The study uses monthly data of real local rice price and real imported rice price from January, 2006 to December, 2013. Data is sourced from the FAOSTATS EGIEWS.
Cointegration
Ghana. The ARDL model (Pesaran et al., 2001) is applied, in this study, to analyse the existence of substitution of imported rice for local rice and the extent of the substitution in Ghana. This approach is chosen because it allows both stationary and nonstationary series.
Johansen Multivariate Cointegration
Johansen cointegration is a maximum likelihood estimation which is based on a dynamic vector autoregressive framework. The approach begins with a VAR representation as Eq. 1 and Eq. 2.
t t t t t t t t y y b b b b y y a a a a y y 2 1 2 2 2 1 22 21 12 11 1 2 1 1 22 21 12 11 2 1 2 1 (1)
Where y is an n x 1 vector of endogenous variables and
is n x 1 vector of contemporaneous errors assumed tobe white noise. In a compact form, equation one can be reformulated as Eq. 2.
t t t
t Ay A y e
y
1 1 2 2 (2)
From the matrix representation, Eq. (2) can be reformulated in a more general form as in Eq. 3 and Eq. 4. t k t k t
t A y A y e
y
1 1 ... (3)
1 1 1 k i t t i t it y y e
y ; VAR (k) (4)
where 1 is n x n matrix of long run parameters and i is P x P matrix of short run parameters.
With n variables, the maximum rank of the matrix is n. If has a rank of r = n, then there is full rank, and the issue of cointegration does not arise. Also, if the matrix is null, there is no error correction mechanism, and the ‘n’ variables do not exhibit a common deterministic trend. However, if the rank of is r < p, the rows of 1 form r cointegrating vectors. That is there are r linear combinations of the n variables that are stationary and hence r long-run equilibrium relationships. The linear combination cancels out the stochastic trends in the series and, as a result, the regression would be meaningful, i.e. not spurious. As Granger (1987, p.226) notes, “test for cointegration can thus be thought of as a pre-test to avoid spurious regression." Although there must be a VAR representation of the model, cointegration implies a restriction on the rank of the matrix.
The Johansen approach is concerned with estimating the
matrix in an unrestricted form, and testing the restrictions implied by the reduced rank of. The cointegrating vector β is solved as the eigenvectors associated with the r largest statistically significant eigenvalues using two test statistics; maximum eigenvalue statistics and trace statistics. The result of the trace and maximum eigenvalue statistics provide information on the existence of spatial integration in the foreign rice market in Ghana. Deterministic trends are included in the test to account for transportation cost and quality price differential. The strong form of the hypothesis is tested by imposing the restriction
kj ij
for all j (j=1, …r) cointegration vectors for the ith and kth markets using the likelihood ratio test
statistics. Lastly, the test of weak exogeneity is conducted by imposing the restriction ij 0 for all j
(j=1, ...r) cointegration vectors for the ith market using
the likelihood ratio test statistics. This hypothesis has implication for market leadership roles in the imported rice markets in Ghana.
Autoregressive Distributed Lag Model
The ARDL model by Pesaran et al. 2001 is a dynamic regression model. The dynamic nature of the ARDL model allows the system to account for the sluggish adjustment process. The approach involves estimating an unrestricted error correction model of the form
a m b l it jt j it i m jt jm m it im itit PLR PIR PLR PIR
PLR 1
1
1
(5)
Where i denotes the ith local rice market, j portends the
jth imported rice market, m denotes the lag length and
‘a’ and ‘b’ denotes the maximum optimal lag length selected. Because it is not possible to know a priori whether, for instance, the price of local rice market is the ‘long run forcing’ variable for the price of imported rice due to the high levels of temporal aggregation involved the current values of the difference variables are excluded. The test of market integration involves restricting the lagged level variables in the Eq (5) to zero. Thus,
0 :
0 i j
H ; no level relationship
0 :
0 i j
H ; level relationship
The resulting F-statistics is then compared with the Pesaran et al. (2001) two asymptotic critical bounds to determine the existence of level relationship.
The existence of cointegration implies the existence of an error correction mechanism. This leads to an error correction model of the form (Eq. 6),
1 ˆ1 1 1
1 * 1 * 1 0 1 1 1 ) ˆ , 1 ( i k j q i it j t ji t i t j jt j t it PIR PLR w PIR ECT PLR (6)
Where w is a deterministic term and ECT is the error correction term. Based on the error correction model, the author tests for market segmentation by imposing the restriction,
0 ; 0
: *
0 ji
H
The second hypothesis, common dynamics, involves imposing the restriction below:
* *
0: i j
H
* *
0: 1; i j
H
RESULTS AND DISCUSSION
In this section, the major findings of the study are discussed. Specifically, this section is categorised into three. The first involves a preliminary analysis of the data. Second, the study examines the spatial integration hypothesis along with some complementary hypothesis. The third considers analysis of substitution of imported rice for local rice.
Descriptive Statistics and Time Series Plot
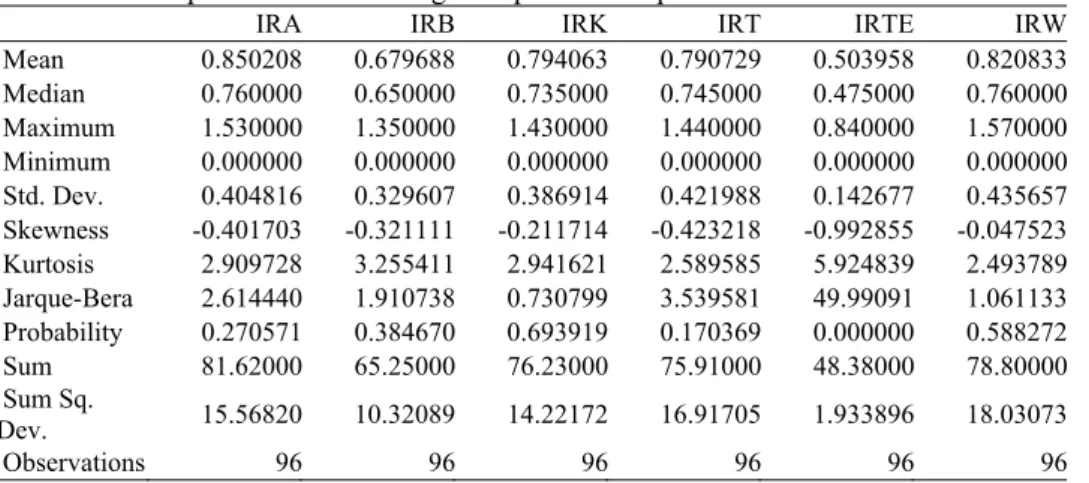
Table 1 shows the descriptive statistics for regional prices of imported rice. On the whole, the largest mean regional price occurred in Accra followed by Wa, Kumasi, and Tamale. The mean regional rice price was lowest in Techiman. The extent of volatility, as measured by standard deviation, is high. A high standard deviation suggests higher volatility clustering. Also, all regional prices of imported rice are negatively skewed, a result that means that there are more decreases than increases. The value of Kurtosis and the Jacque-Bera test indicate that all regional imported rice prices except for Wa are normally distributed.
Figure 2 shows that regional prices of imported rice remained high in Wa followed by Techiman. Regional prices of imported rice remained low in Accra. Further investigation of the figure reveals similar patterns in the trend of regional imported rice. Regional prices of imported rice remained immune to the 2007/2008 crisis in the early periods. As shown in Figure 1, regional prices of imported rice showed a downward trend in early 2007 with evidence of a gentle rise in April/May. Also, there seems to be an effect of the government decision to withdraw import duties on imported rice. It is evident that, in early 2008, regional prices of imported rice slacked. However, few months after the reinstatement of the import duties, regional prices of imported rice surged again. As shown in Figure 2, all regional prices of imported rice show a hump shape. There is also a noticeable drop in regional prices of imported rice in mid-2010, however, beginning from mid-2011, regional prices of imported rice surged consistently.
Table 2 shows the descriptive statistics for regional prices of local rice. The mean regional price of local rice is highest in Techiman followed by Accra. The mean regional price of local rice is lowest in Tamale. The deviation of the actual regional price of local rice from the mean regional price of local rice is high in Techiman but lowest in Kumasi. Except for Accra, regional prices of local rice are negatively skewed, which means that there are more decreases than increases. The value of the kurtosis and the Jacque-Bera test indicate that regional prices of local rice for Accra, Tamale, and Techiman are normally distributed. However, the test and the value of Kurtosis show that regional prices of local rice for Bolga, Kumasi, and Wa are not normally distributed.
0 1 2 3 4 5 6
2006 2007 2008 2009 2010 2011 2012 2013 real price of local rice-Accra
real price of local rice-Bolga real price of local rice-Kumasi real price of local rice-Tamale real price of local rice-Techiman real price of local rice-Wa
Figure 2: Time series plot for regional prices of imported rice
Figure 3: Time series plot for regional prices of local rice
Figure 3 shows the time series plot for regional prices of local rice. Generally, the trend follows the trend for imported rice. Figure 3 shows a humped-shape regional price of local rice when government reinstated the import duties on imported rice. The trend, thereafter, shows a downward trend with periods of rise and fall. However, the trend reverts upwards beginning from mid-2011. The matching trends in imported rice and local rice is evident of substitution of one for the other.
Unit Root Test
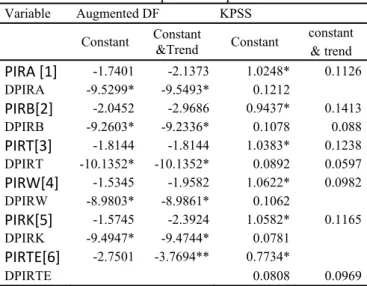
Analysing unit root properties of the series are a requirement for cointegration analysis. In this study, the ADF and KPSS tests are employed to check unit properties of local rice price and imported rice price. Table 3 shows the result of the ADF and KPSS test for price of imported rice. The result shows that for the model with constant without trend, the null hypothesis of unit root in levels cannot be rejected for all price series. Similar result is obtained using the KPSS test which concludes that the null hypothesis of trend
0 1 2 3 4 5 6 7 8
2006 2007 2008 2009 2010 2011 2012 2013 real price of imported-Accra
stationary cannot be accepted. However, the test on the first difference of the series shows that the null hypothesis of unit root cannot be accepted and the null hypothesis of trend stationary cannot be rejected. Thus, the series are integrated of order one. The acceptance of the null of unit root in levels using the ADF test and the rejection of the null of trend stationary using the KPSS test implies that the series have unit process.
Next, the series are examined assuming a model with a constant and trend. The result shows that the price series in levels for all markets except the market in Techiman have unit root using the ADF test. However, the test based on the KPSS shows that the null hypothesis of trend stationary cannot be rejected. The acceptance of the null of unit root in levels using the ADF test and the acceptance of the null of trend stationary using the KPSS test suggests that either the data or the tests do not provide sufficient information to discriminate between whether there is unit root process or a deterministic trend in the price series in these markets. The test of unit root using the ADF shows rejection of the null of unit root for the price series in Techiman, but the test based on the KPSS shows acceptance of the null of trend stationary. This implies
that there is a deterministic trend in the price series in Techiman.
Next, the author examines the price of local rice. The result is as shown in Table 4. Based on the model with constant but no trend, both the ADF and KPSS tests reject the null of unit root and trend stationary, respectively for the price series in Bolgatanga, Wa and Kumasi. This implies that either the data or the tests do not provide sufficient information to discriminate between unit root process and deterministic trends. However, the ADF test accepts the null hypothesis of unit root, but the KPSS test rejects the null of trend stationary for the price series in Accra and Techiman. By implication, the price series in these markets have unit root process. Considering the model with constant and trend, it is shown that the ADF test rejects the null hypothesis of unit root, but the KPSS test accept the null hypothesis of trend stationary for price series in Accra, Bolgatanga, Wa, and Kumasi. By implication, the price series in these markets have deterministic trends. Lastly, the test on price series in Techiman shows that both tests accept their null an indication of an inconclusive result.
Table 1: Descriptive statistics for regional prices of imported rice
IRA IRB IRK IRT IRTE IRW
Mean 0.850208 0.679688 0.794063 0.790729 0.503958 0.820833 Median 0.760000 0.650000 0.735000 0.745000 0.475000 0.760000 Maximum 1.530000 1.350000 1.430000 1.440000 0.840000 1.570000 Minimum 0.000000 0.000000 0.000000 0.000000 0.000000 0.000000 Std. Dev. 0.404816 0.329607 0.386914 0.421988 0.142677 0.435657 Skewness -0.401703 -0.321111 -0.211714 -0.423218 -0.992855 -0.047523 Kurtosis 2.909728 3.255411 2.941621 2.589585 5.924839 2.493789 Jarque-Bera 2.614440 1.910738 0.730799 3.539581 49.99091 1.061133 Probability 0.270571 0.384670 0.693919 0.170369 0.000000 0.588272 Sum 81.62000 65.25000 76.23000 75.91000 48.38000 78.80000 Sum Sq.
Dev. 15.56820 10.32089 14.22172 16.91705 1.933896 18.03073
Observations 96 96 96 96 96 96
Source: author’s calculations
Table 2: Descriptive statistics for regional prices of local rice
LRA LRB LRK LRT LRTE LRW
Mean 0.730521 0.621771 0.607979 0.442917 0.853542 0.603542 Median 0.675000 0.630000 0.625000 0.405000 0.795000 0.585000 Maximum 1.380000 1.070000 0.830000 0.830000 1.470000 0.980000 Minimum 0.000000 0.000000 0.000000 0.000000 0.000000 0.000000 Std. Dev. 0.274741 0.156427 0.110196 0.163835 0.388658 0.169929 Skewness 0.041561 -1.529734 -3.392549 -0.144955 -0.571598 -1.446335 Kurtosis 3.275128 9.236819 20.65218 3.769847 3.226505 7.622977 Jarque-Bera 0.330418 193.0330 1400.746 2.706848 5.432815 118.9578 Probability 0.847717 0.000000 0.000000 0.258354 0.066112 0.000000 Sum 70.13000 59.69000 57.15000 42.52000 81.94000 57.94000 Sum Sq.
Dev. 7.170874 2.324599 1.129316 2.549983 14.35020 2.743196
Observations 96 96 94 96 96 96
Table 3: Unit root test for price of imported rice
Variable Augmented DF KPSS
Constant Constant
&Trend Constant
constant & trend PIRA [1] -1.7401 -2.1373 1.0248* 0.1126 DPIRA -9.5299* -9.5493* 0.1212
PIRB[2] -2.0452 -2.9686 0.9437* 0.1413
DPIRB -9.2603* -9.2336* 0.1078 0.088
PIRT[3] -1.8144 -1.8144 1.0383* 0.1238
DPIRT -10.1352* -10.1352* 0.0892 0.0597
PIRW[4] -1.5345 -1.9582 1.0622* 0.0982
DPIRW -8.9803* -8.9861* 0.1062
PIRK[5] -1.5745 -2.3924 1.0582* 0.1165
DPIRK -9.4947* -9.4744* 0.0781
PIRTE[6] -2.7501 -3.7694** 0.7734*
DPIRTE 0.0808 0.0969
Notes: [1] Price of imported price in Accra; [2]Price of imported price in Bolgatanga; [3] Price of imported price in Tamale; [4] Price of imported price in Wa; [5] Price of imported price in Kumasi; [6] Price of imported price in Techiman.
Table 4: Unit root test of price of local rice
Variable Augmented DF KPSS
Constant Constant
&Trend Constant
Constant &Trend PLRA[1] -1.3536 -3.7987** 1.0248* 0.1045
DPLRA -10.27* 0.1212
PLRB[2] -3.50** -3.5841** 0.9437* 0.0930
DPLRB 0.1078
PLRW[3] 3.8026* -8.1929* 1.0622* 0.1059
DPLRW 0.1062
PLRK[4] -5.741* -5.7460* 1.0582* 0.0744
DPLRK 0.0781
PLRTE[5] -1.8158 -2.5756 0.7734*
DPLRTE -7.926* -7.9631. 0.0808 0.11008 Notes: [1] Maize price in Accra;[2] Maize price in Bolgatanga; [3] Maize price in Wa; [4] Maize price in Kumasi; [5] Maize price in Techiman
Spatial Integration of Regional Imported Rice Markets in Ghana
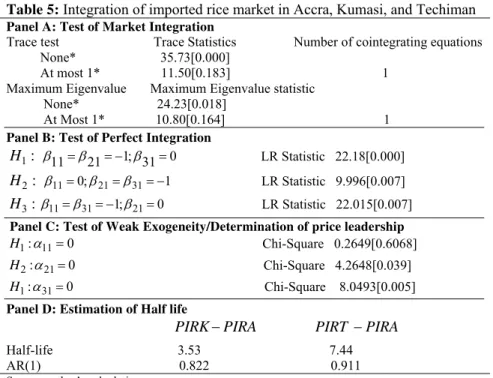
In this section, we test the spatial market integration hypothesis for imported rice market. Since Accra is the focal central market when it comes to imported rice, it is ceded against the other regional markets. This is to say that major regional trade of imported rice in the country revolves around the Accra market. In this study, all regional prices are assumed to be endogenous. This is to help determine objectively the market whose price provide the primary source of information that drives the common trend in the long run. As a result, the Johansen multivariate cointegration approach is adopted. Also, this approach provides an opportunity to analyse all the complex trade relations that may exist in this market. Complementary hypotheses are further developed. Specifically, the author tests the strong form of spatial integration and price leadership roles. Also, half-life indicators are estimated. Table 5 shows the result for trade relations among Accra; Kumasi and Techiman and Table 6 shows the result for the trade relations among Accra, Bolgatanga, Wa and Tamale.
In table 5, panel A, we test for the existence of spatial integration among the rice markets in Accra, Kumasi and Techiman. The trace and maximum eigenvalue tests both indicate the existence of one cointegration relation, which means that price series in these markets are cointegrated. In other words, there is common deterministic trend in the price series of these markets. Thus, albeit their short term path may diverge, in the long term there is convergence in their path. The existence of spatial integration among these markets implies that information flows freely among these markets and hence this sub-market relation can be described as efficient.
Conditioned on the existence of spatial integration among these markets the test of the strong form of spatial integration is justified. This is shown in panel B. The test of perfect spatial market integration asserts that, taken into account price differences due to transportation cost and quality price differential, prices in spatially dispersed markets tend equal. The result shows that prices in these markets do not tend equal when price differences due to transportation cost and quality price differentials are taken into account. This implies that the spatial integration identified cannot be described as perfect. By implication, arbitrage is a profitable business in this sub-market. Thus, the imperfect spatial integration of these markets provide arbitrage opportunities in this sub-trade network.
Next, we determine the market whose price provides the primary source of information that drives the common trend in the long run. The result is shown in panel C. The test indicates that the null hypothesis that imported rice prices in Kumasi and Techiman are weakly exogenous cannot be accepted. Thus, these markets do respond to deviations from the long run trend. However, the null hypothesis that imported rice price in Accra is weakly exogenous cannot be rejected. This means that the price of imported rice in the Accra market does not respond to deviations from the long run trend and, therefore, can be considered as one of the forces that ‘guide’ the system. Thus, price of imported rice in Accra provides the primary source of information that drives the common trend in the long run. The implication is that, for this sub-trade network, the Accra market emerge as the market leader while the Kumasi and Techiman markets are followers.
shown in figure 4, the degree of the fluctuation range decreased during the food crisis in 2007/2008. This can be linked to government policy intervention during the crisis period. During this period, import tariffs on imported rice were removed to mitigate the international transmission to the domestic market. However, the degree of the fluctuation range increased significantly when the government re-instituted the import tariff on rice.
-5 -4 -3 -2 -1 0 1 2 3
2007 2008 2009 2010 2011 2012 2013 Cointegrating relation 1
Figure 4: Dynamic analysis of long run equilibrium
The next sub-trade network to be discussed is Bolgatanga-Wa-Accra-Tamale. Table 6 shows the result. Panel A shows the result for the test of spatial integration among these markets. Both the trace and maximum eigenvalue statistics indicate that there is one cointegration relation. Thus, there is a common deterministic trend in the price series in these markets. In other words, the short term path of these price series diverge in the short run, but in the long run there is a convergence. This convergence in the price series of these markets implies that these markets are spatially integrated. An implication of spatial integration is that information flows freely in the sub-trade network, and, thus, these markets can be described as efficient.
Next, we test for the existence of perfect spatial integration conditioned on the evidence of spatial integration in this sub-trade network. This hypothesis asserts that prices in spatial dispersed markets tend equal when price differences due to transportation cost and quality price differentials are taken into account. The result is shown in panel B of table 4. The result indicates that the null hypothesis of one price in these markets cannot be accepted. Thus, prices of imported rice in these spatial integrated markets differ significantly from one another. An implication is that arbitrage is a profitable business in this sub-trade network. Thus, there is significant trade flows among these markets.
The next hypothesis is concerned with determining which of these market prices provide the primary source of information that drive the common trend in the long run. The result is shown in panel C of
Table 6. The result shows that at 5% and 10% significance levels the price of imported price in Bolgatanga and Tamale are not weakly exogenous. Thus, the price of imported rice in these markets do respond to the deviations from the long run. However, the null hypothesis of weakly exogenous price cannot be rejected for the price series in Accra and Wa. This means that the price series in these markets do not respond to the deviations from the long run equilibrium. In other words, the price series in Accra and Wa can be considered as one of the forces that ‘guide’ the system. Thus, the price series in the Accra and Wa markets provide the primary source of information that drives the common trend in the long run. The implication of this result is that the markets in Accra and Wa emerge as the market leaders in this sub-trade network, and the markets in Tamale and Bolgatanga are followers.
Furthermore, we estimate the half-life indicators for this sub-trade network. The result is shown in panel D of table 6. The result shows that shocks in the Accra market have temporal effects on the markets in Tamale and Bolgatanga. However, shocks in the Wa market have a permanent effect on the market followers. Relatively, the market in Tamale responds more quickly to the market in Accra than the market in Bolgatanga. The estimated half-life indicator shows that it takes 1.1 months to transmit 50% of the total effect of the shock in the Accra market to the market in Bolgatanga. However, it takes 1.4 months to transmit 50% of the total effect of the shock in the Accra market to the market in Bolgatanga. This implies that relatively the market in Tamale is well-integrated with the market in Accra than the market in Bolgatanga. On the contrary, it is found that the market in Bolgatanga responds more quickly to the market in Wa than the market in Tamale. The estimated half-life indicator shows that it takes 1.9 months to transmit 50% of the total shock effect in Wa to Bolgatanga. However, it takes 5.36 months to transmit 50% of the total shock effect in Wa to Tamale. This implies that the market in Bolgatanga is well-integrated with the market in Wa than the market in Tamale. The differences in the extent of market integration within this sub-trade network can be explained by proximity differences. The above result shows that proximity is an important determinant of market integration.
Table 5: Integration of imported rice market in Accra, Kumasi, and Techiman
Panel A: Test of Market Integration
Trace test Trace Statistics Number of cointegrating equations None* 35.73[0.000]
At most 1* 11.50[0.183] 1 Maximum Eigenvalue Maximum Eigenvalue statistic
None* 24.23[0.018]
At Most 1* 10.80[0.164] 1
Panel B: Test of Perfect Integration
:
1
H 11211;310 LR Statistic 22.18[0.000]
:
2
H 110;21311 LR Statistic 9.996[0.007]
:
3
H 11311;210 LR Statistic 22.015[0.007]
Panel C: Test of Weak Exogeneity/Determination of price leadership
0 : 11
1
H Chi-Square 0.2649[0.6068] 0
: 21
2
H Chi-Square 4.2648[0.039] 0
: 31
1
H Chi-Square 8.0493[0.005]
Panel D: Estimation of Half life
PIRKPIRA PIRT PIRA
Half-life 3.53 7.44 AR(1) 0.822 0.911 Source: author’s calculations
Table 6: Integration of imported rice market in Bolgatanga, Tamale, Accra, and Wa
Panel A: Test of Market Integration
Trace test Trace Statistics Number of cointegrating equations None* 61.206[0.009]
At most 1* 24.194[0.183] 1 Maximum Eigenvalue Maximum Eigenvalue statistic
None* 37.012[0.017]
At Most 1* 24.194[0.164] 1 Panel B: Test of Perfect Integration
:
1
H 1121311;410 LR Statistic 33.269[0.000]
:
2
H 110;2131411 LR Statistic 32.812[0.000] Panel C: Test of Weak Exogeneity/Determination of price leadership
0 : 11
1
H Chi-Square 12.118[0.000]
0 : 21
2
H Chi-Square 3.028[0.082]
0 : 31
1
H Chi-Square 0.1466[0.702]
0 : 41
1
H Chi-Square 2.611[0.106] Panel D: Estimation of Half life
PIRTPIRA PIRBPIRA PIRTPIRW PIRBPIRW
Half-life 1.1 1.4 5.36 1.9 AR(1) 0.525 0.610 0.879 0.700 Source: author’s calculations
Substitution of Imported Rice for Local Rice
First, we examine the existence of substitution of commodities in the rice market in Ghana. Different hypotheses are tested. First, we test for market integration in the rice market in Kumasi. This is shown in panel ‘A’ of Table 7. The test result reveals that the estimated f-statistics exceed the 1% significance critical value. This means that a level relationship exists between the market of imported rice and local rice in the Kumasi market. Thus, there is a common deterministic trend in the price series in this market. The short-term path of these price series in the Kumasi market diverge, but in the long term there is convergence. By implication, information flow freely between the imported rice market and the local rice market. The
second hypothesis is concerned with the test of perfect market integration. The result is shown in panel F of table 7. It shows that the price of imported rice and price of local rice do not tend equal in the Kumasi market. Thus, the imported rice market and the local rice market in Kumasi are integrated, but this cannot be described as perfect.
price of local rice implies that there is significant substitution of imported rice for local rice in the Kumasi market. Thus, increases in the price of imported rice cause a consumption switch among households away from imported rice to local rice. However, the estimated coefficient signifies that the extent of substitution is weak, which confirms the fact that substitution cannot be described as complete. Thus, there is a partial shift in households’ consumption balance of foreign rice and local rice. A lot of factors may militate against the complete shift in households’ consumption balance when the price of foreign price change. The first is the quality differential between the foreign rice and local rice. The second is consumption addiction of some households. The third is the limited production scale of local rice which makes it impossible to meet growing demand. Thus, even if consumers want to switch from foreign rice to local rice, the limited supply of local rice will not make this possible. The important point established in this study, however, is that there is a significant substitution between foreign rice and local rice among households in Kumasi in the long run.
-4 -3 -2 -1 0 1 2 3 4 5
07 08 09 10 11 12 13 Cointegrating relation 1
Figure 5: Dynamic analysis of long run equilibrium
In the short run, the relationship between the price of foreign rice and the price of local rice is positive, but this is not statistically significant. This implies that in Kumasi, there is no significant substitution between foreign rice and local rice in the short run. By implication, there is no significant shift in the households’ consumption balance of foreign rice and local rice in the short run. Thus, government policy to make the foreign rice less competitive in the domestic economy, in the short term, will not cause any significant switch in consumers’ purchasing pattern. As explained earlier, this is, as a result, of a host of factors which include limited production scale of local rice, the quality differential in the two products, and consumption addiction of consumers. An important variable of interest is the error correction term which is negative and statistically significant at the 1% significance level. The estimated coefficient is high, which implies that shocks in this market is quickly corrected for. This result suggests that the foreign rice market and local rice market in Kumasi are integrated also in the short run.
The next hypothesis is concerned with finding out if foreign rice price in Kumasi does granger cause local rice price in Kumasi. This is shown in panel D of Table 7. The test shows that the null hypothesis of segmented markets cannot be accepted. This means that, in the Kumasi market, prices of foreign rice do granger cause prices of local rice. By implication, the local rice and foreign rice markets in Kumasi are not segmented. Next we determine if the only past information needed to predict the price of local rice is the inter-market spread in the previous periods. The result is shown in panel E. It is established that the null hypothesis of common dynamics cannot be rejected. Thus, indeed the only past information needed to predict the price of local rice is the inter-market spread in the previous periods.
Lastly, on the Kumasi market, we calculate the half-life indicator. This is shown in panel G. It is established that shocks in the foreign rice market have a permanent effect on the local rice market in Kumasi. The estimated half-life is extremely high suggesting that it takes much longer period for 50% of the total shock effect in the foreign rice market to be transmitted to the local rice market in Kumasi.
The next region under consideration is the Bolgatanga market. The result is shown in table 8. Panel A shows the test of market integration. The estimated f-statistics exceeds the critical value at the 1% significance level, which suggests the existence of level relationship between the price of foreign rice and the price of local rice. The existence of level relationship suggests that the price of foreign rice can be treated as the ‘long run forcing’ variable for price of local rice. By implication, these two markets in Bolgatanga are spatially integrated in the long run. Thus, information flows freely between the two markets, and can, thus, be described as efficient. This leads to the test of perfect integration. This is shown in panel F of the table 8. The result shows the rejection of the null hypothesis of one price in the Bolgatanga rice market. Thus, price of local rice differs significantly from the price of foreign rice in this market.
price differences in the rice market in Bolgatanga cause consumption switch between the two types of rice. However, the last ardl model concludes that there is no significant substitution in the rice market in Bolgatanga. Lastly, the speed of the adjustment factor is negative, statistically significant and almost unity. This suggests close to 100% adjustment to long run equilibrium after disequilibrium. By implication, the local rice market and the foreign rice market are spatially integrated in the short run.
Next, the market segmentation hypothesis is tested in the Bolgatanga market. This is shown in panel D. The result shows that the null hypothesis of segmented markets cannot be accepted. Thus, the price of foreign rice in the Bolgatanga market do granger cause the price of local rice in the same market. By
implication, the local rice and foreign rice markets in Bolgatanga are not segmented. The result of the common dynamics hypothesis, which is shown in panel E, indicates that the only past information needed to predict the price of local rice is the inter-market spread in the previous periods. Lastly, the half-life indicator is estimated. This is shown in panel G. The result indicates that shocks in the foreign rice market in Bolgatanga have temporal effects on the local rice market in Bolgatanga. It is estimated that it takes 1.9 months to transmit 50% of total shock effect from the foreign rice market in the region to the local rice market in the same region. The relatively lesser half-life indicator shows that, in Bolgatanga, the local rice and foreign rice markets are well-integrated.
Table 7: Substitutability in the rice market in Kumasi
Panel A: Test for level relationship
5% significance critical values 1% significance critical values I(0) I(1) I(0) I(1)
FCAL=16.37 2.79 3.67 3.65 4.66
Panel B: ARDL Long run model
Variables ARDL(1,1) ARDL(1,2) ARDL (2,2)
PIRK .114* .112* .114**
(.044) (.044) (.049)
Constant .498* .498* .499*
(.039) (.039) (.044)
Panel C: ARDL Short run model Variables ARDL(1,1) ARDL(1,2) ARDL(2,2) DPLRK-1 -.101
(.107)
DPIRK .200 .199 .184
(.176) (.176) (.177)
DPIRK-1 .119 .115
(.173) (.174)
Constant .442* .444* .399*
(.063) (.063) (.079)
Ecm_1 -.88* -.89* -.80*
(.105) (.105) (.141)
Panel D: Market Segmentation
(22)
(23)
(23)0
;
0
:
1*0
IR
H
71.72*0
;
0
:
2** 1
0
IR
IR
H
71.86*0
;
0
:
2* 3*0
IR
IR
H
32.47*Panel E: Common Dynamics
(21)* 3 * 1
0
:
LR IRH
1.218Panel F: Law of one price
(22)* 3 * 1
0
:
1
;
LR IRH
187.64*Panel G: Estimation of half-life
PLR-PIR
(21) Half-life 19.74AR(1) 0.965
1
Table 8: Substitutability in the rice market in Bolgatanga
Panel A: Test for level relationship
5% significance critical values 1% significance critical values I(0) I(1) I(0) I(1)
FCAL=9.517 2.79 3.67 3.65 4.66
Panel B: ARDL Long run model
Variables ARDL(1,1) ARDL(1,2) ARDL (2,2)
PIRK .277* .276* .114**
(.0418) (.042) (.049)
Constant .433* .433* .435*
(.032) (.032) (.038)
Panel C: ARDL Short run model Variables ARDL(1,1) ARDL(1,2) ARDL(2,2) DPLRK-1 -.154
(.109)
DPIRK .179*** .181*** .159
(.091) (.099) (.099)
DPIRK-1 .004 .015
(.096) (.0.095) Constant .467* .467* .395*
(.057) (.057) (.077)
Ecm_1 -1.08* -1.08* -.909*
(.108) (.108) (.161)
Panel D: Market Segmentation
(22) (23) (23)
0 ; 0 : 1*
0 IR
H 100.59*
0 ;
0
: 1* 2*
0 IR IR
H 99.48*
0 ;
0
: 2* 3*
0 IR IR
H 32.38*
Panel E: Common Dynamics (21)
* 3 * 1
0: LR IR
H 1.257
Panel F: Law of one price (22)
* 3 * 1
0: 1; LR IR
H 248.02*
Panel G: Estimation of half-life
PLR-PIR (21) Half-life 1.97
AR(1) 0.703 1
15.674* Source: author’s calculations
The next region to be discussed is Wa. Table 9 shows the result. In the panel A, we test for market integration in the rice market in Wa. The result shows that there is level relationship between the price of local rice and the price of foreign price in the Wa market. Thus, there is a common deterministic trend in the price series of both types of rice in the Wa market. The existence of level relationship between prices of both rice types suggests that the local rice market and the foreign rice market in Wa are integrated. In other words, there is free flow of information between the two markets in Wa and can thus be described as efficient. This result leads to the test for perfect integration in the rice market in Wa. The result, as shown in panel F, indicates the rejection of the null hypothesis of one price. Thus, there is no one single market price in the rice market in Wa, and that prices of both rice types differ significantly from each other.
estimated to be negative, large and statistically significant. This means that disequilibria in the rice market in Wa is quickly corrected. Thus, there is a quick adjustment to long run equilibrium in the rice market in Wa. An implication of the result is that, in Wa, the local rice and foreign rice markets are spatially integrated in the long run.
The test of market segmentation and common dynamics is shown in panel D and E, respectively. The null hypothesis of segmented markets cannot be rejected. This implies that foreign rice price in Wa does granger cause the local rice price in Wa. Thus, the local rice market and the foreign rice markets are not segmented. However, the null hypothesis of common dynamics cannot be rejected. This means that the only information required to predict the price of local rice price in Wa is the inter-market spread in the previous periods. Lastly, the half-life indicator is estimated. This
is shown in panel G of table 9. The result first shows that shocks in the foreign rice market in Wa have a temporal effect on the local rice market in the same region. It is estimated that it takes 7.8 months to transmit 50% of the total shock effect from the foreign rice market to the local rice market in Wa.
Lastly, we analyse the extent of substitution of foreign rice for local rice in the Accra market. Panel A of table 10 shows the result for the test of market integration. The test shows that the estimated f-statistics exceed the upper critical f-value at 5% significance level. Thus, there is a common deterministic trend in the price series of these commodities in Accra. The existence of level relationship implies that the foreign rice market and local rice market in Accra are integrated. By implication, information flows freely between these markets in Accra, and, hence, can be described as efficient.
Table 9: Substitutability in the rice market in Wa
Panel A: Test for level relationship
5% significance critical values 1% significance critical values I(0) I(1) I(0) I(1)
FCAL=11.09 2.79 3.67 3.65 4.66
Panel B: ARDL Long run model
Variables ARDL(1,1) ARDL(1,2) ARDL (2,2) ARDL (2,1)
PIRK .227* .226* .230** .231*
(.035) (.036) (.049) (.043)
Constant .415* .414* .410* .412*
(.033) (.034) (.041) (.040)
Panel C: ARDL Short run model Variables ARDL(1,1) ARDL(1,2) ARDL(2,2) ARDL(2,1) DPLRK-1 -.199*** -.188***
(.104) (.103)
DPIRK .213 .206 .228* .238
(.192) (.193) (.191) (.190)
DPIRK-1 .106 .153
(.190) (.189)
Constant .415* .414* .328* .334*
(.055) (.063) (.071) (.070)
Ecm_1 -.999* -.999* -.80* -.81*
(.105) (.105) (.147) (.146)
Panel D: Market Segmentation
(22)
(23)
(23)
(22)0 ; 0 : 1*
0 IR
H 92.54*
0 ;
0
: 1* 2*
0 IR IR
H 91.68*
0 ;
0
: 2* 3*
0 IR IR
H 34.16*
0 ; 0 : 2*
0 IR
H 33.634*
Panel E: Common Dynamics (21)
* 3 * 1
0: LR IR
H 2.403
Panel F: Law of one price (22)
* 3 * 1
0: 1; LR IR
H 201.50*
Panel G: Estimation of half-life
PLR-PIR
(21) Half-life 7.8AR(1) 0.915* 1
Table 10: Substitutability in the rice market in Accra
Panel A: Test for level relationship
5% significance critical values 1% significance critical values I(0) I(1) I(0) I(1)
FCAL=4.40 2.79 3.67 3.65 4.66
Panel B: ARDL Long run model
Variables ARDL(2,1) ARDL(2,2) ARDL (2,0)
PIRK .581* .582* .580*
(.105) (.103) (.108)
Constant .250** .252* .246**
(.0996) (.098) (.103)
Panel C: ARDL Short run model Variables ARDL(2,1) ARDL(2,2) ARDL(2,0) DPLRK-1 -.430* -.427* -.435*
(.094) (.094) (.094)
DPIRK .049 .052 .191*
(.181) (.181) (.067)
DPIRK-1 -.078
(.178) Constant .085** .088** .081***
(.041) (.042) (.041)
Ecm_1 -.340* -.348* -.328*
(.100) (.102) (.099)
Panel D: Market Segmentation
(21)
(23)
(22)0
;
0
:
2*0
IR
H
11.539*0
;
0
:
3** 2
0
IR
IR
H
11.752*0
;
0
:
2*0
IR
H
11.014*Panel E: Common Dynamics
(21)* 3 * 1
0
:
LR IRH
2.838Panel F: Law of one price
(22)* 3 * 1
0
:
1
;
LR IRH
228.79*Panel G: Estimation of half-life
PLR-PIR
(21) Half-life 2.18AR(1) 0.728
1
16.034*Notes: *,** ,*** indicate 1%, 5% and 10% significance levels, respectively
Source: author’s calculations
The existence of market integration leads to the test of perfect market integration in the local rice and foreign rice markets in Accra. The result is shown in panel F. The test indicates that the null hypothesis of one price in the rice market in Accra cannot be accepted. This implies that there is no one price that exists in the rice market in Accra. In other words, prices in the foreign rice and local rice markets differ significantly in the Accra market.
Next, we examine the existence and extent of substitution of foreign rice for local rice in the Accra market. The result is shown in panel B and C. It is established in panel B that the relationship between local rice price and foreign rice price is positive and statistically significant at 1% significance level in the long run. This result is robust regardless of the ardl specification. The identified positive relationship
differential alone cannot fuel complete substitution in the rice market in Accra.
In the short run, the result is mixed. Two of the ardl specifications conclude that the relationship is positive, but statistically not significant. This suggests that there is no significant substitution between foreign rice and local rice in the Accra market in the short run. Thus, price differences in the short run do not cause any significant shift in households’ consumption balance of local rice and foreign rice. However, the ardl model which includes two lags of the price of local rice, but no lag of the price of foreign price shows that the relationship is positive and statistically significant. This suggests that there is significant substitution between the local rice and foreign rice in the Accra market. Another important variable of interest is the error correction term. The estimated error correction term is negative and statistically significant but below 35%. This suggests that adjustment to long run equilibrium after deviation form equilibrium is sluggish in the rice market in Accra. An important implication, however, is that the local rice and foreign rice markets in Accra are spatially integrated in the short run also.
Based on the error correction model, two complementary hypotheses are developed and tested. First is the hypothesis of market segmentation. Acceptance of this hypothesis suggests that foreign rice price does not granger cause the price of local rice in Accra. The result of the test as shown by the chi-square values indicates that the null hypothesis cannot be accepted. Thus, the price of foreign rice price in Accra do granger cause the price of local rice in Accra. By implication, both markets are not segmented in Accra. The second test is concerned with the test of common dynamics. The result shows non-rejection of the null hypothesis. This means that the only past information needed to predict the price of local rice in Accra is the inter-market spread in the previous periods.
Lastly, the half-life indicators in the rice market in Accra is estimated. First, the result shows that shocks in the foreign rice market produce temporal effects on the local rice market in Accra. It is estimated that it takes 2.18 months to transmit 50% of the total shock effect form the foreign rice market to the local rice market.
CONCLUSION AND POLICY RECOMMENDATIONS
This study examined spatial integration of domestic imported rice markets and the extent of substitution between local rice and imported rice. Data on prices covering the period from Jan 2006 to Dec 2013 was used. Econometric tools used include the Johansen multivariate and the Pesaran et al. (2001) ARDL cointegration models.
The result that foreign rice markets in Ghana are imperfectly spatially integrated suggests that arbitrage opportunities are not forgone in this market. Thus, imported rice market in Ghana provides opportunities for arbitrage. Price leadership role in this market has been shown to be dependent on the kind of
inter-regional-sub-trade network defined. On the whole, the Accra market emerged as the dominant market leader in this market. The impact of government policies succeeded in moderating the fluctuation range in this market during the 2007/2008 period. However, local markets differed in their response to shocks in the central markets.
Analysis of substitution of foreign rice for local rice has revealed the existence of significant but weak substitution in the long run with mixed results in the short run. The result that local rice and imported rice are not perfect substitutes is due to quality differences, consumption addiction, taste differences and cultural differences. By implication, a disincentive measure such as increasing import tariffs on imported rice will produce greater effects on households’ budget, but little impact on raising the producer prices faced by local rice producers. The evidence that the local rice market and the imported rice market are not segmented suggests that there is an incentive among local operators to invest and embark on innovations to help them adapt their supply to the constraints and preferences of consumers. Government must provide an incentive to local rice farmers to boost supply and also adopt innovative measures to improve upon the production and milling quality.
Acknowledgments: This article is part of a research fully funded by the Danish government under the Building Stronger University, the Growth and Employment Platform-ORID, University of Ghana. The financial support of the Danish government is greatly appreciated. The contribution of reviewers is also greatly acknowledged.
REFERENCES
ABBOTT, P. & BOROT DE BATTISTI, A. (2011). Recent Global Food Price Shocks: Causes, Consequences and Lessons for African Governments and Donors. Journal of African Economies, 20(1): i12-i62. doi: 10.1093/jae/ejr007
ASUMING-BREMPONG S. & OSEI-ASARE Y. (2007). Has Imported Rice Crowded-Out Domestic Rice Production in Ghana? What Has Been The Role Of Policy? AAAE Conference Proceedings, pg.91-97.
Retrieved from: http://ageconsearch.umn.edu/bitstream/52002/2/Asuming
BENSON, T. N. - MINOT, J. - PENDER, ROBLES, M. & VON BRAUN. J. (2008). Global food crisis: Monitoring and assessing impact to inform policy responses. Washington, D.C.: International Food Policy Research Institute. Retrieved from: http://www.ifpri.org/sites/default/files/publications/pr19_
1.pdf
Coalition for African Rice Development. (2010). “Mapping of Poverty Reduction Strategy Papers (PRSPs), Sector Strategies and Policies related to rice development in Ghana."
Food Policy, 35(4), 294–302. DOI: 10.1016/j.foodpol.2010.01.004
DAWE, D. (2008). Have Recent Increases in International Cereal Prices Been Transmitted to Domestic Economies? The Experience in Seven Large Asian Countries. Working Papers 08-03, Agricultural and Development Economics Division of the Food and Agriculture Organization of the United Nations (FAO - ESA).
DE JANVRY, A. & SADOULET, E. (2010). The Global Food Crisis and Guatemala: What Crisis and for Whom?
World Development, 38(9): 1328-39. DOI:
10.1016/j.worlddev.2010.02.008
ENGLE, R.F. & GRANGER, C.W.J. (1987). Cointegration and error correction representative, estimation and testing. Econometrica 55, 251-276.
http://links.jstor.org/sici?sici=0012-9682%28198703%2955%3A2%3C251%3ACAECRE%3 E2.0.CO%3B2-T
GHOSH, M. (2000). Cointegration Tests and Spatial Integration of Rice Markets in India. Indian Journal of Agricultural Economics, 55(4), 616-626.
HOSSAIN, M.I. & VERBEKE, W. (2010). Evaluation of rice markets integration in Bangladesh. The Lahore Journal of Economics 15(2), pp. 77-96. http://www.lahoreschoolofeconomics.edu.pk/JOURNAL/
vol%2015%20-%202/04%20Ismail%20and%20Wim%20TTC%20AC% 2014th%20Dec%202010.pdf
JHA R.- MURTHY K.V.B. & SHARMA A. (2005). Market integration in wholesale rice markets in India. ASARC Working paper 2005/03. https://crawford.anu.edu.au/acde/asarc/pdf/papers/2005/
WP2005_03.pdf
JOHANSEN, S. (1988). Statistical analysis of co-integrating vectors. J. of Economic Dynamics and
Control, 12, 231-254. DOI:
10.1016/0165-1889(88)90041-3
JOHANSEN, S. & JUSELIUS, K.. (1990). Maximum likelihood estimation and inferences on Co-integration
with application to the demand for money. Oxford Bulletin of Economics and Statistics, 52, 160-210. DOI: 10.1111/j.1468-0084.1990.mp52002003.x
MAFIMISEBI T.E. - AGUNBIADE B.O. & MAFIMISEBI O.E. (2014). Price variability, cointegration and exogeneity in the market for locally produced rice: A case study of Southwest zone of
Nigeria. Journal of Rice Research 2:118.
doi:10.4172/jrr.10000118.
Ministry of Food and Agriculture (MoFA). Statistics, Research and Information Directorate (SRID), “Agriculture in Ghana: Facts and Figures 2010."
http://mofa.gov.gh/site/wp- content/uploads/2011/10/AGRICULTURE-IN-GHANA-FF-2010.pdf
MINOT, N. (2011). Transmission of world food price changes to markets in sub-Saharan Africa. IFPRI Discussion Paper 01059, International Food Policy Research Institute. Washington, D.C. Retrieved from http://www.ifpri.org/sites/default/files/publications/ifprid p01059.pdf
OJO A.O.- BABA L.T.K.M. & ADENIJI O.B. (2013). Spatial integration of rice markets: the case of Kwara and Niger states, Nigeria. Journal of Agricultural and Veterinary Science 2(4) pp. 15-21.
http://www.iosrjournals.org/iosr-javs/papers/vol2-issue4/D0241521.pdf
PESARAN, M.H. - SHIN, Y.C. & SMITH, R. (2001). Bound testing approaches to the analysis of level relationships. Journal of Applied Econometrics 16, 289– 326. DOI: 10.1002/jae.616