PRICE VS QUALITY COMPETITION AND THE SPATIAL PATTERN OF
AVERAGE PRICES IN INTERNATIONAL TRADE
Affortunato Francesca
University of Chieti-Pescara, School of Advanced Studies
Mattoscio Nicola
University of Chieti-Pescara, Department of Quantitative Methods and Economic Theory
This work investigates the relationship between the average export prices and the distance between the origin and the destination market in international trade. Distance between trading partners obviously stands at the core of I international trade literature and is strictly related with the issue of how countries and firms compete on export markets when transport costs become increasingly stiff. Heterogeneous-Firm Trade (HFT) models predict that only most competitive firms are able to export on distant markets, where it is more difficult to recover from freight costs. However, this simple concept does not lead to unambiguous predictions on the spatial pattern of average export f.o.b. prices.
This work uses bilateral product-level data for five top-exporters (US, Germany, China, France, Italy) and all their world partners in order to test the main hypotheses derivable on this issue from theoretical literature. An huge dataset of bilateral international trade flows, the BACI dataset of CEPII, provides data both on values and quantities, allowing to construct products’ unit values (at the 6 digit level of the Harmonized System), approximating average exports’ prices. These data are used as the dependent variable of the econometric test and regressed on a set of explanatory variables: the distance of the destination market from the exporter and other importer’s characteristics. Thus, this test assesses which of the considered theoretical models fit the data best, shedding some light both on the sign and on the determinants of the spatial pattern of average prices. The main finding of this work is that theoretical models not embedding a quality dimension for products do not seem to fit the data very well: it is clear from the econometric test that a positive correlation between average exports’ prices and distance often emerges, denoting a “quality competition” pattern in addition to a possible alternative pattern of “price competition”. Moreover, theoretical models with a quasi-linear demand function (in contrast with a CES one) are able to better explain same evidences emerging from the data. Keywords: average prices, distance, quality, inter-firm selection, spatial price discrimination JEL codes: F1, F59, D4, Z1
1. Introduction
This work investigates the relationship between the average export prices and the distance from the origin market to the destination market in international trade. According to the most recent theoretical contributions in international trade (IT hereafter) theory, the following analysis uses bilateral trade data in order to test different hypotheses on the spatial pattern of average prices. International trade is still strongly affected by geographical distance, in spite of the technological progress which lowers transport costs (Hummels, 2009: 3). Trade flows always depend on the number of goods traded, on their quantities and prices. Distance has a compelling influence not only on the first two of these factors, determining the incidence of “zeros” in bilateral flows (Baldwin and Harrigan, 2011: 73), but also on products’ prices. Indeed, geographical distance implies transport costs, which hinder exporting firms’ competitiveness on distant markets.
is their price on the origin market (“producer’s price”). This work analyzes the relation between the export average f.o.b. prices and the distance between the trading partners.
Recent works of IT literature alternatively assign to the price-distance relation a negative sign (Melitz, 2003: 1717; Melitz and Ottaviano, 2008: 304), a positive sign (Baldwin and Harrigan, 2011: 79) or neither systematically a positive nor a negative sign (Kneller and Yu, 2008: 14). When present, the empirical test is carried out on a single country’s trade data.
This work uses bilateral trade data in values and quantities for the 5 top-exporters and their world’s partners (at the 6 digit level of the Harmonized System) to construct the unit values (as an approximation of average f.o.b. prices) and regress them on data for distances between trading partners and other characteristics of the importers (used as control variables).
2. Theory on the average price-distance relation
2.1. Mechanisms and variables affecting the average price-distance relation
Alchian and Allen (1964) formulated the hypothesis known as “shipping the good apples out”: the average prices of goods increase with the distance from the destination market, depending on a “compositional” effect in demand, due to the fact that per unit transport costs (3) benefit high-priced, high-quality goods as distance increases. Together with the modelling choice for transport costs’, quality has always played an important role in the analysis of the price-distance relation. One of the most recent waves of IT literature, that of Heterogeneous Firm Trade (HFT hereafter), grounded on Melitz (2003), has important implications on the analysis of the spatial pattern of average prices. These contributions are complementary to the Alchian-Allen hypothesis, since the HFT models are based on different mechanisms and on the assumption of iceberg transport costs (Baldwin and Harrigan 2011: 81).
Four HFT models have been analyzed (Melitz, 2003; Melitz and Ottaviano, 2008; Baldwin and Harrigan, 2011; Kneller and Yu, 2008), and different predictions for the price-distance relation have been drawn. The four examined HFT models share same basic assumptions: they are monopolistic competition models with firms randomly drawing a marginal cost c from a common distribution G(c) with support [0,cM]. Transport costs are “iceberg”, increasing in distance.
But they differ in other hypothesis:
- with a CES demand, firms adopt a “mill pricing strategy”; with a quasi-linear demand, firms “space-discriminate” when setting their optimal f.o.b. prices (Martin, 2009);
- firms may differ only for their efficiency or also for quality: if present, quality is modelled as a log-linear function of marginal cost, z = cσ , where z stands for the quality level, and σ ≥ 0 is the elasticity of quality to marginal cost and is country-specific. As a consequence, firms may be selected in each export market on the basis of their quality-adjusted prices, when σ > 1 (“quality sorting”) or on the basis of their observable prices, when 0 £σ £1 (“efficiency sorting”);
- the importer-specific cost cut-off, separating firms efficient enough to export from those which are not, is always a direct function of freight costs and either a direct function of market size or an indirect one, through its relation with a price index, negatively related with market size.
The HFT literature explains the average price-distance relation through two types of processes (see Affortunato and Mattoscio, 2012, for a more thorough review):
1) a possible intra-firm level process of spatial price discrimination; 2) an inter-firm selection process in export markets.
With regard to the second process of firms’ selection into export markets, firstly introduced in Melitz (2003), the standard HFT theory predicts that only most efficient firms can export. In models with asymmetric countries, this means that average prices decrease with distance, when quality is not considered (σ = 0) or when quality is not efficiently produced (σ £ 1); whereas it means that the average prices increase with distance (when quality is efficiently produced (σ > 1).
2.2. The predictions for the average price-distance relation in HFT theory
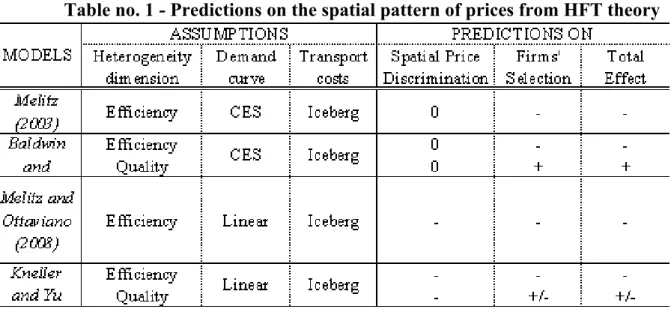
Below (Table no. 1) the predictions drawn from the four examined models are listed, according to the models’ assumptions on the said key-variables (quality, preferences and transport costs).
Table no. 1 - Predictions on the spatial pattern of prices from HFT theory
Table made by the authors
The firm’s optimal price is unrelated/negatively related with distance in models with a CES/quasi-linear demand. The inter-firm selection effect implies a positive/negative relation of average prices with distance in the case of quality/efficiency sorting. The last column lists the signs of the average price elasticity to distance resulting from these two mechanisms.
A second important relation is that of the average prices with the importer market size: though this is not the main focus of this work, some attention is due to this relation which helps assessing the theoretical models’ performances when carrying out the empirical test. To sum up:
- average f.o.b. prices are positively correlated with distance (and negatively with market size) in HFT models with CES demand and “quality competition”;
- average f.o.b. prices are inversely correlated with both distance and market size in HFT models with quasi-linear demand and “efficiency competition”;
- average f.o.b. prices are ambiguously correlated with both distance and market size in HFT models with quasi-linear demand and “quality competition”.
In the next paragraph, the econometric test and its results are described.
3. Testing the predictions on the average price-distance relation
3.1. Methodology and data
In this section, an econometric test is run to evaluate the above examined theoretical predictions on the spatial pattern of average prices. The econometric model regresses unit values (approximating average prices) on a measure of distance and on other explanatory variables: UVkij= αk + βXj + εkij [1]
UVkij= Vkij/Qkij [2]
where Vkij and Qkij are total values and quantities of product k, shipped from country i to j.
The set Xj of explanatory variable contains the following importer’s characteristics:
- real GDP, approximating for market size;
- real GDP per capita, accounting for wealth;
- a “border dummy”, for contiguity;
- a “language dummy” for sharing a common language with the exporter;
- a product
k
’s
average unit value, approximating a price index (as in Martin, 2009):
UVkj= ∑iwkijUVkij [3]
where wkij is the weight of good k exports from country i.
Unit values are from the BACI dataset (CEPII), developed by Gaulier and Zignago (2010); “products” are 6-digit Harmonized System codes and only codes for which at least 50 observations were available are used in the regression. Data on physical distances, border and language are from CEPII. Real GDP and real GDP per capita for 2007 are from the World Bank.
3.2. Results
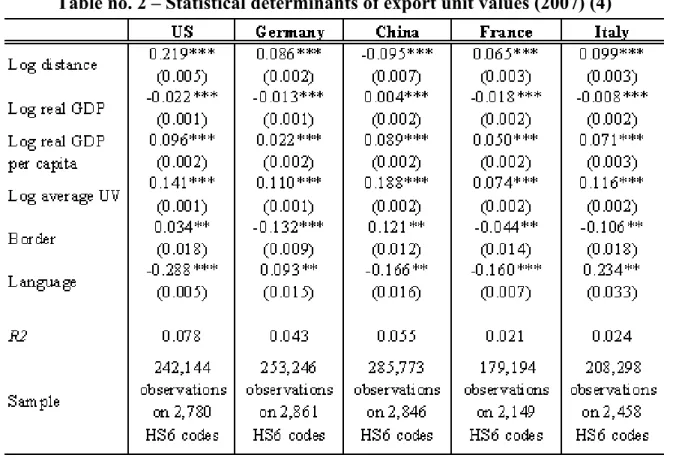
Running the regression [1] on the above cited data the following results emerge (Table no. 2):
Table no. 2 – Statistical determinants of export unit values (2007) (4)
Table made by the authors
From Table no. 2 it is evident that the correlation both between average f.o.b. prices and distance and between average f.o.b. prices and market size is always statistically significant. Also the average unit value has a high coefficient and is highly statistically significant.
Other important considerations emerge by looking at the sign of the combinations of the price-distance relation and of the price-market size relation: there is always an alternation of negative-positive or negative-positive-negative signs respectively in the case of China/others. In lines with the Baldwin-Harrigan model, this result could be interpreted in the sense that an efficiency/quality sorting pattern emerges respectively for China/others, in contrast with theoretical models without quality. However this constant alternation of signs could be due to the aggregation along the HS6 codes. In order to clarify that, the same regression [1] has been run separately on each HS6 code.
Table no. 3 – Combinations of Signs for the Price Elasticity to Distance and Market Size
Table made by the authors
The Baldwin-Harrigan model seems to be incompatible with the emergence of all possible combinations of sign for the correlation of average prices with distance and with market size. By contrast, the Kneller-Yu model can explain the results ensuing from this last regression. The importer’s market size enters models with quasi-linear preferences through its relation with the price index: as market size increases, competition becomes tougher and the price index decreases. Thus, only the most competitive goods are shipped on bigger markets: the average prices relation with market size is negative/positive in the case of efficiency/quality sorting.
In lines with the Kneller-Yu model, a quality sorting pattern may emerge in three cases, that is when the combination of signs for the price elasticity to distance and market size is:
- positive-positive (implying that the “selection effect” always dominates);
- positive-negative, when the “selection effect” dominates for distance and the “spatial price discrimination” leads for market size;
- negative-positive, when the “spatial price discrimination effect” dominates for distance whereas the “selection effect” prevails for market size.
By contrast, an efficiency competition emerges in the remaining case of a negative elasticity of average prices both to distance and to market size.
4. Conclusions
The main finding is that theoretical models not embedding a quality dimension for products do not seem to fit the data very well, being clear from the econometric test that a positive spatial pattern of average prices often emerges, denoting a “quality competition” pattern.
The Kneller and Yu model shows the best performances in explaining the data, since:
- it embeds a price index as one of the variables influencing the price-distance relation, as it clearly appears form the data.
The implications of the analysis relate to at least two fields of study: i) the firm-level strategies to keep competitive on export markets and the reallocation of resources as a consequence of firms’ selection; ii) the performances of trading countries in the global market and the consequent changes in their welfare. In the light of this work’s results, both firms and countries may vary their strategies or policies according to their choice of how to compete on export markets: they should encourage firms’ physical efficiency to price-compete; they should enhance firms’ efficiency in terms of the goods’ quality content, if they want to lead on a quality competition.
Notes
(1) The c.i.f. price (i.e. cost, insurance and freight price) is the price of a good delivered at the frontier of the importing country, including any insurance and freight charges incurred to that point, or the price of a service delivered to a resident, before the payment of any import duties or other taxes on imports or trade and transport margins within the country (UN, 1998).
(2) The f.o.b. price (free on board price) of exports and imports of goods is the market value of the goods at the point of uniform valuation (the customs frontier of the economy from which they are exported). It is equal to the c.i.f. price less the costs of transportation and insurance charges, between the customs frontier of the exporting (importing) country and that of the importing (exporting) country (UN, 1998).
(3) IT scholars typically express transport costs in ad valorem terms, that is as the percentage change in price induced by freight costs (Hummels, 2009: 8): pcif /pfob= 1+f/ pfob, where f is the per-unit freight cost and pcifand pfob are the c.i.f. and the f.o.b. price. Since Samuelson (1954), this f-term has been treated as an ad valorem tax equivalent (iceberg costs), that is as if f was a constant percentage of the value traded, implying that the c.i.f. price of a good relative to its f.o.b. price is not a function of the f.o.b. price: pcif /pfob = τ, with τ>1. By contrast, in industrial organization literature, an additive approach is preferred (keeping the f-term additive, as in the general formulation), so that the c.i.f. price-f.o.b. price ratio is an inverse function of the f.o.b. price and more expensive goods have a less than proportional greater trade costs.
(4) Dependent variable is log unit value of exports by HS6 product and export destination, relative to HS6 code mean (that is, HS6 code fixed effects are included in all regressions). Independent variables are the listed characteristics of export destinations. Estimator is OLS. Standard errors in parenthesis. Asterisks denote statistical significance: *** Significant at the 1 percent level; ** Significant at the 5 percent level; * Significant at the 10 percent level.
Bibliography
Books
1. Alchian, Armen Albert. and Allen, William Randall. University Economics: Elements of Inquiry. Belmont, California: Wadsworth, 1964
Articles
2. Affortunato, Francesca and Mattoscio, Nicola. “La relazione tra prezzi medi delle
esportazioni e distanza
”. Il Risparmio Review
2, (2012)
3. Baldwin, Richard and Harrigan, James. “Zeros, Quality and Space: Trade Theory and Trade Evidence”, American Economic Journal: Microeconomics, 3(2011): 60-88
4. Hummels, David. “Globalization and Freight Transport Costs in Maritime Shipping and Aviation”. Paris: OECD/ITF. International Transport Forum, WP 3(2009)
6. Melitz, Marc. “The Impact of Trade on Intra-Industry Reallocations and Aggregate Industry Productivity.” Econometrica 71(6) (2003): 1695-1725
7. Melitz, Marc and Ottaviano Gianmarco. “Market Size, Trade, and Productivity”. Review of Economic Studies 75(1) (2008): 295-316
8. Samuelson, Paul Anthony. “The transfer problem and transport costs, II: Analysis of effects of trade impediments”, The Economic Journal 64(254) (1954): 264-289