© European Geosciences Union 2006
Geophysicae
The F-region trough: seasonal morphology and relation to
interplanetary magnetic field
M. Voiculescu1, I. Virtanen2, and T. Nygr´en2
1Department of Physics, Faculty of Sciences, University “Dun˘area de Jos” Galati, St. Domneasc˘a, No. 47, 800008 Galati, Romania
2Department of Physical Sciences, University of Oulu, P.O. Box 3000, FIN-90014, Finland
Received: 7 July 2005 – Revised: 16 December 2005 – Accepted: 21 December 2005 – Published: 7 March 2006
Abstract. We present here the results of a statistical study of
the ionospheric trough observed in 2003 by means of satel-lite tomography. We focus on the seasonal morphology of the trough occurrence and investigate the trough latitude, width and the horizontal gradients at the edges, at different mag-netic local times, as well as their relations to geomagmag-netic activity and the interplanetary magnetic field. A seasonal effect is noticed in the diurnal variation of the trough lati-tude, indicating that summer clearly differs from the other seasons. In winter the troughs seem to follow the solar ter-minator. The width of the trough has a diurnal variation and it depends on the season, as well. The broadest troughs are observed in winter and the narrowest ones in summer. A dis-continuity in the diurnal variation of the trough latitude is observed before noon. It is suggested that this is an indica-tion of a difference between the generaindica-tion mechanisms of morningside and eveningside troughs. The density gradients at the edges have a complex dependence on the latitude of the trough and on geomagnetic activity. The photoionization and the auroral precipitation are competing in the formation of the trough walls at different magnetic local times. An im-portant finding is that the interplanetary magnetic field plays a role in the occurrence of the trough at different levels of geomagnetic activity. This is probably associated with the topology of the polar cap convection pattern, which depends on the directions of the IMF componentsByandBz.
Keywords. Ionosphere (Ionospheric disturbances; Auroral
ionosphere)
1 Introduction
The ionospheric trough is a plasma density depletion ob-served at F-region heights at latitudes around 55◦–75◦. It
is elongated in longitudinal direction and its width in the lat-itudinal direction is of the order of 5–10◦. Terms such as Correspondence to: M. Voiculescu
main trough, mid-latitude trough, high-latitude trough, day-side trough and nightday-side trough are used to describe this phenomenon. Both ionosonde and radar data, and satellite beacon transmissions have been applied in studying the mid-latitude trough for more than four decades (Moffet and Que-gan, 1983), while studies of the high-latitude trough started later (Rodger et al., 1992). During the last decade, satel-lite tomography has become a useful tool for monitoring the ionosphere. This technique allows the observation of the F-region within a wide latitudinal range and on a continuous basis, therefore it is very suitable for studies of the trough morphology (Jones et al., 1997; Kersley et al., 1997; Pryse et al., 1998).
The current knowledge of the phenomenology of the trough is relatively incomplete. The investigations have re-vealed several properties of the trough, but the understanding of these characteristics, for example, the formation and oc-currence, is still at least partly unclear. The contradictions may origin from differences in the properties of the mid-latitude and high-mid-latitude troughs or the dayside and night-side troughs, as well as from a restricted time of observa-tion. Some trough studies are based on limited time intervals (Whalen, 1989) or isolated cases (Jones et al., 1997; Pryse et al., 1998), while others make use of larger databases (Mallis and Essex, 1993; Kersley et al., 1997; Werner and Pr¨olss, 1997; Horvath and Essex, 2003).
Previous studies have shown that the latitudinal position of the trough has a diurnal variation with its southernmost lo-cation at night, and the trough also moves towards lower lat-itudes with increasing magnetic activity (Moffet and Que-gan, 1983; Whalen, 1989; Rodger et al., 1992; Kersley et al., 1997). Empirical models have been developed which de-scribe the location of the trough minimum as a function of local time and magnetic activity (Werner and Pr¨olss, 1997; Karpachev et al., 1996).
The seasonal variation of the trough behaviour is not yet very clear. Whalen (1989) and Aladjev et al. (2001) observe that troughs are seen mostly in winter, Moffet and Quegan (1983) conclude that in summer the occurrence is restricted only to midnight, while Mallis and Essex (1993) and Horvath and Essex (2003) see troughs regularly in other seasons, as well. These inconsistencies may be partly caused by the lim-ited number of observations or by the restricted latitudinal range covered by the method of observation. Also, dividing the observations into mid-latitude and high-latitude troughs may hamper the comparison of different studies.
The explanation of these properties is still incomplete. Si-multaneous effects of plasma convection, precipitation, neu-tral winds and heating are usually invoked to explain the de-pletion. Nightside troughs are assumed to form in the vicinity of the equatorward edge of the convection cell, where stag-nation results from a balance between westward convection flow and eastward corotation (Whalen, 1989; Rodger et al., 1992; Pryse et al., 1998; Collis and H¨aggstr¨om, 1988). The dayside troughs form in regions where the dayside high den-sity plasma is displaced by the sunward convective trans-port and replaced by low density plasma carried from the nightside (Whalen, 1989; Rodger et al., 1992; Pryse et al., 1998; Mallis and Essex, 1993). In some particular cases the poleward wall of the trough coincides with the equatorward boundary of precipitation (Jones et al., 1997; Horvath and Essex, 2003). Other possible mechanisms are the upwelling of the neutral atmosphere, which makes the ionosphere more molecular, and the frictional heating due to high ion veloci-ties. Both of them result in increasing the ion loss rate and to erosion in plasma density, which points to the importance of thermospheric winds, electric fields and/or changes in the neutral composition (Crickmore et al., 1997; Vlasov and Kel-ley, 2003). In their excellent review Rodger et al. (1992) analyse all the processes by which plasma depletion could occur and conclude that ion convection is of paramount im-portance to trough generation.
This paper attempts to build a unified view of the morphol-ogy of the trough. We make no distinction between the differ-ent types of troughs and we agree with Whalen (1989), who suggests that the dayside and nightside troughs or the mid-latitude and high-mid-latitude troughs are manifestations of the same phenomenon. Our study aims to improve the present knowledge about the diurnal and seasonal variations of the trough for different geomagnetic levels. The width and the gradients at the edges are also included. In the present study we have chosen the edges as indicators of the trough position, in order to contribute to identifying the mechanism which
contributes to the formation of the trough walls. The convec-tion pattern, which according to many papers (Whalen, 1989; Rodger et al., 1992; Pryse et al., 1998) has a major effect on the trough formation, is governed by the orientation of the IMF. Therefore, the trough occurrence should be related to the IMF. Rodger et al. (1992) suggest that establishing the location of the trough during different IMF conditions would be of great benefit for clarifying the process of the trough for-mation. Although some comments on the IMF effect on the trough are presented by Rodger et al. (1992) and Pryse et al. (1998), there is no systematic study of this possible link and its implications for the formation of the trough. We investi-gate here, for the first time, the relationship between the IMF structure and the occurrence of the trough. Our conclusions are based on a study of the mid-latitude trough, using tomo-graphic images of the high-latitude F-region, covering one year towards sunspot minimum (2003). We show in the fol-lowing that some of our observations confirm previous find-ings, while others give new information on the trough be-haviour and hopefully open new roads for the investigation of the processes which lead to the formation of the trough.
2 Data analysis
Tomographic images obtained from data collected by the Finnish tomography chain were used in the anal-ysis. The chain is run by the Sodankyl¨a Geophysi-cal Observatory. The receivers of the chain are lo-cated at Tromsø (69.66◦N, 18.94◦E), Kilpisj¨arvi (69.02◦N,
20.86◦E), Kiruna (67.84◦N, 20.41◦E), Lule˚a (65.58◦N,
22.17◦E) and Kokkola (63.83◦N, 23.06◦E), and they
ob-serve the phase differences of the 150-MHz and 400-MHz signals transmitted by the Russian Low Earth Orbit (LEO) satellites. Electron density plots in the vertical plane above the receiver chain were produced by means of stochastic in-version (see, e.g. Nygr´en et al., 1997). The latitudinal extent of the resulting tomographic images is about 15◦.
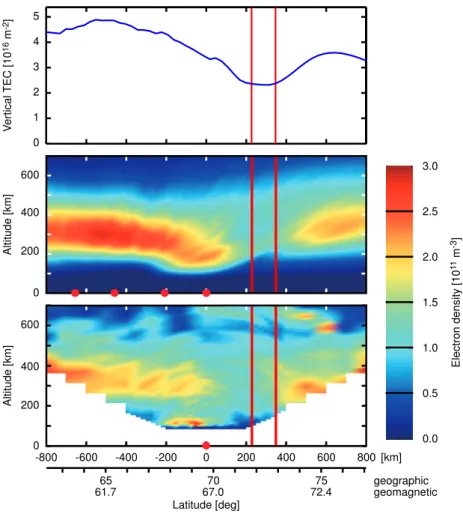
As an example of the reconstructed ionosphere, an elec-tron density plot showing a trough is given in Fig. 1. The top panel presents the tomographic result and, for compari-son, a nearly simultaneous meridionally scanning incoherent scatter observation obtained by means of the EISCAT UHF radar is plotted in the bottom panel. The red dots indicate the positions of the satellite receivers and the radar. The curved structures in the bottom panel are artificially generated by the interpolation which was made in order to produce similar pictures for easier comparison.
600
400
200
0
Altitude [km]
0.0 0.5 1.0 1.5 2.0 2.5 3.0
70 75
65
Latitude [deg] 600
400
200
0
Altitude [km]
0
-400 -200
-600
-800 200 400 600 800 [km]
Electron density [10
1
1 m -3]
geographic geomagnetic 4
2
1
0 5
3
V
ertical
TEC
[
10
16 m -2]
67.0 72.4
61.7
Fig. 1. Example of a trough observation by means of satellite tomography (middle panel) and the EISCAT UHF incoherent scatter radar
(bottom panel). The top panel shows the vertical TEC between 200 km and 400 km; the edges are marked with lines. The observations are from 25 June 2003 at about 01:00 UT. The red dots indicate the positions of the satellite receivers and the EISCAT UHF radar.
too long to allow a proper reconstruction of the E-region and, as a consequence, the E-region ionisation will show at higher altitudes. Still, the comparison reveals a trough nearly in the same position in both observations, even in this case when the trough is located somewhat outside of the receiver chain. A search of troughs was made from all the data obtained in 2003. Cases with satellite passes too far from the receiver chain were first rejected. This led to a decrease of about 20% of the initial number of images. Next, an automatic search was made from the remaining set of observations. The latitu-dinal profile of average electron density between the heights of 200 and 400 km was calculated and troughs were identi-fied from minima in these curves. The edges of the trough were defined as points where the height-integrated density drops to 50% from the outside value. This definition also puts a criterion to the definition of the trough; if the average electron density at a minimum is too great, no edge can be defined and the observation is not counted as a trough. There are cases when only one of the edges, either the poleward or the equatorward one, can be determined, but an observation is counted as a trough only if a minimum is visible within the field of view and the minimum is deep enough to allow
the determination of at least one edge with the 50% criterion. The steepness of the trough edge was determined by calcu-lating the derivative of the average electron density curve at the edge latitude. This result is the average value of the hor-izontal gradients of electron density within the 200–400-km altitude range.
A visual check of all tomographic images was performed, and it confirmed that more than 95% of the cases were cor-rectly identified as troughs. In a few cases the automatic search had interpreted some other features as troughs and these were removed from the data set. In spite of data gaps due to technical problems of the receivers, the resulting data set consists of more than 700 tomographic images with a trough. This number is large enough to allow a statistical study.
60 65 70 0
5 10 15 20
CGM lat (deg)
MLT (hours)
Winter
Kp index
1 2 3 4 5 6
60 65 70
0 5 10 15 20
CGM lat (deg)
MLT (hours)
Fall
Kp index
1 2 3 4 5 6
60 65 70
0 5 10 15 20
CGM lat (deg)
MLT (hours)
Spring
Kp index
1 2 3 4 5 6
60 65 70
0 5 10 15 20
CGM lat (deg)
MLT (hours)
Summer
Kp index
1 2 3 4 5 6
Fig. 2. The corrected geomagnetic latitudes and magnetic local times of the equatorward edges of the troughs observed in 2003. The bin
width is 1◦in latitude and 1 h in local time. The colour code indicates the mean
Kpduring observations included in each bin. Also shown is
the solar terminator at equinoxes and solstices, with triangles pointing towards the dayside.
purpose of studying the properties of the trough at different levels of magnetic activity. The interplanetary magnetic field data were taken from the solar wind observations provided by the WIND (January–June) and ACE (July–December) satel-lites. The delay time from the satellite position to the sub-solar magnetosphere was taken into account and 15-min av-erages of the field components were computed. Finally, the mean values of all parameters were calculated for time bins of one hour and latitude bins of 1◦.
3 Results and discussion
3.1 Diurnal and seasonal variation. Relation to magnetic activity
The observed troughs were divided into four groups, in or-der to investigate the diurnal variation in different seasons. Four months were taken for summer and winter, which leaves two months for each of the equinoxes. Spring was taken to cover March and April, summer to cover May, June, July and August, fall to cover September and October, and
win-ter to cover November, December, January and February. The seasons have different lengths because the solar illumi-nation changes more rapidly around equinoxes than around solstices.
Figures 2 and 3 show, respectively, the magnetic diurnal variations of the corrected geomagnetic latitude of the equa-torward and poleward edges of the trough for every season. The colour code indicates the meanKpduring the times of
60 65 70 0
5 10 15 20
CGM lat (deg)
MLT (hours)
Winter
Kp index
1 2 3 4 5 6
60 65 70
0 5 10 15 20
CGM lat (deg)
MLT (hours)
Fall
Kp index
1 2 3 4 5 6
60 65 70
0 5 10 15 20
CGM lat (deg)
MLT (hours)
Spring
Kp index
1 2 3 4 5 6
60 65 70
0 5 10 15 20
CGM lat (deg)
MLT (hours)
Summer
Kp index
1 2 3 4 5 6
Fig. 3. Same as Fig. 2 for the observations of the poleward edges of the troughs observed in 2003.
solstices is also shown here, with triangles pointing towards the dayside.
The maximum latitude of both edges of the trough occurs around local geomagnetic noon or in the afternoon. In the af-ternoon and evening sector the trough moves towards lower latitudes in the course of local time. This is in agreement with previous findings (Moffet and Quegan, 1983; Whalen, 1989; Karpachev et al., 1996; Werner and Pr¨olss, 1997; Kersley et al., 1997; Pryse et al., 1998). During the post-midnight and morning sectors the trough moves back to higher latitudes. In contrast to the post-noon sector, there is a remarkable dif-ference in the trough behaviour between different seasons in the morning. This will be discussed in more detail below.
Figures 2 and 3 expose the well-known motion of the trough towards lower latitudes and/or the appearance of the trough at earlier local times when the geomagnetic activ-ity level increases (Moffet and Quegan, 1983; Rodger et al., 1992; Pryse et al., 1998). This characteristic is more dis-tinct for the equatorward edge of the trough and it appears in every season. In a few cases a trough is observed at high latitudes during an active geomagnetic period, but this is an exception rather than a rule. Rodger et al. (1992) have also found the same behaviour, indicating that the effect of
mag-netic activity is more clearly seen at the motion of the equa-torward edge. We made no attempt to compare our findings with model results of the trough location because these refer to the trough minimum while in the present paper only the edges are considered.
Since Figs. 2 and 3 show a regular diurnal behaviour of a latitudinal trough motion, it is difficult to make a distinction between high-latitude and mid-latitude troughs or between dayside and nightside troughs. In our observations the trough edges are seen within a latitudinal range of 56◦–72◦
(cor-rected geomagnetic latitude) at all times of day. Therefore, we support the idea by Whalen (1989) that the mid-latitude and high-latitude troughs describe practically the same phe-nomenon observed at different latitudes at different times. Our observations cover a limited area between 60 and 75 ge-ographical latitudes, thus troughs forming at higher latitudes (i.e. polar holes for instance) could not be observed.
observations (Whalen, 1989). These results are, to some ex-tent, in disagreement with our observations, which also re-veal troughs in the daytime and in the morning, in all sea-sons except for winter, when the troughs occur overwhelm-ingly in darkness. At this time of the year, the equatorward edge follows closely the solar terminator. This shows that, at least in winter, the equatorward wall of the trough seems to coincide with the border between the solar illuminated high density F-region and the decayed plasma, which is in dark-ness. In the other seasons the trough occurs during both day and night. In addition to our study, some other investigations also show that the trough is not a predominantly nocturnal phenomenon, but it often appears in the daytime (Pryse et al., 1998; Horvath and Essex, 2003; Werner and Pr¨olss, 1997). A similar result was presented by Mallis and Essex (1993), in-dicating that, in the Southern Hemisphere, the trough appears more often in the early afternoon and in the evening sector in all seasons, but also in the pre-dawn and morning sectors. Model results, on the other hand, predict the appearance of the trough in the evening/night/early morning sector (18:00– 06:00 MLT), extending only for UT=17:00 in the sunlight (Schunk, 1988).
Some evidence of the coincidence of the poleward trough edge with the equatorward edge of energetic particle pre-cipitation has been given by Aladjev et al. (2001); Rodger et al. (1992) or Jones et al. (1997). As a consequence, the movement of the poleward edge of the trough towards lower latitudes with increasing geomagnetic activity may be ex-plained by the expansion of the auroral oval in disturbed con-ditions. The explanation for the corresponding movement of the equatorward edge is less straightforward. Although, on average, the formation of troughs at lower latitudes and ear-lier in the evening is favoured by a higherKp, this is not
al-ways true. This was also pointed out by Rodger et al. (1992) in their review paper, where they argued thatKp is not the
best indicator of the trough position.
TheKpdependence is observed in winter, spring and
au-tumn; summer is the exception. Both edges are observed mostly at high latitudes all day, regardless of theKpvalue.
(The very few troughs observed at low latitudes are observed when the ionosphere is in darkness and they seem to be of a different origin. They will be discussed later.) This must be at least partly due to the solar illumination of the high-latitude F-region in summertime, which, of course, is inde-pendent of magnetic activity. In conclusion, Figs. 2 and 3 show clear differences between the trough behaviour in var-ious seasons. This fact is evident especially in the variation of the equatorward edge. Spring and fall look rather similar. In winter the maximum latitudes of the southern edge are en-countered at later magnetic local times in the evening than in other seasons. According to Mallis and Essex (1993) and Horvath and Essex (2003), the seasonal variations could be explained by the changing nature of the plasma composition and by the different solar influx and angle of incidence. The seasonal variation of the trough location is rather small in comparison with the diurnal one. Nevertheless, the seasonal effect is seen in the diurnal variation of the trough edges and
in their relation to the magnetic activity. Interestingly, the daytime troughs seem to occur rarely if the magnetic activity is low. This is seen in both Figs. 2 and 3, especially during fall and winter. Model results of Schunk (1988) do not pre-dict the dayside trough for given levels of precipitation and Kp. Our observations support the idea that these two factors
have a major impact on the formation of the dayside trough due to their effect on the ion loss rate.
A closer look at Figs. 2 and 3, especially at the spring and fall plots, suggests that the troughs might be split into two categories. In the afternoon and pre-midnight sectors the northern edge is clearly at higher latitudes than in the post-midnight and morning sectors. On the morning side the equa-torward edge may be even outside of the field of view. The postmidnight and morning troughs occur at low latitudes dur-ing periods of low geomagnetic activity, as well. A steep step in the trough position is visible somewhere close to noon.
The existence of the morning trough has been shown in other works, as well (Whalen, 1989; Horvath and Essex, 2003; Kersley et al., 1997; Pryse et al., 1998; Mallis and Essex, 1993). Especially in summer, the northward edge of the post-midnight and morning troughs lies either at high or low latitudes and, in between, there is a range of latitudes where the edge is only rarely observed. The observed step in the trough position is in line with Rodger et al. (1992), who argued that the different flow regimes should lead to a de-marcation between duskside troughs and nightside/morning troughs. Such a discontinuity also appears in one of the mod-els proposed by Werner and Pr¨olss (1997) for the location of the trough minimum function of the magnetic local time. This shows that troughs at different times of day are caused by different combinations of physical processes.
The dependence of trough occurrence on magnetic activity was also investigated in each season. The number of trough observations whenKp>4 was compared with the total
num-ber observed. The resulting fractions are 45% for spring, 39% for summer, 25% for fall and 18% for winter. Hence, from September to February, the majority of the troughs (75%–80%) occur at relatively low levels of geomagnetic ac-tivity while for the rest of the year theKpindex is high for
60
65
70
0
5
10
15
20
CGM lat (deg)
MLT (hours)
Spring
Width (deg)
0
2
4
6
8
10
60
65
70
0
5
10
15
20
CGM lat (deg)
MLT (hours)
Summer
Width (deg)
0
2
4
6
8
10
60
65
70
0
5
10
15
20
CGM lat (deg)
MLT (hours)
Fall
Width (deg)
0
2
4
6
8
10
60
65
70
0
5
10
15
20
CGM lat (deg)
MLT (hours)
Winter
Width (deg)
0
2
4
6
8
10
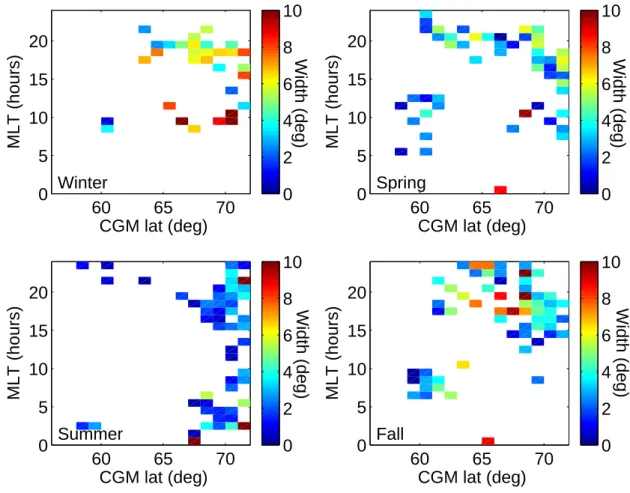
Fig. 4. The mean value of the trough width at different geomagnetic latitudes and magnetic local times of the poleward edge.
3.2 Width
Due to the fact that sometimes only one of the trough edges lies within the field of view of the tomography experiment, the trough width cannot be determined in all cases. There-fore, the statistics available for studying the width is smaller than that used in studying the positions of the edges.
Figure 4 displays the mean width at different latitudes and local times. The average width is shown in terms of the colour code and each rectangle indicates the average mag-netic coordinates of the northern edge of the troughs used in calculating the respective average. The width ranges from 0.5 to 12◦, which is a greater interval than the 5–9◦
men-tioned by Rodger et al. (1992). However, a comparison with other results may, however, be misleading, due to the differ-ent criteria used in calculating the width of the trough.
A clear seasonal variation of the trough width is seen in Fig. 4. The broadest troughs are observed in winter and the narrowest ones in summer, while the equinox seasons repre-sent an intermediate case. In winter the width often reaches 10◦or more, but in summer the trough is only 0.5◦–3◦wide.
The seasonal dependence is most likely explained by the fact that the F-region electron density is enhanced in the equa-torward part of the trough region by the solar illumination in summer and reaches higher latitudes. The seasonal
vari-ation of the trough width and position suggests that a thor-ough analysis of the trthor-ough formation, for particular cases, should consider the effect of both geographical and geomag-netic coordinates. Although the diurnal variation of the width is not very clear, there is some indication of narrow troughs around noon and broader ones in the afternoon and in the morning. This observation is not in good agreement with that by Mallis and Essex (1993), who see maximum widths at 09:00–15:00 LT.
3.3 Wall gradients
No significant seasonal variation was found in the gradients of the edges. Therefore, the diurnal dependence of the wall gradients from all seasons is presented in a single plot. The results from the two walls are shown in Fig. 5. The rectangles indicate the magnetic latitude and local time of the average trough edge, and the mean values of the gradients are shown in terms of the colour code. The gradients are negative at the equatorward edge and positive at the northern edge.
60 65 70 0
5 10 15 20
CGM latitude (deg)
MLT (hours)
Density gradient (10
16
m
−3
)
−0.9 −0.8 −0.7 −0.6 −0.5 −0.4 −0.3 −0.2 −0.1
60 65 70
0 5 10 15 20
CGM latitude (deg)
MLT (hours)
Density gradient (10
16
m
−3
)
0.1 0.2 0.3 0.4 0.5 0.6 0.7 0.8 0.9
Fig. 5. The mean electron density gradient at the equatorward edge (left) and poleward edge (right) at different geomagnetic latitudes and
magnetic local times. The rectangles indicate the location of the edge and the value of the gradient is shown in terms of colour code.
0 5 10 15 20
−1 −0.5 0 0.5 1
MLT (hours)
Density gradient (10
16
m
−3
)
ο Kp ≤ 3 + Kp ≥ 4
60 65 70
−1 −0.5 0 0.5 1
CGM latitude (deg)
Density gradient (10
16
m
−3
)
ο Kp ≤ 3 + Kp ≥ 4
Fig. 6. The diurnal (left) and latitudinal (right) variation of the electron density gradient at the edges of the trough. Positive values refer to
the poleward and negative values to the equatorward edge. The heavy dotted lines indicate the mean value of all observations, and the red and blue ones the mean values from times ofKp>4 andKp<3, respectively.
observed only around midnight. In other words, the poleward wall is steeper when the F-region is not illuminated, while the gradient at the equatorward wall is higher when the pho-toionization maintains the plasma in the F-region. This gives a hint to the relative importance of the geographical (solar dependence) and geomagnetic (convection pattern and pre-cipitation) effects in the formation mechanisms of the trough. A different view of the latitudinal and diurnal behaviour of the gradients is shown in Fig. 6. Here the left-hand panel dis-plays the mean diurnal variation and the right-hand panel the mean latitudinal variation of the trough gradients. The av-erage of all observations is shown by the heavy dashed line, and averages calculated from times withKp≤3 and Kp≥4
by blue and red lines, respectively. Error bars are not shown and only points within the limit of one standard deviation have been considered.
Figure 6 indicates that the poleward edge is steeper than the equatorward one at magnetic midnight. Then the pole-ward gradient decreases nearly continuously until it starts increasing at noon. The gradient at the southward edge
keeps more or less constant between midnight and about 09:00 MLT (assuming that the observations at 04:00 and 06:00 MLT are outliers). After this, its absolute value starts to increase, obtaining a maximum in the evening sector. The result of this behaviour is that, from magnetic midnight up to about 08:00–10:00 MLT, the poleward edge is steeper than the equatorward one. Then the equatorward edge becomes steeper than the poleward one and this continues up to the magnetic midnight. Hence, most of the day, the steepest edge is encountered at the equatorward edge of the trough.
[By–, Bz–] [By+, Bz–] [By–, Bz+] [By+, Bz+] 0
20 40 60 80 100 120 140
Spring Summer
T
otal number of troughs
Fall Winter
Kp < 3
[By–, Bz–] [By+ Bz–] [By–, Bz+] [By+ Bz+]
0 10 20 30 40 50 60 70 80
T
otal number of troughs
Winter Spring
Fall
Summer Kp > 4
Fig. 7. The number of observed troughs during low (left) and high (right) magnetic activity when the IMF points into each of the four
quadrants in theByBzplane. The numbers are also shown for each season.
the poleward edge is clearly steeper, but only during low ge-omagnetic activity. Kersley et al. (1997) report a steepening of the walls with increasingKp in the pre-midnight sector.
No such dependence is visible in Fig. 6. Our results indicate that magnetic activity has no clear effect on the gradients, ex-cept around magnetic midnight, and the diurnal variation of the equatorward gradient does not show any clear correlation with theKpindex.
A clear latitudinal dependence of the gradient at both edges of the trough is seen in the right-hand panel of Fig. 6. On average, the edges are at their steepest around 63◦–65◦
in magnetic latitude. The maximum of the equatorward gra-dient is somewhat higher than that of the poleward gragra-dient. The opposite situation is found both at high and low lati-tudes; there the northward edge is clearly steeper than the southward edge occurring at the same latitudes. A compari-son with Fig. 5 shows that these troughs come from all times of the day, while the high gradients come from the afternoon or midnight sectors. The main effect of magnetic activity is seen at the poleward edge. When the magnetic activity is high, the curve shows a minimum at the very same lati-tudes where the total curve and the curve at low magnetic activity have a maximum. This decrease could be the ef-fect of particle precipitation associated with the expansion of the auroral oval at higherKp, which could also fill in the
troughs. At the equatorward edge, there is some indication of the gradient becoming steeper at low latitudes whenKp
increases. This is in agreement with Rodger et al. (1992) and Horvath and Essex (2003), who noticed that a storm leads to an enhancement of TEC equatorward of the trough. Also, Schunk (1988) shows that an upward plasma drift leads to an increased density equatorward of the trough. No similar variation is seen at the poleward wall at the low-latitude part of the curve.
3.4 Relation to the interplanetary magnetic field
The effect of the interplanetary medium on the occurrence of the trough was investigated using the IMF components Bz and By. Out of these, the Bz component has the most
important effect on the magnetosphere-ionosphere coupling, and therefore it should have the greatest effect on the trough, as well. Using the IMF data, the troughs were divided into four categories, according to the prevailing signs ofBy
andBz, during each observation. Troughs during low and
medium/high geomagnetic activity were studied separately. Figure 7 shows the distribution of the total number of ob-served troughs for the four possible combinations, for the signs ofByandBzduring low (left) and medium/high
mag-netic activity (right). Distributions for each season are also given. During low geomagnetic activity, the number of ob-served troughs is greatest whenBzis positive andByis
neg-ative. In the other three cases the numbers are nearly similar, although a minimum is obtained whenByis positive andBz
negative. This indicates that both IMF components have their effect on the trough formation. When geomagnetic activity is increased,Bzhas a more dominant role. Regardless of the
sign ofBy, the number of troughs is higher whenBzis
neg-ative. For positiveBz, a dependence on the sign ofBy can
be again noticed; more troughs are then observed whenByis
positive. The distributions follow the same pattern during all seasons except summer.
In Fig. 8 the sign of the average Bz during observed
troughs is presented in terms of colour code; positive is shown by red and negative by blue. Each rectangle indi-cates the geomagnetic latitude and local time of the pole-ward/equatorward edge of a trough, and the signs are cal-culated from the values ofBz associated with the troughs
belonging to each rectangle. Separate plots are made for poleward and equatorward edges, as well as for low and medium/highKp values. Figure 9 is a similar presentation
60
65
70
0
5
10
15
20
MLT (hours)
Bz, Kp < 3
60
65
70
0
5
10
15
20
60
65
70
0
5
10
15
20
CGM latitude (deg)
MLT (hours)
60
65
70
0
5
10
15
20
CGM latitude (deg)
Poleward edge
Equatorward edge
Bz, Kp > 4
Fig. 8. The average sign (red means positive and blue negative) ofBzduring observations of trough edges at different magnetic latitudes and
local times. Poleward and equatorward edges are shown in the left and right panels, respectively. Top panels contain troughs observed when
Kp<3 and bottom panels whenKp>4.
Both top panels in Fig. 8 show more red than blue, while blue is dominant in the bottom panels. This indicates thatBz
is mostly positive when troughs are observed during periods of low magnetic activity. When magnetic activity is higher, negativeBzfavours the occurrence of a trough. These
obser-vations could be partly explained by the fact that the level of geomagnetic activity is controlled by the z component of the IMF. However, high geomagnetic activity levels have also been observed together with positive, large or highly vari-able, Bz. For both low and high geomagnetic activity the
equatorward edge position seems to be clearly defined by the orientation ofBz. For smallKp, the majority of the noon and
evening troughs coincide with positiveBz. A negativeBzis
generally associated with troughs whose equatorward edge is at lower latitudes, occurring at night or in the morning. When Kpis high, the troughs are dominated by negativeBz. There
is also some indication that, whenBzis negative, the trough
is located at lower latitudes than in the opposite case. These panels also reveal the demarcation between troughs occur-ring in the post-noon sector and those forming at night or in
the morning. The latter type of troughs form mostly when geomagnetic activity is low. IfKp is higher, these troughs
are clearly associated with negative Bz. The fact that the
role ofBzis better seen in the equatorward edge than in the
poleward one sustains the hypothesis that the equatorward boundary is correlated with the equatorward threshold of the ionospheric effects of convection (Whalen, 1989).
In Fig. 9 blue is dominant in the top panels and red in the bottom panels. Hence, By also controls the occurrence of
the trough. At low levels of magnetic activity, negative val-ues ofBy are favouring the trough, but when the magnetic
activity increases, the occurrence of troughs is favoured by positiveBy. Unexpectedly, for quiet timesByseems to play
a more important role in the position of the troughs thanBz.
The appearance of a trough at noon whenKpis low is more
probable ifBy is positive. This is also valid for higher
geo-magnetic activity levels, when, however, a positiveByseems
to generally favor the occurrence of troughs.
60
65
70
0
5
10
15
20
MLT (hours)
60
65
70
0
5
10
15
20
MLT (hours)
60
65
70
0
5
10
15
20
CGM latitude (deg)
MLT (hours)
60
65
70
0
5
10
15
20
CGM latitude (deg)
Poleward edge
By, Kp < 3
Southward edge
By, Kp > 4
Fig. 9. Same as Fig. 8 forBy.
of the trough is often associated with precipitation and the equatorward edge lies at the equatorward border of the con-vection pattern. The dayside trough forms in the vicinity of the return flow of the dusk convection cell (Pryse et al., 1998) in regions where the sunward convective transport displaces the high density plasma with the low density plasma from the nightside (Whalen, 1989). The nightside trough is created within the stagnation region which appears where the west-ward convection and eastwest-ward corotation more or less cancel each other. Besides the decay of the plasma concentration, low density plasma is transported by the westward convec-tion from later night local times. The size and structure of the convection pattern is controlled by the IMF. WhenBzis
positive, the extent of the convection pattern is limited by the small polar cap. WhenBzis negative, the polar cap and the
convection pattern extends to lower latitudes. The latitudes of particle precipitation are largely but not absolutely con-nected with the convection pattern. IfBz is positive andKp
is low, precipitation region may lie to the north of the narrow stagnation region, making the northern edge of the trough. If the stagnation region remains narrow and the precipitation region moves equatorwards, plasma production by
precipita-tion may compensate the long-time loss within the stagnaprecipita-tion region and no trough will appear. These two cases might ex-plain the fact that, in Fig. 8, troughs during positiveBztend
to disappear whenKpincreases.
WhenBzis negative, the stagnation region is wider and
ex-tends towards lower latitudes. Weak magnetic activity means weak precipitation and a precipitation region located proba-bly at high latitudes. Then it is possible that the density de-pletion is so shallow that it will not meet our criteria of a trough search and it is not counted as a trough. Precipita-tion is intensified at high values ofKpand it may also move
equatorwards. Then a more pronounced poleward edge is formed and the depletion will be counted as a trough. This could contribute to the fact that, during negativeBz, troughs
are observed at high values ofKp.
The role of By in the generation of the trough may be
associated with the basic difference in the convection pat-terns for different signs of Bz. When Bz is negative, the
convection pattern consists of two cells and the main effect of By is to change the relative sizes of the dawn and dusk
By, when the plasma transport velocity is enhanced. When
Bz is positive the sign of By determines the flow direction
in the innermost cells and therefore has a major effect on the plasma flow. WhenKpis low, Fig. 7 indicates that, for
positiveBz, troughs are less probable whenBy is positive.
The convection pattern has three or four small cells. Models of high-latitude convection patterns (Ruohoniemi and Green-wald, 1996) show that in this case the plasma stagnates for a short time, between about 19:00 and 21:00 MLT, at lati-tudes which are too high to be observed by the tomographic chain. In the nightside, corotation can no more be cancelled by the weaker convection flow. This prevents plasma stagna-tion and may hinder the formastagna-tion of the trough. Moreover, we suggest that, in this case, the flux of low-density plasma from the nightside is reduced and therefore the formation of the dayside trough becomes less probable.
The above considerations should only be regarded as a general discussion of the complicated process of trough gen-eration. Extensive model calculations would be needed for a true explanation of all observations.
4 Conclusions
This paper confirms the well-known characteristics of the trough behavior. The troughs appear throughout the day and move towards lower latitudes with increasing local time dur-ing the afternoon and evendur-ing hours. Secondly, the trough also moves to lower latitudes and appears earlier in the af-ternoon, when magnetic activity increases. In our data these results are better seen for the equatorward edge of the trough. Our results also present new findings on the occurrence of the troughs. The fact that their latitude changes in a con-tinuous manner, from noon to evening and midnight, sug-gests that the troughs at these times are the result of the same processes, although the weight of different aspects of these processes may vary with local time. Interesting findings are associated with the morning-side troughs and with the dis-continuity in the diurnal variation the trough latitude, ob-served before noon. When troughs occur at low latitudes in the morning, the geomagnetic activity is often relatively low and high values ofKp are encountered only in a few cases.
This behaviour differs from what is observed in the afternoon and evening sectors. Hence, morning troughs clearly differ from troughs observed in the evening, which gives a hint that there is also a difference in the generation mechanism. This is not surprising since, in the case of the double cell convec-tion pattern, for instance, convecconvec-tion in the morning sector is in the same direction as corotation. Thus, stagnation is not expected in the same manner as before midnight. The oc-currence of the morning troughs at low latitudes during low magnetic activity suggests that the formation of this partic-ular type of trough cannot rely on processes induced by the convection.
Some seasonal effects on the occurrence of the trough have been found. In winter the maximum latitude is encountered at later local times than during other seasons. Most of the
troughs occur in darkness and follow the solar terminator. This is seen especially in the equatorward edge, indicating that the photoionization plays an important role in the forma-tion of the trough. Otherwise, troughs behave in a fairly sim-ilar way during winter and equinoxes. Summer is the most peculiar season; troughs are encountered mostly at high lat-itudes, even for high geomagnetic activity. The width varies with the season and is smaller in summer and greater in win-ter. Also, the trough width seems to attain a minimum around noon. A likely explanation for this observation is solar illu-mination extending to high latitudes in summer.
Another finding in this paper is that the orientation of IMF in the yz plane controls the occurrence of the trough. It is suggested that this is connected to the topology of the polar cap convection pattern during different sign combinations of By andBz. The control is different at low and high levels
of magnetic activity. This probably happens because mag-netic activity is related to the size of the polar cap, thus to the orientation ofBz. Besides the anticipated dependence of
the trough behaviour with the z component, we found that the y component also plays an important role. We suggest that this highlights the convection pattern role in the trough formation. Also, when magnetic activity is high, particle pre-cipitation is more irregular and is encountered at a wider lat-itude region than at low activity levels. The location of the precipitation region with respect to the convection pattern is expected to have an effect on the occurrence of the trough.
The tomographic method gives a means of observing the F-region electron density within a wide latitudinal region. This has allowed us to obtain trough observations which show the whole diurnal variation of trough occurrence. A continuous registration throughout the year has also provided data from all seasons and geomagnetic as well as IMF con-ditions. The availability of satellites is the main limitation of the method. More data are expected to be available in the future, since the tomographic chain is operational. Fi-nally, it should be emphasized that a trough is a complex phenomenon. Although some suggestions for explaining the observations are made in this paper, decisive explanations can only be obtained by means of sophisticated model calcu-lations.
Acknowledgements. The Scandinavian tomography chain is run by
Sodankyl¨a Geophysical Observatory, Finland. We are grateful to T. Raita and J. Manninen for their continuous effort in maintain-ing the receiver chain and to M. Lehtinen, M. Markkanen and late J. Pirttil¨a for their efforts in developing the tomographic inversion routine. Grant (project No 51465) from the Academy of Finland and support from Space Institute at the University of Oulu is also gratefully acknowledged. EISCAT is an International Association supported by Finland (SA), France (CNRS), the Federal Republic of Germany (MPG), Japan (NIPR), Norway (NFR), Sweden (NFR) and the United Kingdom (PPARC).
References
Aladjev, G. A., Evstafiev, O. V., Mingalev, V. S., Mingaleva, G. I., Tereschenko, E. D., and Khudukon, B. Z.: Interpretation of iono-spheric F-region structures in the vicinity of ionization troughs observed by satellite radio tomography, Ann. Geophys., 19, 25– 36, 2001, SRef-ID: 1432-0576/ag/2001-19-25.
Collis, P. N. and H¨aggstr¨om I.: Plasma convection and auroral pro-cesses associated with the main ionospheric trough at high lati-tudes, J. Atmos. Terr. Phys., 50, 339–404, 1988.
Crickmore, R. I., Jenkins, B., and Bailey, G. J.: Variations in the al-titude of the F2 peak associated with trough-formation processes, Ann. Geophys., 14, 628–626, 1997,
SRef-ID: 1432-0576/ag/1996-14-628.
Horvath, I. and Essex, E. A.: The equatorward-hemisphere mid-lattude day-time and night-time trough at low sunspot numbers, J. Atmos. Solar-Terr. Phys., 65, 917–940, 2003.
Jones, D. G., Walker, I. K., and Kersley, L.: Structure of the pole-ward wall of the trough and the inclination of the geomagnetic field above the EISCAT radar, Ann. Geophys., 15, 740–746, 1997, SRef-ID: 1432-0576/ag/1997-15-740.
Karpachev, A. T., Deminov, M. G., and Afonin, V. V.: Model of the mid-latitude ionospheric trough on the base of Cosmos-900 and Intercosms-19 satellites data, Adv. Space Res. 18, 6, (6)221– (6)230, 1996.
Kersley, L., Pryse, S. E., Walker, I. K., Heaton, J. A. T., Mitchell, C. N., Williams, M. J., and Willson, C. A.: Imaging of electron density troughs by tomographic techniques, Radio Sci., 32, 4, 1607–1621, 1997.
Mallis, M. and Essex, E. A.: Diurnal and seasonal variability of the equatorward hemisphere main ionospheric trough from differential-phase measurements, J. Atmos. Terr. Phys., 55, 7, 1021–1037, 1993.
Moffet, R. J. and Quegan, S.: The mid-latitude trough in the elec-tron concentration of the ionospheric F-layer: a review of ob-servations and modelling, J. Atmos. Terr. Phys., 45, 5, 315–343, 1983.
Nygr´en, T., Markkanen, M., Lehtinen, M., Tereshchenko, E. D., and Khudukon, B. Z.: Stochastic inversion in ionospheric radioto-mography, Radio Sci., 32, 2359–2372, 1997.
Pryse, S. E., Kersley, L., Williams, M. J., and Walker, I. K.: The spatial structure of the dayside ionospheric trough, Ann. Geo-phys., 16, 1169–1179, 1998,
SRef-ID: 1432-0576/ag/1998-16-1169.
Rodger, A. S., Moffet, R. J., and Quegan, S.: The role of ion drfit in the formation of ionization troughs in the mid- and high-latitude ionsophere – a review, J. Atmos. Terr. Phys., 54, 1, 1–30, 1992. Ruohoniemi, J. M. and Greenwald, R. A.: Statistical patterms of
high-latitude convection obtained from Goose Bay HF radar ob-servations, J. Geophys. Res., 101, A10, 21 743–21 763, 1996. Schunk, R. W.: A mathematical model of the middle and high
lati-tude ionosphere, Pageoph, 127, 2/3, 255–303, 1988.
Vlasov, M. N. and Kelley, M. C.: Modeling of the electron density depletion in the storm-time trough on April 20, 1985, J. Atmos. Solar-Terr. Phys., 65, 211–217, 2003.
Whalen, J. A.: The daytime F layer trough and its relation to ionospheric-magnetospheric convection, J. Geophys. Res., 94, A12, 17 169–17 184, 1989.