the Indian Human Development Survey
Praveen Kumar Pathak1,2*, Niharika Tripathi2, S. V. Subramanian3
1Department of Geography, Delhi School of Economics, University of Delhi, Delhi, India,2International Institute for Population Sciences, Mumbai, Maharashtra, India, 3Department of Society, Human Development and Health, Harvard School of Public Health, Boston, Massachusetts, United States of America
Abstract
Background:Evidence from a number of countries in Europe and North America point towards the secular declining trend in menarcheal age with considerable spatial variations over the past two centuries. Similar trends were reported in several developing countries from Asia, Africa and Latin America. However, data corroborating any secular trend in the menarcheal age of the Indian population remained sparse and inadequately verified.
Methods: We examined secular trends, regional heterogeneity and association of socioeconomic, anthropometric and contextual factors with menarcheal age among ever-married women (15–49 years) in India. Using the pseudo cohort data approach, we fit multiple linear regression models to estimate secular trends in menarcheal age of 91394 ever-married women using the Indian Human Development Survey.
Results:The mean age at menarche among Indian women was 13.76 years (95 % CI: 13.75, 13.77) in 2005. It declined by three months from 13.83 years (95% CI: 13.81, 13.85) among women born prior to 1955–1964, to nearly 13.62 years (95% CI: 13.58, 13.67) among women born during late 1985–1989. However, these aggregate national figures mask extensive spatial heterogeneity as mean age at menarche varied from 15.0 years in Himachal Pradesh during 1955–1964 (95% CI: 14.89– 15.11) to about 12.1 years in Assam (95% CI: 11.63–12.56) during 1985–1989.
Conclusion:The regression analysis established a reduction of nearly one month per decade, suggesting a secular decline in age at menarche among Indian women. Notably, the menarcheal age was significantly associated with the area of residence, geographic region, linguistic groups, educational attainment, wealth status, caste and religious affiliations among Indian women.
Citation:Pathak PK, Tripathi N, Subramanian SV (2014) Secular Trends in Menarcheal Age in India-Evidence from the Indian Human Development Survey. PLoS ONE 9(11): e111027. doi:10.1371/journal.pone.0111027
Editor:Hamid Reza Baradaran, Iran University of Medical Sciences, Islamic Republic of Iran ReceivedFebruary 6, 2014;AcceptedJuly 20, 2014;PublishedNovember 4, 2014
Copyright:ß2014 Pathak et al. This is an open-access article distributed under the terms of the Creative Commons Attribution License, which permits unrestricted use, distribution, and reproduction in any medium, provided the original author and source are credited.
Funding:The authors have no support or funding to report.
Competing Interests:The authors have declared that no competing interests exist. * Email: pkp_pathak@rediffmail.com
Introduction
The age at menarche-the onset of first menses/periods- that heralds sexual maturation and passage from childhood to adolescence among women demonstrated a secular declining trend over the past two centuries across the globe [1–11]. However, enormous spatial variations in age at menarche were documented both between and within sub-national human populations. For instance, in developing countries, the mean menarcheal age varied from 16.2 years in Nepal, 15.8 in Bangladesh, 14.3 in India (Punjab), 13.5 in Sri Lanka to 12.38 in China, while in the industrialized world, it ranged from 13.3 years in Great Britain, 13.05 in France to 12.8 in the United States [12]. While the observed decline in age at menarche has flattened in many industrialized countries in Europe and North America, it has continued to drop in some countries from the developing world [13–20]. A few studies have already flagged uncertainties about diminishing trends in menarcheal age, particularly about the uncertain magnitude of any such decline owing to restricted sample size for specific subgroups of population [21–22].
Previous epidemiological evidence hinted at psychosocial and public health challenges stemming from the secular decline in age at menarche. Studies have noted that early age at menarche was strongly associated with early marriage and premature parent-hood, obesity, breast cancer, ovarian cancer, psychological disorders (stress, anxiety, and depression), metabolic syndrome (diabetes, coronary heart disease, stroke and respiratory problems), substance abuse and delinquent behaviour, poor academic performance and so on [10,23,24]. Studies have also focused on serious societal challenges that have arisen out of the growing mismatch between early menarche induced biological maturation and subsequent psychosocial maturation [25]. These findings clearly underscore the wider public health concern emanating from the secular declining trend in age at menarche, particularly in developing countries undergoing rapid demographic, socioeco-nomic and nutritional transitions [26–27].
owing to commendable improvements in the field of sanitation and hygiene, nutritional supply, public health interventions and socioeconomic advancement, the menarcheal age exhibited a secular declining trend across human population of late with considerable variability [24,30,34].This variability in the menar-cheal age across subgroups of human population follows gradients along economic status, educational attainment, racial/ethnic differences, rural-urban system of living, supply of nutritional/ health services, and family size/number of siblings etc [2,20,35– 37].
Several available micro scale demographic and epidemiological evidences regarding the menarcheal age of Indian women only permits conjecture about any consistent magnitude of socioeco-nomic and geographic variations in age at menarche over time. The estimates presented in Table 1 summarize the levels and patterns of age at menarche among specific groups of Indian women. The mean age at menarche reportedly varied from 16.50 years to 12.43 years across various subgroups of Indian women over the past four decades [38–50]. Notably, most of the studies that reported age at menarche above 13 years were estimates during 1970–1990, while remaining studies that provided estimates of age at menarche below 13 years were recent studies mostly after 2000.Some of the studies provide estimates of age at menarche across various socioeconomic groups, rural vs. urban, sportswomen, ethnic/caste groups, linguistic groups etc. For instance, a study reported the estimated age at menarche for non-poor and poor girls (13.5060.03SD and 13.946 0.09SDre-spectively) in Tirupati city of Andhra Pradesh in South India [51]. Substantial caste wise differential in age at menarche (Brahmin: 12.5861.03SD; Maratha: 12.6060.86SD; Scheduled Caste: 13.1661.14SD; Other castes: 13.0860.97SD) were also found among girls in a province in Maharashtra, Western India [52]. Some studies have shown marked differences in age at menarche among girls by socioeconomic status (Class I: 13.0561.09SD; Class IV–V: 12.0761.77SD), body mass index (underweight: 12.7261.18SD; normal: 12.6761.37SD; obese: 11.9761.68SD) and place of residence (rural: 12.5161.55SD; urban: 12.3761.46SD) in Lucknow district of North India [39].
However, many earlier studies [53] debated the unresolved issues of any secular declining trend in age at menarche and there was no conclusive evidence to support the above hypothesis for the overall Indian population. In most of the available scientific literature on age at menarche in the Indian context, the unit of analysis has been school girls/adolescents or sports women from a specific localized area (town/city/rural areas). Besides, most of the previous studies were confined to a limited geographic context and they used varying methodology, thereby making it exceedingly difficult to draw any befitting spatiotemporal comparisons of age at menarche in India and/or its any regional dimensions thereof.
In order to fulfil this research gap, the present study uses a nationally representative household survey data, perhaps for the first time, to estimate the magnitude of a secular trend in age at menarche among ever married women (15–49 years) in India during 1955–1989. This study employed a pseudo birth cohorts approach to estimate secular trends in age at menarche. It also highlights the observed spatial heterogeneity (both inter-regional and inter-state) in the age at menarche among ever-married women (15–49 years) during the study period. Finally, it examines the association of selected socioeconomic, demographic, anthro-pometric and contextual risk factors with menarcheal age among Indian women.
Methods
Ethical Statement
The study was based on an anonymous public use data set with no identifiable information on the survey participants; therefore no ethics statement is required for this work.
Study Design and Data
The cross-sectional data for the present study comes from the Indian Human Development Survey (IHDS) conducted during November 2004 and October 2005 under the collaborative project of National Council of Applied Economic Research (NCAER), New Delhi and the University of Maryland. The IHDS is a nationally representative, multi-topic face-to-face survey of 41554 households, covering 215754 individuals from 1503 villages and 971 urban neighborhoods located in 384 districts spread across 33 states and union territories (excluding Andaman and Nicobar Islands and Lakshadweep) in India [54]. It provides robust indicators on various dimensions of human development including health, education, marriage and family, gender relations, fertility, family planning, and health care utilization at both national and sub-national levels. The survey questionnaires were translated into 13 Indian languages and administered through trained local field interviewers. Villages and urban blocks formed the primary sampling unit (PSU) consisting of 150–200 households from which the sampled households were randomly selected. However, urban and rural PSUs were selected using different designs. The survey response rate was 92 percent for the total [43].
The IHDS asked all ever-married women in the age group 15– 49, ‘How old were you when you first started having your periods?’ during the face-to-face interview. Out of a total 105949 eligible sampled respondents, about 14545 women (14 percent) did not report their age at first menstrual period. Around ten women could not accurately report either their current age in completed years or year of birth. Hence, the final analytical sample was reduced to 91394 ever married women aged 15–49 born during 1955–1989.
Outcome Variable
In IHDS, all ever married women aged 15–49 years were asked to report about the age (in completed years) at which they experienced the first menstrual period. Accordingly, we used information of age at menarche (continuous variable) among ever married women as the dependent variable for the present study.
Exposure Variables
This study used a set of theoretically appropriate demographic, socioeconomic, anthropometric and contextual characteristics in the analyses. We used information on year of birth of ever married women 15–49 years to identify the birth cohorts (1955–1964, 1965–1974, 1975–1984,.= 1985) in order to generate the secular trends in age at menarche. However, in multivariate analyses, the information on year of birth of ever married women was used as continuous variable to test the secular trend in age at menarche.
The socioeconomic characteristics of women were accounted through female education (none, primary, secondary, senior secondary, college and above), caste affiliation (Scheduled caste, Scheduled tribe, Other Backward Classes, Other/Forward Castes), religious groups (Hindu, Muslims, Christian, Sikh, others) and wealth quintile.
Data on income or expenditure are usually not collected in large scale surveys like Demographic and Health Surveys (DHS). Thus, customarily a composite index representing the wealth status of the household is generated as proxy of economic status, using
Secular Trends in Menarcheal Age in India
information on ownership of a set of consumer durable asset, access to utilities and infrastructure, and housing characteristics. IHDS collected information on income, and household assets, utilities and housing characteristics. However, income measures suffer from numerous limitations including measurement errors and under-reporting of actual income, particularly from higher income groups [55]. On the other hand, household possession of assets and amenities suggests accumulation over the years and hence emerges as a better indicator of the household’s long-term economic status. Therefore, we used information on a range of 49 sub items representing ownership of consumer durable assets, access to utilities and infrastructure, and housing characteristics to generate a composite index representing the relative standing of the households according to their wealth status by employing principal component analysis [56–60]. Eigen values for each factor are depicted by scree plot (Figure S1). We also tested the reliability of this composite measure using Cronbach’s alpha reliability test, and the results confirmed robustness of the same. A similar approach was employed by a couple of studies in India, which analysed the same data to examine spatial disparities in maternity care, mortality burden and socioeconomic status [61– 62].
The anthropometric status was assessed through the body mass index of women (kg/m2). The body mass index (BMI) was calculated as weight in kilograms divided by height in meters squared (kg/m2) based on values recorded from the actual measurements of both the height and weight of sampled women respectively. The World Health Organization [63] (WHO, 2004)
recommended a tenfold classification of body mass index for the Asian population ranging from severe underweight (,16 kg/m2) to obese class-III (.= 40 kg/m2). Drawing from the above standard classification and a study from India [64], we categorized BMI of women into the following four groups: underweight (,
18.5 kg/m2); normal (18.5–24.9 kg/m2); overweight (25.0– 29.9 kg/m2); obese (.= 30.0 kg/m2; not measured) considering sufficient sample size in each category. The contextual variations were captured through area of residence (rural vs. urban), geographical regions (north, central, east, north-east, west and south) and major linguistic groups (Hindi, Bangla, Gujarati, Marathi, Kannada, Malayalam, Tamil, Telugu, other languages) in India [65].
Statistical Analysis
We used bivariate analysis to present the age at menarche across birth cohorts, regions/provinces and salient socioeconomic, demographic, anthropometric and contextual characteristics among Indian women during the study period. We used One-way analysis of variance (ANOVA) to test the statistical differences in age at menarche across different risk factors. Considering the continuous nature of the dependent variable, we fit a multiple linear regression model to examine secular trend in age at menarche, and further to investigate the plausible association between various risk factors with menarcheal age among Indian women. We also account for the stratification, complex survey design and used appropriate weights in the analysis.
Table 1.Studies on menarcheal age in India.
Year Mean age at menarche (years) Population Location Reference
1972 13.80 All India pooled India [38]
1978 13.5060.03 (non poor),
13.9460.09 (poor) Girls aged 10 to 18 years Tirupati (Andhra Pradesh) [51]
1979 14.6060.08 Girls aged 12 to 18 years Rural Hyderabad (Andhra Pradesh) [39]
1983
13.3060.70 (Plains), 15.7061.50 (Sportswomen), 16.5061.20 (High altitude)
Sportswomen (16 to 27 yrs.), from plains (18 to 26 yrs.) and from high altitude (16 to 32 years)
Patiala and Amritsar (sportswomen) Delhi (plains) and Chopal (high altitude)
[40]
1983 16.3861.53 Women from Bhotia Rajput caste Mana valley, Chamoli district
(Uttar Pradesh) [49]
1983 12.8060.40 (Oraon),12.7660.35 (Munda)
Oraon and Munda girls aged 9 to 16 years
Villages of Kanke Development
Block of Ranchi district (Jharkhand) [41]
1990 13.2061.09 Sample of 709 girls Urban Punjabi population of
Chandigarh (Punjab) [42]
1994 14.70 Rajbanshi women North Bengal (West Bengal) [43]
2000
12.5861.03 (Brahmin),
12.6060.86 (Maratha), 13.1661.14 (Scheduled Caste), 13.086(Others)
School girls aged 9 to 16 years
(Brahmin, Maratha and Scheduled Caste) Pune (Maharashtra) [52] 2001 13.50 Women from lower socio-economic category Urban slum in Delhi (Delhi) [44] 2006 13.85760.01 (Brahmin), 13.85960.01
(Rajput) Brahmin and Rajput girls aged 9 to 15 years Rural areas (Jammu and Kashmir) [45] 2009 12.4560.02 (Assamese), 12.2560.03
(Bengali)
Assamese and Bengali girls attending
school aged 10 to 16 years Guwahati (Assam) [46]
2009 12.6261.05 Girls 9 to 16 years from one convent
and one municipal corporation school Pune (Maharashtra) [47] 2011 12.4361.49 Girls aged 10 to 19 years urban and
rural govt. schools Lucknow (Uttar Pradesh) [50]
2011 13.2260.88 (recall),
Results
Secular trends in menarcheal age
Table 2reveals the mean age at menarche across birth cohorts
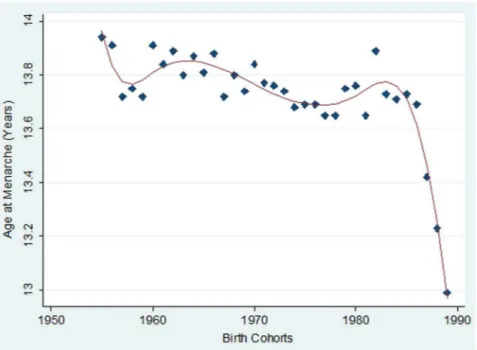
among ever-married women aged 15–49 years in India. The data demonstrates that mean age at menarche was 13.76 (with a 95% CI of 13.75–13.77) among ever married women aged 15–49, whose mean age was 32.61 years. Importantly, the mean age at menarche depicted a long-term decreasing trend towards the younger birth cohorts (Figure 1). In fact, there was a difference of about 0.21 years in menarcheal age between the oldest and the youngest cohorts. The estimates of the mean age at menarche of recent three younger cohorts were compared to the 1955–1964 birth cohorts by performing One-way ANOVA test and were all found to be significantly different (p,0.001).
Regional variations in menarcheal age
Figure 2demonstrates the synoptic view of the stark regional
heterogeneity in cohort specific mean age at menarche among
ever married women in India. The mean age at menarche was highest in the northern region (14.29, with 95% CI of 14.27– 14.31) followed by the central (14.02, with 95% CI of 14.01–14.03) and western region (14.01, with 95% CI of 13.99–14.03), and it was least in the north-eastern region (12.60, with 95% CI of 12.56–12.64). The estimates of the mean age at menarche across geographic regions were compared by performing One-way ANOVA test and were found to be significantly different (p,
0.001).The regional differentials in mean age at menarche remain substantially large over the study period.
Table 3presents detailed account of remarkable inter-regional
and inter-state differentials in the mean age at menarche across birth cohorts of ever married women in India. Interestingly, most of the states from northern central and western part of India exhibit relatively higher mean age at menarche over the study period. For instance, Himachal Pradesh, Uttar Pradesh, Madhya Pradesh, Maharashtra, Rajasthan, Haryana and Punjab show evidence of consistently higher age at menarche than national average. On the contrary, many states from the north-eastern,
Figure 1. Secular trends in mean menarcheal age among ever married women in India, IHDS, 2004–2005. doi:10.1371/journal.pone.0111027.g001
Table 2.Mean menarcheal age by birth cohorts among ever-married women (15-49 years) in India, IHDS, 2004–2005.
Characteristics Mean 95% CI P-values
Percent distribution of
women Sample Size (N)
Lower Bound Upper Bound
Total 13.76 13.75 13.77 100 91394
Birth cohort
1955–1964 13.83 13.81 13.85 23.2 21218
1965–1974 13.76 13.75 13.78 40.0 36571
1975–1984 13.72 13.71 13.73 34.0 31060
1985–1989 13.62 13.58 13.67 0.000 2.8 2545
Note: Analysis of Variance (ANOVA) test has been applied to check the difference in mean age at menarche across birth cohorts; P,0.001 indicates statistically significant at 1%; Unweighted samples have been reported; CI is confidence interval.
doi:10.1371/journal.pone.0111027.t002
Secular Trends in Menarcheal Age in India
eastern and southern parts of India demonstrate considerably lower mean age at menarche. Some noticeable among them includes Arunachal Pradesh, Assam, Andhra Pradesh, Manipur, Karnataka and Tamil Nadu where age at menarche remained consistency below the national average during the study period.
Socioeconomic, anthropometric and contextual variations in menarcheal age.
Table 4 presents a descriptive analysis of mean age at
menarche across selected socioeconomic, anthropometric and contextual characteristics among ever married women in India. The distribution of the educational profile suggests that nearly 50 percent of the respondents received no formal education. However, close to 40 percent of the respondents were educated either up to primary or secondary level and a small proportion received more than secondary education (10 percent). A group of women with no education was tested against those in the other higher educational categories and were found to have a significantly lower mean age at menarche (p,0.001) (Figure 3).
Profiles of interviewed women by household wealth quintile exhibit approximately equal proportions from the poorest to the richest group. However, the mean age at menarche shows an increasing trend from the poorest to richest wealth quintile and the difference between the women of the poorest wealth quintile with other categories was significant (p,0.001) (Figure 3).
Caste identifications reflect systematic deprivation over extend-ed historical time periods owing to caste basextend-ed hierarchical positions prevalent in Indian society. The Indian Constitution provides special privileges to historically most deprived commu-nities like the Scheduled Caste (SC) and Scheduled Tribe (ST) groups and Other Backward Classes (OBC) to ensure their protection and participation in the mainstream [66]. The residual categories of ‘Other/Forward Castes’ group are so called socially forward social groups in the caste based hierarchical system. Data on caste affiliations of interviewed women indicate that majority of them belonged to Other Backward Classes (40 percent) followed by other castes (32 percent), Scheduled Caste (20 percent) and
Scheduled Tribe (4 percent) respectively. Compared to women from the Scheduled Tribes, the mean age at menarche from disparate caste groups was significantly higher (p,0.001). Women from other/forward caste groups experienced a relatively higher mean age at menarche than their counterparts from lower castes groups (Figure 3).
Religious compositions of interviewed women show that the majority consisted of Hindus (79.7 percent) followed by Muslims (13.2 percent), while Christians, Sikhs and other religious communities accounted for about two percent each of the sampled population respectively. The evidence indicates significant differ-ences in menarcheal age among women by their religious affiliations (p,0.001). Women from Christian and Muslim groups experienced a relatively early menarcheal age compared to women from Hindu, Sikh and other religious groups.
Body mass index was measured only for little more than 50 percent of the women interviewed for whom the information on either height or weight was available. Among these, about one fourth had normal BMI, one-fifth had low BMI and the remaining six percent had high BMI. Women with low BMI (BMI,18.5) were tested against those with other relatively moderate/high BMI categories and were found to have significantly different mean age at menarche (p,0.001). Women with relatively higher BMI (.
= 25.0) experienced significantly elevated menarcheal age than their counterparts with low BMI (,= 18.5) (p,0.001).
The profile of interviewed women by area of residence indicates that close to67 percent of the respondents resided in rural areas, while the remaining 33 percent lived in urban centres. However, then mean age at menarche of women living in urban areas was significantly lower than that of their rural counterparts (p,0.001). The geographic composition of women indicates that majority of the respondents resided in the northern region (23 percent), followed by south (22 percent), central (21 percent), east (17 percent), west (14 percent) and north-eastern (four percent) parts of India. The menarcheal age varies significantly across geographic regions (p,0.001). Women who lived in the north-eastern region Figure 2. Birth Cohort specific mean age at menarche among ever married women across major geographic regions in India, IHDS, 2004–2005.
Table 3.Mean age at menarche by birth cohorts among ever married women (15–49 years) across geographic regions/states in India, IHDS, 2004–2005.
Birth Cohorts 1955–64 1965–74 1975–84 1985–89
Region/State AAM 95% CI AAM 95% CI AAM 95% CI AAM 95% CI
India 13.83 13.81 13.85 13.76 13.75 13.78 13.72 13.71 13.73 13.62 13.58 13.67
Northern India 14.32 14.28 14.36 14.24 14.21 14.27 14.28 14.25 14.31 13.86 13.76 13.96
Jammu & Kashmir 14.43 14.29 14.56 14.41 14.26 14.56 14.20 14.06 14.34 13.00 13.00 13.00
Himachal Pradesh 15.00 14.89 15.11 15.24 15.16 15.33 15.12 15.04 15.20 15.29 14.91 15.66
Punjab 14.29 14.23 14.36 14.15 14.11 14.20 14.23 14.17 14.29 13.68 13.33 14.04
Uttaranchal 14.97 14.79 15.15 14.55 14.45 14.65 14.65 14.52 14.78 14.00 14.00 14.00
Haryana 14.58 14.50 14.67 14.55 14.48 14.62 14.55 14.48 14.61 14.31 14.15 14.47
Delhi 13.49 13.35 13.62 13.75 13.64 13.87 13.58 13.46 13.70 14.23 13.66 14.81
Rajasthan 14.07 13.99 14.14 14.02 13.96 14.08 14.11 14.05 14.16 13.66 13.52 13.80
Western India 13.99 13.94 14.03 14.02 13.99 14.06 14.09 14.06 14.12 14.08 13.96 14.19
Gujarat 13.75 13.69 13.81 13.88 13.84 13.93 13.87 13.82 13.92 13.34 13.22 13.46
Maharashtra 14.13 14.07 14.19 14.10 14.06 14.15 14.21 14.16 14.25 14.45 14.31 14.58
Goa 13.49 13.21 13.77 13.57 13.24 13.90 13.34 13.13 13.56 na na na
Central India 14.05 14.02 14.08 14.03 14.01 14.05 13.98 13.95 14.00 13.97 13.88 14.06
Chhattisgarh 13.79 13.72 13.86 13.89 13.84 13.95 14.04 13.97 14.11 13.54 13.32 13.76
Madhya Pradesh 13.98 13.93 14.03 13.88 13.85 13.92 13.97 13.93 14.01 13.68 13.52 13.83
Uttar Pradesh 14.14 14.10 14.19 14.11 14.08 14.14 13.97 13.94 14.00 14.14 14.02 14.27
Eastern India 13.69 13.64 13.73 13.64 13.61 13.67 13.45 13.42 13.48 13.36 13.27 13.44
Bihar 13.77 13.70 13.84 13.92 13.86 13.98 13.72 13.67 13.77 13.82 13.65 13.99
Jharkhand 14.26 14.14 14.38 14.15 14.07 14.24 13.46 13.40 13.52 13.45 13.23 13.66
Orissa 13.35 13.30 13.40 13.34 13.30 13.39 13.24 13.20 13.28 13.02 12.92 13.11
West Bengal 13.49 13.41 13.57 13.26 13.20 13.31 13.28 13.21 13.35 13.09 12.92 13.25
Southern India 13.50 13.46 13.53 13.32 13.30 13.35 13.26 13.23 13.29 13.00 12.89 13.10
Andhra Pradesh 13.36 13.28 13.43 13.11 13.06 13.15 13.18 13.13 13.24 12.91 12.71 13.12
Karnataka 13.06 13.00 13.11 13.05 13.00 13.09 13.06 13.01 13.11 13.03 12.88 13.18
Kerala 13.45 13.37 13.54 13.21 13.15 13.27 13.21 13.13 13.28 13.31 13.15 13.46
Tamil Nadu 14.01 13.93 14.09 13.89 13.83 13.94 13.60 13.52 13.68 13.01 12.70 13.31
Northeast India 12.52 12.43 12.60 12.41 12.34 12.47 12.45 12.37 12.53 12.80 12.47 13.13
Arunachal Pradesh 12.12 12.02 12.23 12.29 12.20 12.38 12.32 12.14 12.49 12.00 12.00 12.00
Manipur 14.08 13.79 14.37 14.01 13.76 14.24 14.77 14.48 15.06 13.00 13.00 13.00
Mizoram 14.44 14.29 14.59 14.14 14.05 14.22 14.38 14.10 14.66 14.00 14.00 14.00
Tripura 13.44 13.27 13.61 13.46 13.34 13.58 13.26 13.05 13.47 13.92 13.54 14.29
Meghalaya 13.67 13.43 13.90 13.68 13.43 13.93 13.38 13.11 13.65 13.37 11.90 14.84
Assam 11.97 11.88 12.06 11.86 11.78 11.93 11.99 11.92 12.06 12.10 11.63 12.56
Secular
Trends
in
Menarcheal
Age
in
India
PLOS
ONE
|
www.ploson
e.org
6
November
2014
|
Volume
9
|
Issue
11
|
experienced menarche at a relatively early age when compared to their counterparts in other geographic regions. We also investi-gated the variations in menarcheal age across major linguistic groups in India. Data suggest that majority of sample women speak Hindi, followed by Kannada, Marathi, Bengali, Gujarati, Telugu, Oriya, Tamil, Malayalam and other linguistic groups. Hindi speaking women were tested against those speaking other Indian languages and were found to have a significantly different mean age at menarche (p,0.001).
We also examined the socioeconomic pattern in the mean age at menarche across the states of India (Table S1–S4). The results suggest a significant socioeconomic gradient in menarcheal age, as women with no/low education, Scheduled Caste/Scheduled Tribe and economically poor household experienced relatively early menarche than their better off counterparts across states in India. Further, the socioeconomic gradients in mean age at menarche were pronounced among women from the southern, eastern and north-eastern states.
Predictors of Menarcheal Age
The results from descriptive analysis established secular declining trends in menarcheal age among ever married women in the age group 15–49 in India. These results also bring out sizeable variations in menarcheal age across socioeconomic, anthropometric and contextual attributes of women. However, in order to test whether these secular trends in menarcheal age are true, we fit a multiple linear regression model adjusting for potential socioeconomic, anthropometric and contextual risk factors. The age at menarche was the outcome variable and the year of the respondent’s birth (continuous), education, wealth quintile, caste, religion, area of residence, geographic region and linguistic groups were exposure variables.
The fitted regression model had an adjustedR-square value of 0.138, which explained 14 percent of the total variation found in the age at menarche (see Table 5). The estimated regression parameter indicated that one unit increase in the year of birth was associated with an average of 0.009 year decrease in age at menarche among Indian women after adjusting for other socioeconomic, anthropometric and contextual characteristics. This confirmed the secular declining trends in menarcheal age among women in India.
The results also suggest a positive association between mean menarcheal age and women’s education as women with greater than 12 years of education had 0.339 years higher mean age at menarche than women with no education, all else being equal. Similarly, the economic status of women was also positively associated with mean menarcheal age as women from the wealthiest quintile had 0.061 years higher mean age at menarche than the poorest wealth quintile, keeping other variables constant. The study also found statistically significant differences in mean menarcheal age across castes. Women from Other/Forward Castes had 0.071 years higher mean age at menarche than their counterparts from Scheduled Caste groups. Religion also predict-ed statistically significant differences in mean menarcheal age; for instance the mean menarcheal age for Muslim women were 0.026 years earlier than that of their Hindu counterparts. However, the data not support any significant association between mean menarcheal age and body mass index of women.
Interestingly, women from urban areas experienced mean age at menarche 0.170 years earlier than their counterparts from rural areas, all else being equal. These results also suggest statistically significant differences in menarcheal age among women across various geographic regions of India. Women residing in the north-eastern region had mean age at menarche 1.705 years earlier than
Table 4.Mean age at menarche across selected socioeconomic, anthropometric and contextual characteristics among ever-married women (15–49 years) in India, IHDS, 2004–2005.
Characteristics Mean 95% CI P-values Percent distribution of women Sample Size (N)
Lower Bound Upper Bound
Years of education
None 13.75 13.74 13.76 45.3 41383
1–5y 13.65 13.63 13.67 16.3 14887
6–10y 13.78 13.77 13.80 28.3 25841
11–12y 13.90 13.87 13.94 5.1 4651
.12y 13.98 13.94 14.02 0.000 5.1 4632
Wealth quintile
Poorest 13.70 13.68 13.72 20.0 18282
Poorer 13.63 13.62 13.65 20.0 18280
Middle 13.76 13.74 13.78 20.0 18280
Richer 13.79 13.77 13.81 20.0 18274
Richest 13.93 13.91 13.95 0.000 20.0 18278
Caste group
Scheduled tribe 13.64 13.61 13.67 7.8 7156
Scheduled caste 13.68 13.66 13.70 20.4 18622
Other backward class 13.79 13.78 13.80 40.1 36612
Other castes 13.81 13.79 13.82 0.000 31.7 29004
Religion
Hindu 13.77 13.77 13.78 79.7 72814
Muslim 13.65 13.63 13.68 13.2 12078
Christian 13.45 13.40 13.50 2.6 2338
Sikh 14.17 14.13 14.21 2.6 2331
Others 13.88 13.82 13.94 0.000 2.0 1833
Body Mass Index (Kg/M2)
Missing values 13.78 13.77 13.79 46 42270
,18.5 13.75 13.74 13.77 22 20482
18.5–24.9 13.74 13.72 13.76 25 22380
25.0–29.9 13.77 13.74 13.82 5.0 4608
.= 30.0 13.78 13.71 13.85 0.002 1.8 1654
Area of residence
Rural 13.77 13.76 13.77 67 61023
Urban 13.75 13.73 13.76 0.000 33 30371
Geographic regions
North 14.26 14.24 14.28 23 21276
West 14.04 14.02 14.06 14 12514
Central 14.02 14.00 14.03 21 18764
East 13.57 13.55 13.59 17 15321
South 13.34 13.32 13.35 22 19957
North-East 12.46 12.41 12.50 0.000 3.9 3562
Linguistic groups
Hindi 14.02 14.01 14 47.0 42990
Bengali 13.26 13.23 13.2 5.3 4846
Gujarati 13.82 13.79 13.8 5.1 4667
Marathi 14.81 14.78 14.8 7.4 6722
Kannad 13.05 13.03 13.1 9.0 8226
Malayalam 13.27 13.23 13.3 3.6 3330
Tamil 13.82 13.78 13.9 4.0 3616
Telugu 13.19 13.16 13.2 5.0 4572
Secular Trends in Menarcheal Age in India
their counterparts from the northern region. The mean menar-cheal age also varied significantly across major linguistic groups in India. Women speaking Gujarati had mean age at menarche 0.500 years earlier than their Hindi speaking counterparts.
Discussion and Conclusion
This study uses a nationally representative data that provides secular trends in menarcheal age among ever married women (15–
49 years) in India during 1955–1989. It employs a pseudo-cohort approach to estimate the magnitude of secular decline in menarcheal age using a cross-sectional data. It throws light upon glaring spatial heterogeneity (both inter-regional and inter-state) in menarcheal age among Indian women over time. It also examines the association of salient socioeconomic, anthropometric and contextual risk factors associated with menarcheal age among women in India.
Table 4.Cont.
Characteristics Mean 95% CI P-values Percent distribution of women Sample Size (N)
Lower Bound Upper Bound
Oriya 13.29 13.27 13.3 4.9 4496
Other language 13.44 13.4 13.5 0.000 8.7 7929
Note: Analysis of Variance (ANOVA) test has been applied to check the difference in mean age at menarche across categories of covariates; P,0.001 indicates statistically significant at 1%; Unweighted samples have been reported; Percent total may not add upto 100 due to rounding off.
doi:10.1371/journal.pone.0111027.t004
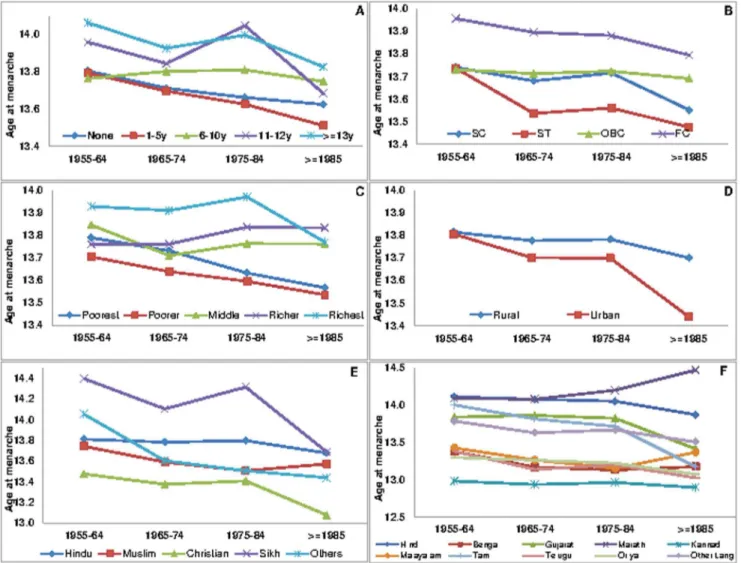
Figure 3. Socioeconomic and cultural patterning of mean age at menarche across birth cohorts of women in India, IHDS 2004– 2005.A. Age at menarche by education across birth cohorts. B. Age at menarche by caste across birth cohorts. C. Age at menarche by wealth status across birth cohorts of women. D. Age at menarche by residence across birth cohorts of women. E. Age at menarche by religion across birth cohorts of women. F. Age at menarche by language across birth cohorts of women.
Table 5.Multiple linear regression predicting menarcheal age among ever-married women (15–49 y) in India, IHDS, 2004–2005.
Estimated regression coefficients parameter Coefficient 95%CI P-value
Intercept 29.900 27.935 31.865 0.000
Year of Birth 20.008 20.009 20.007 0.000
Years of education None#
0.000 0.000 0.000
-1–5y 20.025 20.048 20.003 0.025
6–10y 0.156 0.134 0.178 0.000
11–12y 0.256 0.215 0.298 0.000
.12y 0.339 0.294 0.384 0.000
Wealth Quintile Poorest#
0.000 0.000 0.000
-Poorer 0.034 0.012 0.057 0.003
Middle 0.061 0.035 0.086 0.000
Richer 0.070 0.041 0.100 0.000
Richest 0.061 0.026 0.096 0.001
Caste group
Scheduled caste# 0.000 0.000 0.000
-Scheduled tribe 0.034 0.011 0.057 0.044
Other backward class 0.096 0.075 0.117 0.000
Other castes 0.071 0.047 0.094 0.000
Religion Hindu#
0.000 0.000 0.000
-Muslim 20.026 20.051 20.003 0.030
Christian 0.064 0.009 0.120 0.024
Sikh 20.002 20.074 0.071 0.959
Others 0.130 0.075 0.185 0.000
Body mass index (Kg/M2) ,18.5#
0.000 0.000 0.000
-18.5–24.9 0.014 20.007 0.036 0.183
25.0–29.9 20.038 20.077 0.001 0.055
.= 30.0 0.043 20.019 0.106 0.178
Missing(weight/height not measured) 0.005 20.013 0.024 0.568
Area of Residence Rural#
0.000 0.000 0.000
-Urban 20.170 20.191 20.149 0.000
Geographic regions North#
0.000 0.000 0.000
-Central 20.265 20.293 20.237 0.000
East 20.508 20.540 20.476 0.000
North-East 21.705 21.762 21.648 0.000
West 0.003 20.059 0.066 0.917
South 21.198 21.328 21.067 0.000
Linguistic Groups
Hindi# 0.000 0.000 0.000
-Bangla 20.428 20.464 20.392 0.000
Gujarati 20.500 20.568 20.432 0.000
Marathi 20.216 20.281 20.151 0.000
Kannad 20.061 20.195 20.072 0.366
Malayalam 0.002 20.135 0.139 0.975
Tamil 0.700 0.566 0.833 0.000
Telugu 0.094 20.037 0.226 0.161
Secular Trends in Menarcheal Age in India
The results clearly establish a reduction of nearly one month per decade, suggesting a secular decline in age at menarche among Indian women during 1955–1989. These relatively modest changes occur due to improvement in the field of scientific and technological advancement, economic growth, agriculture, food supply, public health systems and hygiene, which markedly help to improve the general health, nutritional level and over all standard of living of the population of past several decades. However, these findings assume critical significance as India ranks among one of the youngest nations with the largest adolescents population (243 million) followed by China (207 million), the United States of America (44 million), Indonesia and Pakistan (41 million each) [67]. Furthermore, nearly30 percent of India’s population (327 million) ranges between 10–24 years of age and approximately 70 percent of India’s population age is below 35 years [68].Therefore, any mismatch between physical puberty (owing to early menar-cheal age) and social puberty (age at which people are mentally, educationally and legally equipped to function as adults in modern societies) may trigger ignorant health damaging behaviour among adolescent/youth including early and unprotected sexual debut, sexually transmitted disease (STD)/reproductive tract infections (RTI) including HIV/AIDS and teenage pregnancies [69]. These inadvertent occurrences may be averted though proper planning and policies that encourage family life education and empower adolescents/youth through culturally sensitive and age appropriate skills/knowledge creation [70].
The results from this study also highlight stark spatial heterogeneity in mean menarche age among women across geographic regions and states/provinces in India over time. Women from the northern, central and western parts of India experienced a relatively higher mean age at menarche as compared to their counterparts from the north-east, south and east. A number of states from the northern, central and eastern parts of the country rank low in human development index and exhibit relatively poor nutritional and health circumstances as compared to other states from the southern and eastern parts of India with the exception of the north-eastern states. These geographic differences in the nutritional and health status of the population may partially bring about differentials in the age at menarche of women [71]. Across Indian states, women from Assam, Arunachal Pradesh, Sikkim, Karnataka and Andhra Pradesh recorded the lowest mean age at menarche. On the contrary, women from Himachal Pradesh, Uttaranchal, Haryana, Jammu and Kashmir and Jharkhand experienced the highest mean menarcheal age. In addition, this study also documented substantial variations in mean menarcheal age across major linguistic groups in India. Notably, most of the non-Hindi speaking women experienced early mean age at menarche when compared to their Hindi speaking counterparts. These spatio-cultural variations exhibit tremendous long standing genetic/ethnic diversity, dietary patterns and gender roles that might account
for differences in mean menarcheal age across various geographic regions of India.
This study clearly brings out substantial socioeconomic patterning of mean age at menarche among Indian women. Interestingly, mean age at menarche was significantly higher among women with higher education, economically better of households and socially forward castes groups than their counterparts. Previous studies have arrived at mixed conclusions with regard to the association between socioeconomic status and mean age at menarche [72]. However, our result does not corroborate the findings of some of the earlier micro-level studies in India. It is possible that many women with a high socioeco-nomic status might be particular about the shape of their body/ physical appearance and hence exercise/work out intensively, which may push their mean menarcheal age to upper thresholds [73]. We also found that women residing in urban areas experience a relatively early mean age at menarche compared to their rural counterparts. Our results are consistent with similar findings from China, where rural women have a relatively higher mean age at menarche than their urban counterparts [30]. Data also indicate significant variations in mean age at menarche across religious groups. Muslim women experienced significantly early mean age at menarche than their Hindu counterparts. However, our result does not support any significant association between body mass index and mean age at menarche of women in India. To sum up, we report three take home messages that emerged from the present analyses. First, we observed secular declining trends in mean age at menarche among Indian women during 1955–1989. The findings have indicated a decline of one month per decade in the mean age at menarche in India. Second, there was glaring spatial heterogeneity in mean menarcheal age across birth cohorts of women in India. Lastly, the study highlighted sharp socioeconomic and contextual pattering in mean menar-cheal age among women. Women who were better educated, economically well-off and from forward/general caste groups experienced a higher mean age at menarche. Women residing in urban areas, from north-eastern/southern/eastern regions, speak-ing non-Hindi languages experienced a relatively early mean age at menarche.
Limitations of the study
Though the present study adds to the literature on menarcheal age in the Indian context. There are some limitations that need to be considered while interpreting the results. The measurement of the menarcheal age is based on the retrospective or recall method. There are some studies which criticize the recall method for over-reporting the menarcheal age, while certain studies have accused it for under-reporting the menarcheal age [74–76]. Some have compared recall data with other sources of information and noted that the recall method provides fairly consistent estimates [37].
Table 5.Cont.
Estimated regression coefficients parameter Coefficient 95%CI P-value
Oriya 20.492 20.535 20.448 0.000
Other language 20.176 20.223 20.130 0.000
Adjusted R-Square 0.138
Number of observation 91394
doi:10.1371/journal.pone.0111027.t005 Note-#
Second, this study uses IHDS-2004/2005 data set which provides retrospective information. Hence any estimates generated from the present data will provide older reference dates compared to the recent status-quo studies. However, to tackle this issue by clubbing the study subjects into birth cohorts. Therefore, this comparative pseudo-cohort approach emerged as the potential strength of present study. Finally, given the cross sectional nature of the data, we could not identify any causal relationship between the outcome and exposure variables. Rather, we only identify the association between the salient socioeconomic, anthropometric and contextual characteristics with the menarcheal age of women. Therefore, we suggest that future studies take up large scale status-quo and longitudinal surveys to evaluate the present scenario and identify the causal risk factors of menarcheal age among women in India.
Supporting Information
Figure S1 Scree plot representing eigen values from Principal Component Analysis (PCA), India, IHDS, 2004–2005.
(TIF)
Table S1 Mean age at menarche by educational status of women (15–49y) across states in India, IHDS, 2004– 2005.
(DOCX)
Table S2 Mean age at menarche by caste groups of women (15–49y) across states in India, IHDS, 2004– 2005.
(DOCX)
Table S3 Mean age at menarche by wealth status of women (15–49y) across states in India, IHDS, 2004– 2005.
(DOCX)
Table S4 Mean age at menarche by residence of women (15–49y) across states in India, IHDS, 2004–2005.
(DOCX)
Author Contributions
Conceived and designed the experiments: PKP NT SVS. Performed the experiments: PKP NT. Analyzed the data: PKP NT. Contributed reagents/materials/analysis tools: PKP NT SVS. Wrote the paper: PKP NT SVS.
References
1. Tanner JM (1955) Growth at Adolescence. Oxford: Blackwell Scientific (1st edition).
2. Zacharias L, Wurtman RJ (1969) Age at menarche: genetic and environmental influences. The New England Journal of Medicine 280: 868–875.
3. Laslett P (1971) Age at menarche in Europe since the Eighteenth Century. Journal of Interdisciplinary History 2: 221–236.
4. Tanner JM (1973) Trends towards earlier menarche in London, Oslo, Copenhagen, the Netherlands and Hungary. Nature 243: 95–96.
5. Dann TC, Roberts DF (1973) End of the trend? A 12-year study of age at menarche. British Medical Journal 3: 265–267.
6. Wyshack G, Frisch RE (1982) Evidence for a secular trend in age at menarche. The New England Journal of Medicine 306: 1033–1035.
7. Winchup PH, Gilg JA, Odoki K, Taylor SJC, Cook DG (2001) Age at menarche in contemporary British teenagers: survey of girls born between 1982 and1986. British Medical Journal 322: 1095–1096.
8. Viner R (2002) Splitting hairs. Archives of Disease in Childhood 86: 8–10. 9. McDowell MA, Brody RD, Hughes JP (2007) Has age at menarche changed?
Results from the National Health and Nutrition Examination Survey (NHANES) 1992–2004. Journal of Adolescent Health 40: 227–231. 10. Walvoord EC (2010). The timing of puberty: is it changing? Does it matter?
Journal of Adolescent Health 47: 433–439.
11. Talma H, Schonbeck Y, Dommelen PV, Bakker B, Buuren SV, et al. (2013). Trends in menarcheal age between 1955 and 2009 in the Netherlands. PLoS ONE 8:e60056. doi:10.1371/journal.pone.0060056.
12. Thomas F, Renaud F, Benefice E, Meeus TD, Guegan J (2001) International variability of ages at menarche and menopause: patterns and main determinants. Human Biology 73: 271–290.
13. Cameron N, Kgamphe JS, Levin Z (1991) Age at menarche and secular trends in menarcheal age of South African urban and rural black females. American Journal of Human Biology 3: 251–255.
14. Huen KF, Leung SSF, Lau JTF, Cheung AYK, Leung NK, et al. (1997) Secular trend in the sexual maturation of Southern Chinese girls. Acta Paediatrica 86: 1121–1124.
15. Pasquet P, Biyoung AM, Rikong-Adie H, Befidi-Mengue R, Garba MT, et al. (1999) Age at menarche and urbanization in Cameroon: current status and secular trends. Annals of Human Biology 26: 89–97.
16. Do Lago MJ, Faerstein E, De Souza Lopes C, Werneck GL (2003) Family socio-economic background modified secular trends in age at menarche: evidence from the Pro-Saude study, Rio de Janeiro, Brazil. Annals of Human Biology 30: 347–352.
17. Adanu RMK, Hill AG, Seffah JD, Darko R, Anarfi JK, et al. (2006) Secular trends in menarcheal age among Ghanian women in Accra. Journal of Obstetrics and Gynaecology 26: 550–554.
18. Jones LL, Griffiths PL, Norris SA, Pettifor JM, Cameron M (2009) Age at menarche and the evidence for a positive secular trend in urban South Africa. Annals of Human Biology 21: 130–132.
19. Cho JG, Park HT, Shin JH, Hur JY, Kim YT, et al. (2010) Age at menarche in a Korean population: secular trends and influencing factors. European Journal of Pediatrics 169: 89–94.
20. Adali T, Koc I (2011) Menarcheal age in Turkey: secular trend and socio-demographic correlates. Annals of Human Biology 38: 345–353.
21. Mutton L, Duvigneaud N, Wijndaele K, Philippaerts R, Duquet W, et al. (2007) Secular trends in anthropometric characteristics, physical fitness, physical activity, and biological maturation in Flemish adolescents between 1969 and 2005. American Journal of Human Biology 19: 345–357.
22. Harris MA, Prior JC, Koehoorn M (2008) Age at menarche in the Canadian population: secular trends and relationship to adulthood BMI. Journal of Adolescent Health 43: 548–554.
23. Pierce MB, Leone DA (2005) Age at menarche and adult BMI in the Aberdeen children of the 1950s cohort study. American Journal of Clinical Nutrition 82: 733–739.
24. Rah JH, Shamim AA, Arju UT, Labrique AB, Rashid M, et al. (2009). Age of onset, nutritional determinants, and seasonal variations in menarche in rural Bangladesh. Journal of Health, Population and Nutrition 27: 802–807. 25. Gluckman PD, Hanson MA (2006) Evolution, development and timing of
puberty. Trends in Endocrinology and Metabolism 17: 7–12.
26. Golub MS, Collman GW, Foster PMD, Kimmel CA, Meyts ER, et al. (2008) Public health implications of altered puberty timings. Pediatrics 121: S218– S230.
27. Jones LL, Griffiths PL, Norris SA, Pettifor JM, Cameron M (2009) Age at menarche and the evidence for a positive secular trend in urban South Africa. Annals of Human Biology 21: 130–132.
28. Liestol K (1982) Social conditions and menarcheal age: the importance of early years of life. Annals of Human Biology 9: 521–537.
29. Sanchez-Andres A (1997) Genetic and environmental factors affecting menarcheal age in Spanish women. Anthropologischer Anzeiger 55:69–78. 30. Wang D, Murphy M (2002) Trends and differentials in menarcheal age in
China. Journal of Biosocial Science 34: 349–361.
31. Silva HP, Padez C (2006) Secular trends in age at menarche among Caboclo populations from Para, Amazonia, Brazil: 1930–1980. American Journal of Human Biology 18: 83–92.
32. Euling SY, Herman-Giddens ME, Lee PA, Selevan SG, Juual A, et al. (2008) Examination of US puberty-timing data from 1940 to 1994 for secular trends: panel findings. Pediatrics 121:S172–191.
33. Rigon F, Bianchin L, Bernasconi L, Bona G, Bozzola M, et al. (2010) Update on age at menarche in Italy: toward the levelling off of the secular trend. Journal of Adolescent Health 46: 238–244.
34. de Muinck Keizer SM, Mul D (2001) Trends in pubertal development in Europe. Human Reproduction Update 7: 287–291.
35. Chavarro J, Villamor E, Narvaez J, Hoyos A (2004) Socio-demographic predictors of age at menarche in a group of Colombian university women. Annals of Human Biology 31: 245–257.
36. Wronka I, Pawlinska-Chmara R (2005) Menarcheal age and socioeconomic factors in Poland. Annals of Human Biology 32: 630–638.
37. Facchini F, Fiori F, Bedogni G, Galletti L, Ismagulov O, et al. (2008) Puberty in modernizing Kazakhstan: a comparison of rural and urban children. Annals of Human Biology 35:50–64.
38. Indian Council of Medical Research (1972) Growth and development of Indian infants and children. Technical Report Series No. 18, New Delhi.
39. Satyanarayana K, Naidu AN (1979) Nutrition and menarche in rural Hyderabad. Annals of Human Biology 6: 163–165.
Secular Trends in Menarcheal Age in India
40. Bhalla SR, Kapoor AK, Singh IP (1983) Variations in the age at menarche due to physical exercise and altitude. Zeitschrift fu¨r Morphologie und Anthropologie 73: 323–332.
41. Tyagi D, Pal G, Tewari PK (1983). Menarcheal age among Oraon and Munda girls of Ranchi. Journal of the Indian Medical Association 80: 133–134. 42. Sharma K (1990) Age at menarche in northwest Indian females and a review of
Indian data. Annals of Human Biology 17: 159–162.
43. Chakravarty K (1994) Age at menarche among the Rajbanshi women of north Bengal. Journal of Assam Science Society 36: 49–52.
44. Garg S, Sharma N, Sahay R (2001) Socio-cultural aspects of menstruation in an urban slum in Delhi, India. Reproductive Health Matters 9: 16–25. 45. Sharma N, Sumati V, Manhas A (2005) Age at menarche in two caste groups
(Brahmins and Rajputs) from rural areas of Jammu. Anthropologist 8: 55–57. 46. Deb R (2009) Variation in the age at menarche of the Assamese and Bengali girls
of Guwahati, Assam. Anthropologist 11: 259–264.
47. Rokade SA, Mane AK (2009) A study of age at menarche-the secular trend and factors associated with it. The Internet Journal of Biological Anthropology 3 DOI: 10.5580/115b
48. Deb R (2011) Age at menarche in Adolescent Khasi Girls, Meghalaya. Indian Pediatrics 48:69.
49. Singh L, Thapar M (1983) Age at menarche among the Bhotias of Mana village. Anthropologischer Anzeiger 41: 259–262.
50. Khatoon T, Verma AK, Kumari R, Rupani R, Singh M (2011) Age at menarche and affecting bio-social factors among the girls of Lucknow, Uttar Pradesh. Journal of Indian Academy of Forensic Medicine 33: 221–223. 51. Bai KI, Vijayalaksmi B (1978) Age at menarche in South Indian School Girls,
Tirupati (A.P.). Journal of Tropical Pediatrics 24: 171–175.
52. Bagga A, Kulkarni S (2000) Age at menarche and secular trend in Maharashtrian (Indian) girls. Acta Biologica Szegediensis 44: 53–57. 53. Bhaskaran M, Devi G (2003) Is there a secular trend in the menarcheal age of
Indian girls? Indian Journal of Physiology and Pharmacology 47: 361–362. 54. Desai S, Dubey A, Joshi BL, Sen M, Shariff A, et al. (2007) Indian Human
Development Survey: Design and Data Quality. Technical Paper No. 1. University of Maryland, Ann Arbor, MI and National Council of Applied Economic Research: New Delhi. Available: http://ihds.umd.edu/IHDS_ papers/technical%20paper%201.pdf. Accessed 2013 Jan 27.
55. Bakshi A (2008) A note on household income surveys in India. Available: http:// www.agrarianstudies.org/UserFiles/File/S5_Bakshi_A_Note_on_Rural_ Household_Incomes_in_India.pdf. Accessed 2014 May 06.
56. O’Donnell O, van Doorslaer E, Wagstaff A, Lindelow M (2008) Analysing health equity using household survey data: a guide to techniques and their implementation. World Bank Institute Learning Resource Series. The World Bank, Washington, DC.
57. Vyas S, Kumaranayake L (2006) Constructing socio-economic status indices how to use principal component analysis. Health Policy and Planning 21:459– 468.
58. Filmer D, Pritchett LH (2001) Estimating wealth effects without expenditure data-or tears: an application to educational enrolments in states of India. Demography 38: 115–132.
59. Montgomery MR, Gragnolati M, Burke KA, Paredes E (2000) Measuring living standards with proxy variables. Demography 37: 155–174.
60. Howe L, Hargreaves J, Huttly S (2008) Issues in the construction of wealth indices for the measurement of socio-economic position in low-income countries. Emerging Themes in Epidemiology 5: 1–14DOI: 10.1186/1742-7622-5-3. 61. Desai S, Wu L (2010) Structured inequalities- factors associated with spatial
disparities in maternity care in India. Margin-The Journal of Applied Economic Research 4: 293–319.
62. Po J, Subramanian S (2011) Mortality burden and socioeconomic status in India. PLOS ONE 6: 1-8DOI: 10.1371/journal.pone.0016844.
63. World Health Organization (2004) Appropriate body mass index for Asian populations and its implications for policy and intervention strategies. The Lancet 363: 157–163.
64. Subramanian SV, Smith GD (2006) Patterns, distribution, and determinants of under- and over nutrition: a population based study of women in India. The American Journal of Clinical Nutrition 84: 633–640.
65. Baldridge J (1996) Reconciling linguistic diversity: the history and future of language policy in India. 1996; Available: http://www.ling.upenn.edu/
,jason2/papers/natlang.htm. Accessed 2013 Jul 23.
66. Chitnis S (1997) Definition of the terms scheduled castes and scheduled tribes: a crisis of ambivalence. In: Pai Panandiker VA, editor. The politics of backwardness: reservation policy in India. New Delhi: Konark. pp. 88–107. 67. United Nations Children’s Fund (2011) The State of the World’s Children 2011:
Adolescent-an age of opportunity. Available: http://www.unicef.org/sowc2011/ pdfs/SOWC-2011-Main-Report_EN_02092011.pdf. Accessed 2013 Jul 10. 68. World Health Organization, United Nations Population Fund (2007) Adolescent
sexual and reproductive health and HIV/AIDS among young people-Compendium of institutions in India. Regional Office of South East Asia, New Delhi, India. Available: http://apps.searo.who.int/pds_docs/B0508.pdf. Accessed 2013 Aug 9.
69. Bellis MA, Downing J, Ashton JR (2006). Adults at 12? Trends in puberty and their public health consequences. Journal of Epidemiology and Community Health 60: 910–911.
70. Tripathi N, Sekher TV (2013) Youth in Indian ready for sex education: emerging evidence from national surveys. PLoS ONE 8: e71584. DOI: 10.1371/ journal.pone.0071584.
71. Planning Commission, Government of India (2011) India Human Development Report 2011- Towards Social Inclusion, Oxford University Press, New Delhi, India.
72. Mishra GD, Cooper R, Tom SE, Kuh D (2009) Early life circumstances and their impact on menarche and menopause. Womens Health 5: 175–190. 73. Rees M (1993) Menarche when and why? Lancet 342: 1375–1376.
74. Liestol K, Rosemberg M (1995). Height, weight and menarcheal age of schoolgirls in Oslo: An update. Annals of Human Biology 22:199–205. 75. Cameron N, Nadgee I (1996) Menarcheal age in two generations of South
African Indians. Annals of Human Biology 23: 113–119.