A New Index to Perform Shadow Detection
in GeoEye-1 Images
Claudio Meneghini1, Claudio Parente2
Department of Sciences and Technologies, University of Naples “Parthenope” Centro Direzionale, Isola C4, Naples, 80143, Italy
1
Abstract — With the introduction of new satellites for earth monitoring characterized by very high resolution (VHR) sensors, new algorithms to recognize shadow in the supplied images are necessary. Automatic shadow detection can enhance the interpretability of the images in several applications such as classification and change detection. Several approaches are present in literature for shadow detection and their adaptation and particularization for VHR satellite images are still in evolution. The goal of this paper is to propose a new index for shadow detection based on multispectral files processing. GeoEye-1 satellite data are used for this study: IHS pan-sharpening method is applied to transfer pixel dimensions of the panchromatic image (spatial resolution: 0.5 m x 0.5 m) into the multispectral images (2 m x 2 m); an index named ERGAS is used to test the quality of the resulting raster files. Dealing with the problem of the shadow detection, a new index is defined to identify the affected pixels both in the original as well as pan-sharpened images. The results are compared with them by another index named ratio that is generally applied for shadow detection in multispectral images: issues and advantages, derived by using the proposed technique, are discussed.
Keyword - GeoEye-1, VHR, GSDI, Remotely sensed images, Shadow detection, Pan-sharpening I.INTRODUCTION
Today High Resolution satellite images are largely used in many application fields of remote sensing because they permit to accurately identify and contour objects and land covers; pixel dimensions are reduced to less than 1 m and some authors define them Very High Resolution (VHR) images [1]. These very small cell sizes impact significantly on remote sensing applications originating new approaches. In the case of coastline detection, for example, the increment of geometric accuracy requires considerations about other aspects (water dynamics, tidal fluctuations, moment of acquisition, geomorphological units, etc.) that are not necessary with low and medium resolution [2]. Using VHR satellite images, segmentation permits to extract detailed contour objects particularly useful for several applications such as post-earthquake collapsed building recognition [3]. Generally, to avoid noise on the signals, multispectral sensors for remote sensing capture data with lower spatial resolution than the panchromatic ones. For consequence, similar to those with low and medium resolution, VHR sensors supply multispectral images with greater dimensions of pixels than panchromatic ones (usually a spatial resolution ratio of 1:4). To get over this limit, Pan-sharpening is applied: it is a fusion process that enhances spatial resolution of multispectral images, allowing them to get the same panchromatic cell size [4]. In VHR images, both panchromatic as well as multispectral ones (pan-sharpened or not), shadow effects are more evident, especially in urban areas [5]. It is a phenomenon that can’t be avoided and originates partial or total loss of radiometric information, false colour tones and object distortion [6]. The shadows can be classified in self and cast shadow [7]: the first occurs on the portion of an object that is not illuminated by direct light while the second is the area projected by the object in the direction of direct light. There a lot of methods to identify shadow in remotely sensed images. Pan et al. [8] use edge gradient ratio to represent properties of shadow regions: to improve the detection, they assign weight to edge gradient ratio, derived by texture analysis based on text on feature. Zhang et al [9] use image segmentation to recognize shadows: convexity model constraints, like colour and shape factor, have been added to the segmentation criteria to improve it. Lorenzi et al [10], in order to separate shadow and no shadow areas in an image, perform a detection through a hierarchical supervised classification process. Ma et al. [11] implement a normalized saturation-value difference index (NSVDI) in hue-saturation-value (HSV) colour space for the recognition of shadowed regions. Yamazaki et al [12] uses a panchromatic image to manually threshold shadow pixels by visual inspection. Tolt et al [13] compute a shadow image through a Digital Surface Model (DSM) using an estimate of the position of the sun at the time of image acquisition: a supervised classifier, Support Vector Machine (SVM), classifies every pixel in an image as shadowed or not.
focus on pan-sharpening and shadow detection methods used in this paper. The results are illustrated by tables and images in Section 3. An overview of the outcomes and consequential considerations are stated in Section 4.
II.DATAANDMETHODS
A. GeoEye-1 Images
GeoEye-1 satellite has a sun-synchronous orbit at 684 km with an inclination of 98°; it was launched on September, 2008 and present a revisit time of 3 days. On board of satellite GeoEye-1 two types of sensors are available (both with a swath width of 15.2 km at nadir): they give respectively multispectral images with pixel dimensions 1.65 m × 1.65 m at nadir and panchromatic (Pan) images 0.41 m × 0.41 m at nadir. The first type offers spectral resolution better than the second; the second offers spatial resolution better than the first. Radiometric resolution for both is 11 bits with a range of brightness values (BVs) from 0 to 2047. GeoEye-1 images are distributed with resolution of 0.50 m (Pan) and 2.0 m (Multispectral) [16]. The principal characteristics of GeoEye-1 images are resumed in the Table I.
Table I: Characteristics of GeoEye-1 images.
Bands Spectral Range (µm)
Spatial Resolution (m)
Dynamic Range (bits)
Pan 0.450 – 0.800 0.5
11 Blue 0.450 – 0.510
2.0 Green 0.510 – 0.580
Red 0.655 – 0.690 Nir 0.780 – 0.920
The images considered in this paper were acquired on 12th February 2011 at 10:15 (GMT) by GeoEye-1 satellite and cover a zone inside the Province of Caserta (Italy). The bands used are both multispectral (Blue Green, Red, and Near Infrared) and Panchromatic.
From this scene a clip (340 m x 300 m) is extracted: it concerns Municipality of Mondragone (UTM/WGS84 plane coordinates - 33T zone: E1 = 406078 m, N1 = 4552076 m, E2 = 406418 m, N2 = 4551776 m).
Figure 1: The considered GeoEye-1 scene and its location in Campania region.
B. Pan-sharpening Applications
The GeoEye-1 images provide detailed information in terms of both geometric and spectral resolutions, so they are powerful for a variety of applications. Application of pan-sharpening permits to conduct multispectral images to the higher spatial resolution of the panchromatic one [2]. In literature several pan-sharpening methods exist and many attempts are made to classify them: Amro et al [14] identify five groups but they highlights how it isn’t possible to achieve clear results because some techniques can be considered belonging to more categories.
In this work IHS method [17] is used: it is based on the transformation from colour space RGB to the IHS (Intensity-Hue-Saturation).
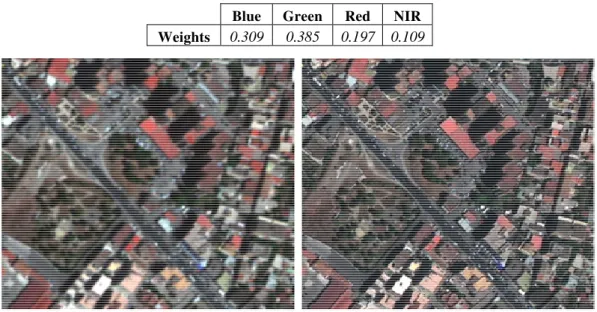
Table II: Weights for GeoEye-1 multispectral images derived by the RSRS.
Blue Green Red NIR Weights 0.309 0.385 0.197 0.109
Figure 2: Comparison between RGB composition of multispectral (left) and pan-sharpened (right) band.
To establish the quality of results (Fig. 2), in accordance with traditional approaches in literature for evaluation of pan-sharpening application, the Relative Dimensionless Global Error in Synthesis was considered. Introduced by Wald [18], this index, also known as ERGAS (Erreur Relative Globale Adimensionnelle de Synthèse), is supplied by the following formula:
where h/l is the ratio between pixel sizes of pan and original multispectral images, RMSE(k) is the RMSE of the kth band, μ(k) is the mean of the kth band. A small value of ERGAS means good image quality: the ideal case is 0, but values proximal to the number of the multispectral bands are currently considered indicators of optimal results. For consequence the obtained values for the imagery (Table III) mean good results for these applications of pan-sharpening.
Table III: Value of ERGAS index.
ERGAS 4.06
C. Shadow Detection
Shadow is a part of the scene that is not directly illuminated by a light source due to an obstructing entity like clouds, trees or elevated objects (buildings, bridges, towers) [19]. In urban remote sensing shadow is the main source of misclassification in extracting land cover information [20]. The selected region is highly affected by shadow of several nature: it covers asphalt, semi-natural soil, vegetation and roofs. A new index, named GeoEye-1 Shadow Detection Index (GSDI) is developed to automatically recognize the shadows on GeoEye-1 imageries.
The bands of Green, Blue and NIR are suitable to automatically detect shadows by using the proposed formula
To validate the efficiency of GSDI, it is compared with another index which is already present in literature: Ratiob_nir [21]. Based on Blue and NIR bands that reflects better shadow characters, it is built on the ratio between the difference and sum of these two bands:
_
composition. Considering the different spatial resolutions, dissimilar training sites are used for multispectral (Fig. 4) and pan-sharpened data (Fig. 7).
Every image has the same training sites for both indexes.
For the two classes, statistic parameters of mean and standard deviation are calculated on the Ratio index to determine separation threshold S using maximum likelihood method: once it is determined, all features having BV equal or higher than S are extracted.
Multispectral indexes classifications are showed in the Figure 5 while the pansharpened ones in the Figure 8
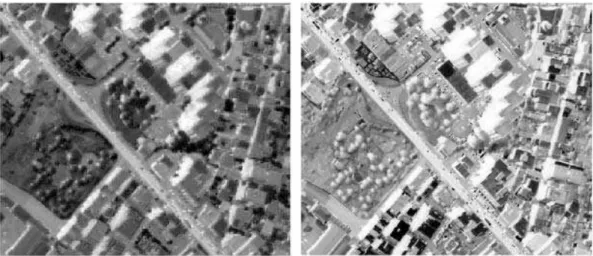
Figure 3: Comparison between multispectral Ratio (left) and GSDI (right) indexes.
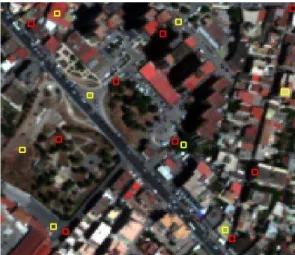
Figure 4: Training sites of shadowed (red) and free shadow (yellow) zones on the multispectral RGB composition.
Figure 6:Comparison between pan-sharpened Ratio (left) and GSDI (right) indexes.
Figure 7: Training sites of shadowed (red) and free shadow (yellow) zones on the pan-sharpened RGB composition.
Figure 8: Comparison between classification of pan-sharpened Ratio (left) and GSDI (right) indexes.
III.RESULTS
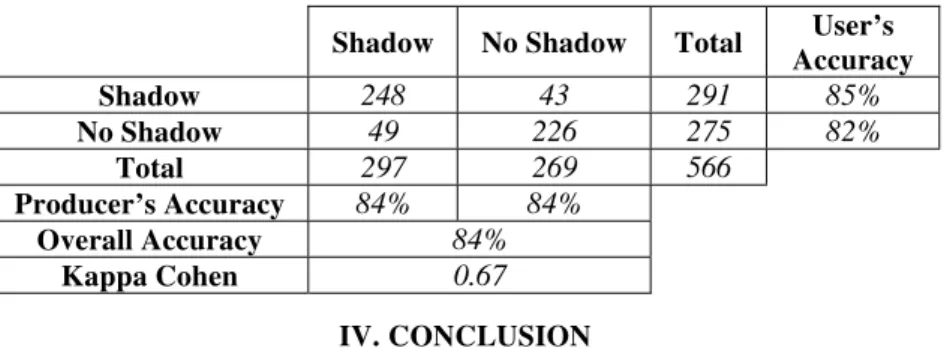
Better performances of GSDI than Ratio are also evident for pan-sharpened data as testified by Tables VI and VII.
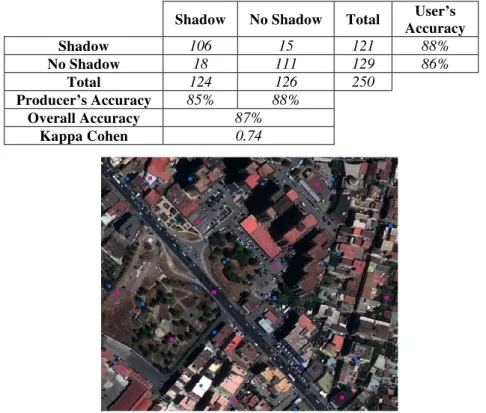
Figure 9: Test sites of shadowed (violet) and free shadow (blue) zones on the multispectral RGB composition
Table IV: Confusion matrix for the classification of Ratio index applied on multispectral bands.
Shadow No Shadow Total User’s Accuracy
Shadow 102 19 121 84%
No Shadow 32 97 129 75%
Total 134 116 250
Producer’s Accuracy 76% 84%
Overall Accuracy 80%
Kappa Cohen 0.59
Table V: Confusion matrix for the classification of GSDI index applied on multispectral bands.
Shadow No Shadow Total User’s Accuracy
Shadow 106 15 121 88%
No Shadow 18 111 129 86%
Total 124 126 250
Producer’s Accuracy 85% 88%
Overall Accuracy 87%
Kappa Cohen 0.74
Table VI: Confusion matrix for the classification of Ratio index applied on pan-sharpened bands
Shadow No Shadow Total User’s Accuracy
Shadow 220 71 291 76%
No Shadow 154 121 275 44%
Total 374 192 566
Producer’s Accuracy 59% 63%
Overall Accuracy 60%
Kappa Cohen 0.20
Table VII: Confusion matrix for the classification of GSDI index applied on pan-sharpened bands
Shadow No Shadow Total User’s Accuracy
Shadow 248 43 291 85%
No Shadow 49 226 275 82%
Total 297 269 566
Producer’s Accuracy 84% 84%
Overall Accuracy 84%
Kappa Cohen 0.67
IV.CONCLUSION
This research presents a new methodology based on a spectral index for shadow detection in GeoEye-1 imageries. GSDI is easy and immediate to calculate. Analyzing results, it is clear how Ratio works rather well on the multispectral images while it is unsuitable for the pan-sharpened ones. In these last images, there are low values of overall accuracy and Cohen, mainly due to the mistakes made on the no shadow test sites erroneously allocated to the shadow class. Using three bands (Blue, Green and NIR in GSDI) despite of two (Blue and NIR in Ratio) the new index has better resolution. The shadow detection is greatly improved because GSDI distinguishes more precisely the shadows and their contours. For example, the objects like cars and asphalt with high brightness values (BV) are properly classified: the same thing doesn’t happen with the Ratio. Results depend on several parameters such as spatial resolution and radiometric post-processing. Even though the radiometric distortions introduced by pan-sharpening technique, GSDI percentage errors is very low: only small shadowed zones aren’t detected. With a pixel base approach, problems regarding the classification still remain: roads and some buildings with asphalt coverage, having BV similar to the shadows, are faultily classified like shadows. To enhance classification results, roads shape could be extracted in advance using other supports like cartographies of the same zone in raster format.
ACKNOWLEDGMENT
This research is included in the Project “Innovative and emerging geomatics techniques of survey, remote sensing (by airplane, satellite, UAV) and WEBGIS for risk mapping in real time and the prevention of environmental damage” supported by the research funding of Research Projects of National Interest (PRIN) 2010-2011“. The fund is managed by MIUR (Ministero dell’Istruzione, dell’Università e della Ricerca), the Italian Ministry of Instruction, University and Research. We would like to thank Prof. Raffaele Santamaria, national coordinator of this project, for scientific support to our research activities.
REFERENCES
[1] M. Basile Giannini and C. Parente, “An object based approach for coastline extraction from Quickbird multispectral images”, International Journal of Engineering and Technology (IJET), vol. 6, pp. 2698–2704, 2015.
[2] P. Maglione, C. Parente, and A. Vallario, “Coastline extraction using high resolution WorldView-2 satellite imagery”, European Journal of Remote Sensing, vol. 47, pp. 685–699, 2014.
[3] V. Baiocchi, R. Brigante, D. Dominici, M. V. Milone, M. Mormile, and F. Radicioni, “Automatic three-dimensional features extraction: The case study of L’Aquila for collapse identification after April 06, 2009 earthquake”, European Journal of Remote Sensing, vol. 47, pp. 413–435, 2014.
[4] Y. Zhang, Understanding image fusion, Photogrammetric Engineering & Remote Sensing, vol. 70, pp. 657–671, 2004.
[5] Q. Zhan, W. Shi and Y. Xiao, “Quantitative analysis of shadow effects in high-resolution images of urban areas” in International Archives of Photogrammetry and Remote Sensing, 2005.
[6] V. Arevalo, J. González, and G. Ambrosio, 2006. “Detecting shadows in QuickBird satellite images”, in ISPRS Commission VII Mid-term Symposium Remote Sensing: From Pixels to Processes, 2006, pp: 330–335.
[7] S. Kumar and A. Kaur, “Algorithm for shadow detection in real color images”, International Journal on Computer Science and Engineering, vol. 2, pp. 2444–2446, 2010.
[8] B. Pan, J. Wu, Z. Jiang and X. Luo, “Shadow detection in remote sensing images based on weighted edge gradient ratio”, in Geoscience and Remote Sensing Symposium (IGARSS), IEEE International, 2014, pp. 505–508.
[10] L. Lorenzi, F. Melgani, and G. Mercier, “A complete processing chain for shadow detection and reconstruction in VHR images”, Geoscience and Remote Sensing, IEEE Transactions on, vol. 50, pp. 3440–3452, 2012.
[11] H. Ma, Q. Qin and X. Shen, “Shadow segmentation and compensation in high resolution satellite images”, in Proc. IEEE IGARSS, 2008, pp. 1036–1039.
[12] F. Yamazaki, W. Liu and M. Takasaki, “Characteristic of shadow and removal of its effects for remote sensing imagery”, in Proc. IEEE IGARSS, 2009, pp. 426–429.
[13] G. Tolt, M. Shimoni and J. Ahlberg, “A shadow detection method for remote sensing images using VHR hyperspectral and LIDAR data”, in Proc. IGARSS, 2011, pp. 4423–4426.
[14] I. Amro, J. Mateos, M. Vega, R. Molina, and A. K. Katsaggelos, “A survey of classical methods and new trends in pansharpening of multispectral images”, EURASIP Journal on Advances in Signal Processing, vol. 79, pp. 1–22, 2011.
[15] C. Parente and R. Santamaria, “Increasing Geometric Resolution of Data Supplied by Quickbird Multispectral Sensors”, Sensors and transducers, vol. 156, pp. 111–115, 2013.
[16] DigitalGlobe. (2015) Fact Sheet GeoEye-1: the world’s highest resolution commercial earth - Imaging satellite. [Online]. Available: http://www.geoimage.com.au/media/satellite_pdfs/ GeoEye_FactSheet_comb.pdf, 2013.
[17] R. Haydn, G. W. Dalke, J. Henkel, and J.E. Bare, “Application of the IHS color transform to the processing of multisensor data and image enhancement”, in International Symposium on Remote Sensing of Arid and Semi-Arid Lands, 1982, pp. 599–616.
[18] L. Wald, “Quality of high resolution synthesized images: Is there a simple criterion?” in Third conference Fusion of Earth data: merging point measurements, raster maps and remotely sensed images, 2000, pp. 99–103.
[19] C. Meneghini and C. Parente, “Application for shadow removal from GeoEye-1 RGB composition”, International Journal of Applied Engineering Research, vol. 10, pp. 15833–15842, 2015.
[20] A.K. Saha, M. K. Arora, E. Csaplovics, and R.P. Gupta, “Land cover classification using IRS LISS III image and DEM in a rugged terrain: a case study in Himalayas”, Geocarto International, vol. 20, pp. 33–40, 2005.
[21] Guangyao, G. Huili, Z. Wenji, T. Xinming and C. Beibei, “An Index-based Shadow Extraction Approach on High-resolution Images”, in International Symposium on Satellite Mapping Technology and Application, 2013, pp: 19–26.
AUTHORPROFILE
Claudio Meneghini. Graduated in Applied Informatics (curriculum: Geomatica), he has discussed a Thesis on Application of Change detection techniques to High resolution images using free and open source GIS software. At present he is fellowship at the Department of Sciences and Technologies, University of Naples "Parthenope". His research activity interests Remote sensing, Image processing, Very High Resolution Satellite images, Pan-sharpening Methods, Shadow detection and removal.