Development via Inhibiting Cell Proliferation,
Angiogenesis, and Inducing Apoptosis
Juan Chen1,2, Dora Lai-Wan Kwong1, Cai-Lei Zhu1, Lei-Lei Chen1, Sui-Sui Dong1, Li-Yi Zhang1, Jun Tian4, Chu-Bo Qi5, Ting-Ting Cao1, Alissa Michelle Go Wong1, Kar-Lok Kong1, Yan Li3, Ming Liu1, Li Fu1,3*, Xin-Yuan Guan1,3*
1Department of Clinical Oncology, The University of Hong Kong, Pokfulam, Hong Kong, China,2Cancer Center, Union Hospital, Tongji Medical College, Huazhong University of Science and Technology, Wuhan, China,3State Key Laboratory of Oncology in Southern China, Cancer Center, Sun Yat-Sen University, Guangzhou, China,
4Department of Biochemistry and Molecular Biology, Tongji Medical College, Huazhong University of Science and Technology, Wuhan, China,5Department of Pathology, Hubei Cancer Hospital, China
Abstract
Deletion of the short arm of chromosome 3 is one of the most frequent genetic alterations in many solid tumors including nasopharyngeal carcinoma (NPC), suggesting the existence of one or more tumor suppressor genes (TSGs) within the frequently deleted region. A putative TSGRBMS3(RNA binding motif, single stranded interacting protein 3), located at 3p24-p23, has been identified in our previous study. Here, we reported that downregulation ofRBMS3was detected in 3/3 NPC cell lines and 13/15 (86.7%) primary NPC tissues. Functional studies using both overexpression and suppression systems demonstrated that RBMS3 has a strong tumor suppressive role in NPC. The tumor suppressive mechanism ofRBMS3was associated with its role in cell cycle arrest at the G1/S checkpoint by upregulating p53 and p21, downregulating cyclin E and CDK2, and the subsequent inhibition of Rb-ser780. Further analysis demonstrated that RBMS3 had a pro-apoptotic role in a mitochondrial-dependent manner via activation of caspase-9 and PARP. Finally, RBMS3 inhibited microvessel formation, which may be mediated by down-regulation of MMP2 andb-catenin and inactivation of its downstream targets, including cyclin-D1, c-Myc, MMP7, and MMP9. Taken together, our findings define a function for RBMS3 as an important tumor suppressor gene in NPC.
Citation:Chen J, Kwong DL-W, Zhu C-L, Chen L-L, Dong S-S, et al. (2012)RBMS3at 3p24 Inhibits Nasopharyngeal Carcinoma Development via Inhibiting Cell Proliferation, Angiogenesis, and Inducing Apoptosis. PLoS ONE 7(9): e44636. doi:10.1371/journal.pone.0044636
Editor:Qian Tao, The Chinese University of Hong Kong, Hong Kong
ReceivedMay 2, 2012;AcceptedAugust 6, 2012;PublishedSeptember 5, 2012
Copyright:ß2012 Chen et al. This is an open-access article distributed under the terms of the Creative Commons Attribution License, which permits
unrestricted use, distribution, and reproduction in any medium, provided the original author and source are credited.
Funding:This work was supported by grants from the National Natural Science Foundation of China (30700820, 30772475 and 30971606), the National Key Sci-Tech Special Project of China (2008ZX10002-022), and the Hong Kong UGC Area of Excellent Scheme (AoE/M-06/08). The funders had no role in study design, data collection and analysis, decision to publish, or preparation of the manuscript.
Competing Interests:The authors have declared that no competing interests exist.
* E-mail: xyguan@hkucc.hku.hk (LF); gracelfu@hkucc.hku.hk (XG)
Introduction
Nasopharyngeal carcinoma (NPC) is a distinct and geograph-ically important disease [1], which accounts for 80,000 new cases and 50,000 deaths per year [2]. The majority (75–90%) of newly diagnosed NPC patients have loco-regionally advanced disease, commonly with cervical nodal metastases [3]. Currently, the standard of care for these patients consists of concurrent chemo-radiotherapy with cisplatin-based regimens, generally followed by adjuvant chemotherapy. The cause for NPC development is complex, including viral, genetic and environmental factors[4–6]. It is widely accepted that infection by the Epstein-Barr virus (EBV) plays a vital role in the pathogenesis of NPC; however, the molecular pathogenesis is also associated with the inactivation of tumor suppressor genes (TSGs). To date, the exact cellular and molecular mechanisms leading to NPC have not been systemat-ically evaluated.
The 3p chromosomal region is frequently deleted in multiple solid tumors [9], suggesting the existence of one or more TSGs contributing to the risk of developing NPC. Through massive
protein, its role in the pathogenesis of NPC remains unclear. In the present study, the expression pattern of RBMS3 in primary NPCs and NPC cell lines was investigated. The tumor suppressive effects and corresponding mechanisms of RBMS3 were characterized.
Results
RBMS3 is Frequently Down-regulated in NPC
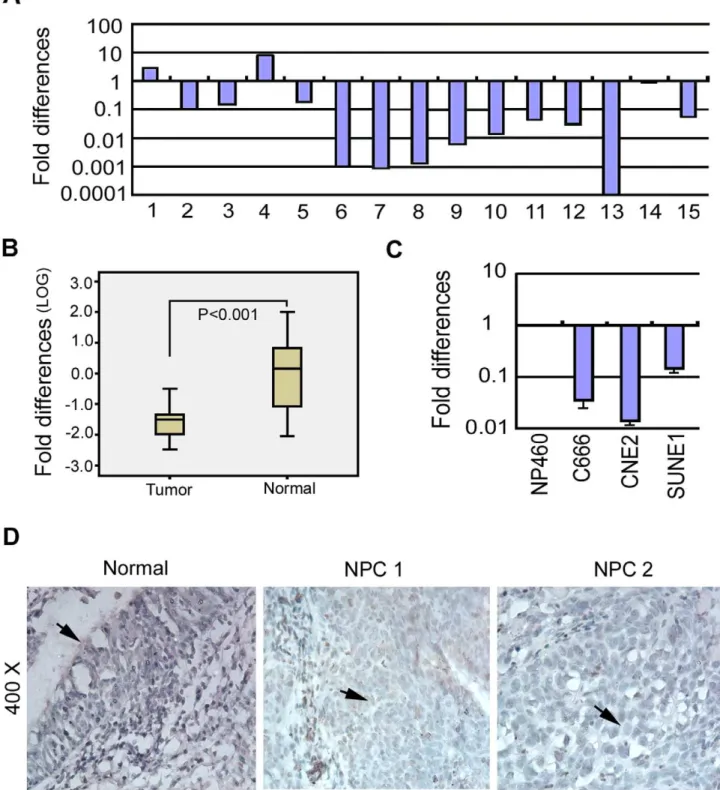
Quantitative real-time PCR (qRT-PCR) was performed to evaluate the expression levels of RBMS3in 15 pairs of primary NPCs and their corresponding non-tumor samples. Down-regulation ofRBMS3was detected in 13/15 (86.7%) NPC tissues compared to their normal counterparts (Fig. 1A). Furthermore, the box plot showed a highly significant difference in the mean expression levels ofRBMS3between NPC tumors and non-tumor samples (p,0.001; Fig. 1B). We next examinedRBMS3expression in NPC cell lines. The result showed that RBMS3 was downregulated in all three tested NPC cell lines (C666, CNE2 and SUNE1) compared to the immortalized nasopharyngeal (NP) cell line, NP460 (Fig. 1C). The protein expression level of RBMS3 was also evaluated in 30 pairs of primary NPCs and non-tumor samples by immunohistochemical staining (IHC). Moderate or strong nuclear staining of RBMS3 was detected in 30 non-tumor tissues, whereas no or weak nuclear staining of RBMS3 was observed in 24/30 (80.0%) of NPC tumor tissues (Fig. 1D).
RBMS3 has Tumor Suppressive Ability
To investigate whetherRBMS3 has tumor suppressive ability, RBMS3was stably transfected into 2 NPC cell lines (SUNE1 and CNE2), and 4 clones (SUNE1-R4, SUNE1-R5, CNE2-R1 and CNE2-R2) were selected for functional studies. Empty vector-transfected cells were used as control (SUNE1-V1 and CNE2-V1). Expression ofRBMS3in SUNE1-R4, SUNE1-R5, CNE2-R1 and CNE2-R2 cells was confirmed by qPCR (Fig. 2A) and Western blot analysis (Fig. 2B). Tumor suppressive function ofRBMS3was studied by cell growth assay, foci formation assay, and tumor xenograft experiment. Cell growth assay showed that the growth rates were significantly decreased in SUNE1-R4, SUNE1-R5, CNE2-R1 and CNE2-R2 cells (p,0.05, Student’st-test) compared to SUNE1-V1 cells and CNE2-V1 cells, respectively (Fig. 2B). Focus formation assay showed that RBMS3 could significantly inhibit foci formation (p,0.001, Student’st-test) in SUNE1-R4, SUNE1-R5, CNE2-R1 and CNE2-R2 cells compared to control cells (Fig. 2C).
The tumor suppressive potential ofRBMS3was also evaluated by xenograft tumor formation in athymic nude mice. Subcutane-ous tumor formation was observed in all nude mice injected with SUNE1-V1 (n = 10) and CNE2-V1 (n = 10) cells 28 days post-injection. Xenograft tumor growth curve showed that tumors induced by SUNE1-R4 and SUNE1-R5 cells grew significantly slower than the SUNE1-V1 cells (p,0.05) (Fig. 2D). The average
volume of the tumors induced by SUNE1-R4
(630.006135.18 mm3) and SUNE1-R5 (864.006144.68 mm3) cells were significantly smaller compared to the tumors induced by SUNE1-V1 cells (1687.806270.37 mm3, p,0.05) (Fig. 2D). Similarly, the average volume of the tumors induced by CNE2-R1 (501.98673.12 mm3) and CNE2-R2 (522.13674.19 mm3) were significantly reduced compared to the tumors induced by CNE2-V1 cells (770.466187.07 mm3, p,0.05) (Fig. 2D).
RBMS3 Arrests Cell Cycle at G1-S Checkpoint
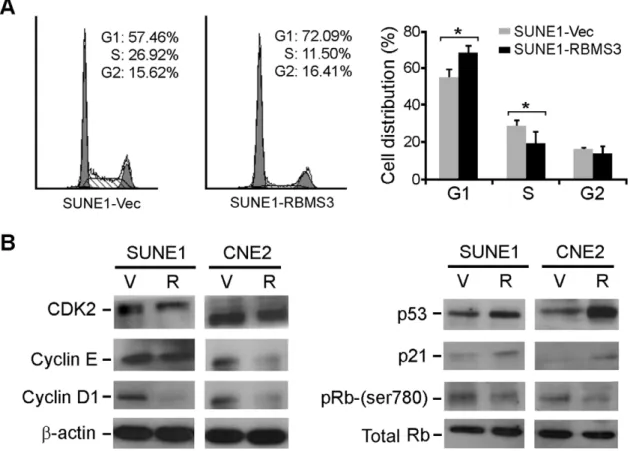
To understand the tumor suppressive mechanism ofRBMS3, flow cytometry was performed to compare the DNA content between the SUNE1-Vec and SUNE1-RBMS3 cells. The results
showed that the proportions of SUNE1-RBMS3 cells in the G1-phase and S-G1-phase were significantly increased and decreased, respectively, in the SUNE1-RBMS3 cells (p,0.05) compared with SUNE1-Vec cells, suggesting thatRBMS3was able to arrest cell cycle at G1/S checkpoint (Fig. 3A). Western blot analysis found that the G1/S checkpoint promoting factors (CDK2, cyclin E and cyclin D1) and inhibiting factors (p53 and p21) were downregu-lated and upregudownregu-lated in RBMS3-tansfected NPC cells, respec-tively, compared to control cells (Fig. 3B). Since CDK2 plays a critical role in the inactivation of Rb, the level of the inactive form (phosphorylated) of Rb was also compared between RBMS3 -transfected and vector tarnsfected NPC cells by western blotting. The result showed that inactive form of Rb (Ser780) was reduced inRBMS3-transfected cells compared to control cells. However, the total amount of Rb protein did not change significantly (Fig. 3B).
Ectopic Expression of RBMS3 Induces Apoptosis
To explore whether RBMS3 has a pro-apoptotic effect, the apoptotic index was compared between Vec and SUNE1-RBMS3 cells by TUNEL staining. Prior to straurosporine (STS) treatment, TUNEL analysis revealed that the apoptotic index in SUNE1-Vec cells (0.5%60.9%) was lower than SUNE1-RBMS3 cells (7.1%66.0%; p = 0.057). After STS treatment, the apoptotic index in SUNE1-Vec (14.8%64.1%) was significantly lower than that of SUNE1-RBMS3 (45.3%64.5%; p,0.05), confirming that RBMS3 had a pro-apoptotic ability (Fig. 4A). To elucidate the molecular basis of apoptosis, we examined the potential for pro-apoptotic mitochondrial permeability transition by measuring the loss of mitochondrial DYm using JC-1 dye. Red or orange fluorescence indicates intact mitochondria, whereas green fluores-cence indicates a collapse in mitochondrial DYm. The results showed that the mitochondrial permeability and apoptotic index in RBMS3-transfected cells were significantly higher than those of control cells even prior to STS treatment (Fig. 4B). Western blot analysis also indicated that the cleavage of caspase-9 and PARP was dramatically increased in SUNE1-RBMS3, however, no change was observed for caspase-8 (Fig. 4C).
RBMS3 Inhibits Angiogenesis
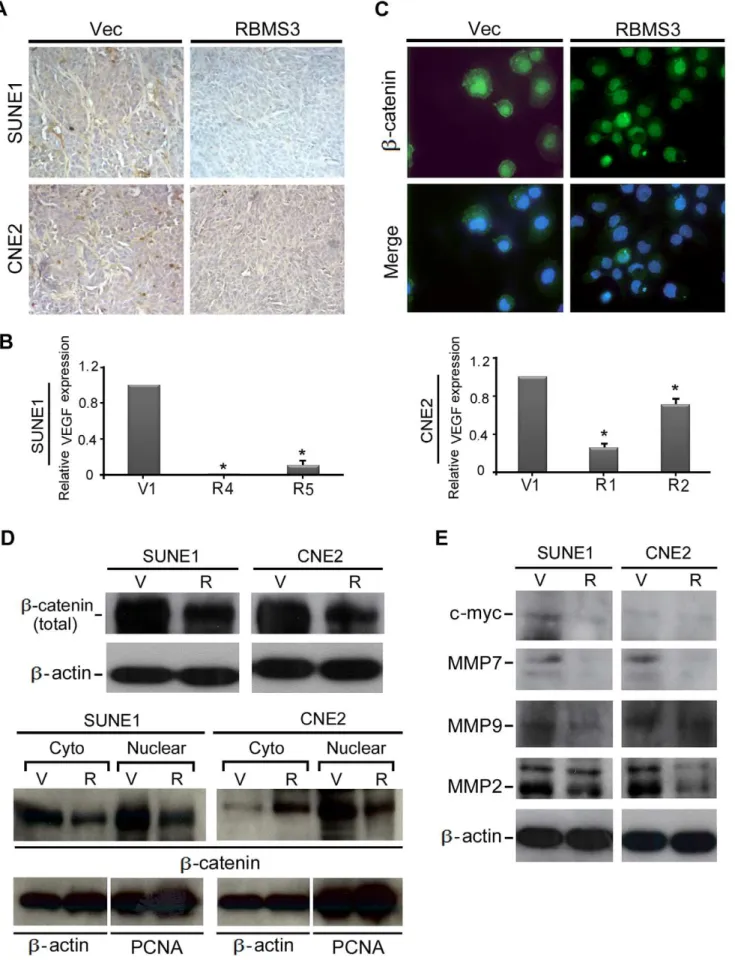
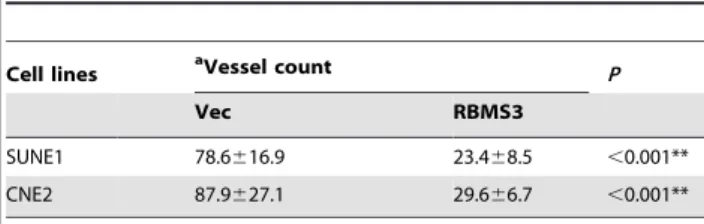
To study the potential effect of RBMS3 on angiogenensis, the development of microvessel in tumor sections of mouse xenografts was examined by IHC staining with a vascular endothelial cell marker CD34. As shown in Fig. 5A, a robust angiogenic response, as determined by high CD34 positivity, was observed in the empty vector-induced tumors. Conversely, CD34-positive vessels were rarely found within the RBMS3-induced tumors. The number of vessels counted in RBMS3-induced and empty vector-induced tumors was summarized in Table 1. Furthermore, the mRNA expression level of VEGF was also compared between RBMS3 -transfected and vector--transfected NPC cells by qPCR analysis. As shown in Fig. 5B, the expression of VEGF was dramatically decreased in RBMS3-transfected NPC cells compared to control cells. (p,0.05, Fig. 5B).
RBMS3-transfected NPC cells. As expected, all the b-catenin downstream targets including the two angiogenesis-related pro-teins MMP9 and MMP2 were significantly downregulated in
RBMS3 transfected NPC cells, suggesting that RBMS3 has a strong angiogenesis inhibiting role in NPC (Fig. 5E).
Figure 1. Downregulation of RBMS3 in nasopharyngeal carcinoma (NPC).(A) Expression ofRBMS3in 15 primary NPC cases was compared using qPCR between tumor tissues (T) and their paired normal tissue (N). GAPDH was set as an internal control. (B)RBMS3expression was normalized by internal controlGAPDH. Statistical analysis confirmed the qPCR results (p,0.001). (C) qPCR analysis ofRBMS3expression in three NPC cell lines (C666, CNE2 and SUNE1). The fold changes ofRBMS3expression were compared with the immortalized NP cell line, NP460. (D) Immunohistochemical detection of RBMS3 protein in NPC tissue samples and non-tumor nasopharyngeal tissues. Normal: strong positive staining for RBMS3 protein in normal nasopharyngeal epitheliums (arrowhead). NPC1: weak positive staining for RBMS3 protein in NPC tissues (arrowhead). NPC2: negative staining for RBMS3 protein in NPC tissues (arrowhead).
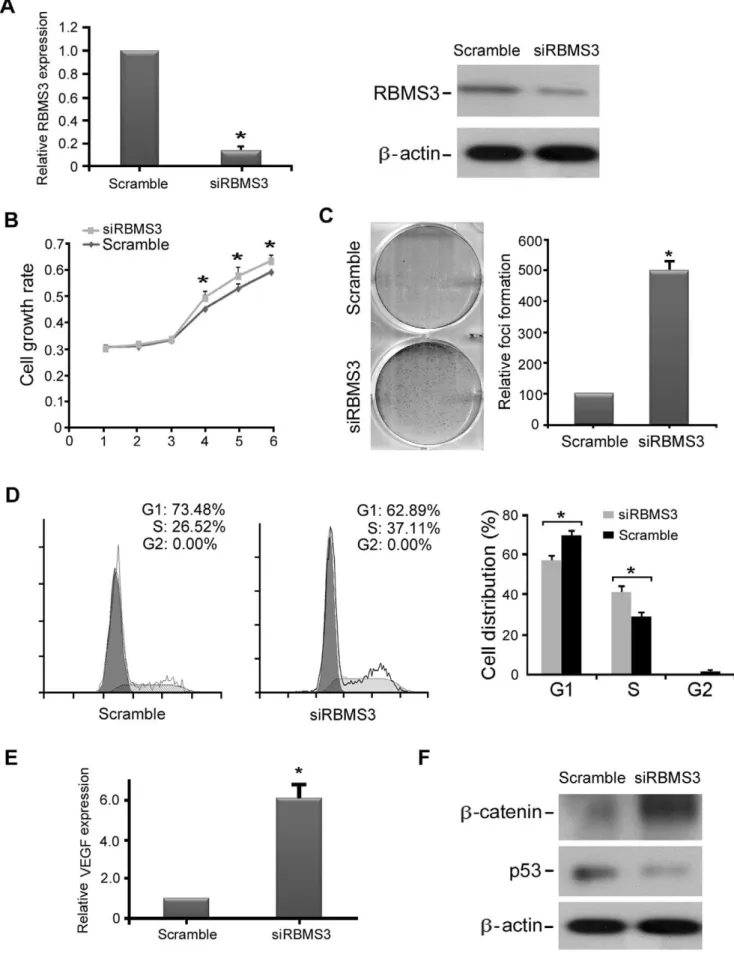
To further demonstrate the tumor-suppressive function of RBMS3, RNAi was used to knockdown endogenous RBMS3 expression in NP460 cells. The silencing effect was confirmed by both qPCR and western blotting (Fig. 6A). The function ofRBMS3 in RBMS3 knockdown NP460 cells was studied by cell growth assay, foci formation assay, and cell cycle analysis. The results showed that knockdown of RBMS3 in NP460 cells could increase cell growth rate (Fig. 6B), enhance foci formation ability (Fig. 6C), and promote cell cycle (Fig. 6D) compared to control cells. Moreover, we found that the expression of VEGF was significantly upregulated in RBMS3 knockdown NP460 cells by qPCR analysis (Fig. 6E), whereas b-catenin was upregulated and p53 was downregulated in RBMS3 knockdown NP460 cells by western blotting (Fig. 6F), as compared to control cells. These observations further support that RBMS3 is an important tumor suppressor with anti-proliferation and anti-angiogenesis abilities in NPC.
Discussion
The etiology of NPC is complex, and includes viral, genetic and environmental factors [4–6]. The earliest and most common genetic change observed in NPC patients maps to the short arm of chromosome 3 where deletions are observed frequently. One candidate tumor suppressor gene, RBMS3, which resides on human chromosome 3p24-3p23, is widely expressed in the embryo as well as in the adult organisms. In the present study, downregulation of RBMS3 was frequently detected in NPCs at both the mRNA and protein levels, suggesting thatRBMS3might play a pivotal role in the NPC development and progression. The observation that this protein localizes in the nuclear suggests that it may be involved in a nuclear fuction such as controlling RNA transcription. The tumor-suppressive function of RBMS3 was characterized in two NPC cell lines (SUNE1 and CNE2). Bothin vitro (cell growth rate, colony formation in soft agar and foci formation) and in vivo (tumor formation in nude mouse) assays
growth rate was significantly decreased inRBMS3-transfected SUNE1 and CNE2 cells (* p,0.05; ** p,0.001, Student’st-test). Values were expressed as mean6SD of three independent experiments. (D) Foci formation assay showed that the number of foci was significantly decreased inRBMS3 -transfected SUNE1 and CNE2 cells compared to the control cells, respectively (** p,0.001, Student’st-test). The results were expressed as mean6SD of three independent experiments. (E) Representatives of tumor formation in nude mice. Tumors induced by SUNE1-V1 (left) and SUEN1-RBMS3 (right) were indicated by arrows, respectively. Excised tumors were shown in the bottom. Summary of tumor growth rates in nude mice induced by
RBMS3- and empty vector-transfected NPC cells. The average tumor volume was expressed as mean6SD in 10 inoculated sites for each group (* p,0.05).
doi:10.1371/journal.pone.0044636.g002
Figure 3.RBMS3arrests cell cycle at the G1/S checkpoint.(A) Representative and summary of DNA content detected by flow cytometry showed that the percentage of cells in the S phase was lower while the percentage of cells in the G1 phase was higher in SUNE1-RBMS3 cells than that in SUNE1-V1 cells. (* p,0.05, Student’st-test). Values were expressed as mean6SD of three independent experiments. (B) Protein expressions of cyclin D1, cyclin E, CDK2, p53, p21, Rb and Rb (Ser780) were compared betweenRBMS3- and empty vector-transfected NPC cells.b-actin was used as a loading control.
Figure 4. Ectopic expression ofRBMS3induces apoptosis.(A) Representative images of TUNEL staining. After STS treatment, more apoptotic cells (green) were detected in RBMS3 cells compared to V1 cells (arrowhead). The apoptotic indexes of RBMS3 cells and SUNE1-V1 cells (before and after STS treatment) were summarized in the right panel (*p,0.05). (B) This event was measured by loss of mitochondrialDYm using JC-1 dye. Red or orange fluorescence indicates intact mitochondria, whereas green fluorescence indicated a collapse in mitochondrialDYm. Prior to STS treatment the SUNE1-RBMS3 cells reveal a significantDYmloss (green fluorescence,6400) and higher apoptotic index compared to
SUNE1-V1 cells (red/orange fluorescence; left panel) (*p,0.05). (C) The cleavages of caspase-9, caspase-8, and PARP were compared betweenRBMS3 -transfected and empty vector--transfected SUNE1 cells.b-actin was used as loading control.
Figure 5.RBMS3inhibits angiogenesis.(A) The tumor sections were stained for the endothelial cell marker CD34 (6200). The RBMS3-induced
demonstrated that RBMS3 had a strong tumor suppressive potential in NPC cells.
Molecular analysis found that the tumor-suppressive effect of RBMS3was closely associated with its role in cell cycle arrest at G1/S checkpoint via upregulation of p53 and p21, and downregulation of cyclin D1, cyclin E/CDK2 and Rb-ser780. The increased expression of p53, which is a DNA-binding protein and functions as a tumor suppressor, can induce the expression of p21. p21 has a pivotal role in the G1/S transition through inhibiting the cyclin E/CDK2 complex [21]. Activation of the cyclin E/CDK2 complex can destruct Rb-E2F binding, which contributes to the reduction of phosphorylation form of Rb, and finally activates the transcription of genes necessary for S-phase entry and cell cycle progression [22,23]. These findings indicate thatRBMS3could be necessary for an orderly G1/S transition in NPC cells.
Another data supporting thatRBMS3is a tumor suppressor in NPC was its role in inducing apoptosis. Notably, the apoptotic index between RBMS3 transfected NPC cells and control cells showed significant difference after STS treatment, indicating a unique mechanism underlying the strong pro-apoptotic effect of RBMS3 in NPC cancer cells. It has been reported that RBMS3 increased the expression of Prx1 transcription factor [19], which is a tumor suppressor in esophageal squamous cell carcinoma [24]. Prx1, as a novel interaction partner for the lifespan regulator protein p66Shc, binds to the N-terminal domain of p66Shc [25,26], and subsequently induces changes in the permeability transition of mitochondrial membranes and results in the release of cytochrome C and apoptosome activation [27,28]. Interestingly, our results also found that the pro-apoptotic role of RBMS3 was mediated through the intrinsic mitochondrial pathway, as caspase-9 and mitochondrial permeability, but not caspase-8, was increased. However, whether RBMS3 could induce the expression of Prx1 and lead to the activation of a similar apoptotic pathway need to be further investigated.
Whether or not the growth of vessels occurs in a tissue depends on the equilibrium between the relative amounts of molecules that induce and inhibit angiogenesis [29]. A growing body of evidence illustrates that the inactivation of TSG and activation of oncogenes play an important role in this phenotypic switch. For instance, oncogenic stimuli such as ras, v-src and c-jun [30–33] and inactivation of p53, VHL, and RB2/P130 results in an increased VEGF production [30,34,35]. Our data demonstrate that RBMS3
can modulate the angiogeneic balance and inhibit the microvessel formation potentially through increasing the expression of p53 and decreasing the expression of MMP9 and MMP2 [36].
b-catenin is maintained at low levels in quiescent cells by interaction with protein kinases, such as adenomatous polyposis coli, casein kinase 1, and glycogen synthase kinase 3 [37]. The aberrant cytoplasmic accumulation ofb-catenin induces Tcf/Lef-mediated transcriptional activity, and enhances the invasion and migration of oral squamous cell carcinoma [38]. The translocation ofb-catenin into the nucleus can initiate carcinogenesis when Wnt is present [39].b-catenin levels in nucleus are increased in 92% of NPC tumors, makingb-catenin an important component in NPC development [40,41]. Our data showed thatb-catenin from both whole cell extracts and nuclear fractionation was significantly downregulated in RBMS3 transfected NPC cells compared to control cells, suggesting that RBMS3 could inhibit the nuclear translocation of b-catenin in NPC cells. The inhibition of b -catenin nuclear translocation in RBMS3-expressing cells was further confirmed by detecting downregulation of its targets including c-Myc, MMP7, MMP9 and MMP2. Overexpression of c-Myc has been detected in about 90% of NPCs which was associated with poor survival rate in NPC patients [42,43]. MMP7 is one of the well-known targets ofb-catenin. It has been reported that MMP7 plays an essential role in cancer invasion and metastases [44,45]. In this study, MMP7 expression could be effectively downregulated whenRBMS3was introduced into NPC cells.
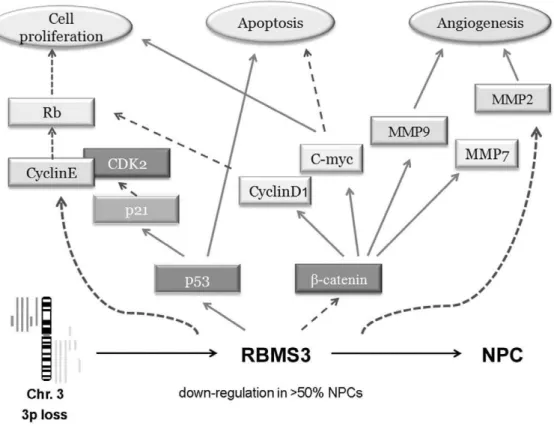
Moreover, our group recently revealed that RBMS3 could directly bind to the promoter region of c-Myc [46], suggesting that RBMS3 also possesses the DNA binding activity. Based on our findings, we hypothesize that RBMS3 may regulate certain key proteins involved in cell cycle, apoptosis and angiogenesis. The potential molecular mechanisms underlying the RBMS3-mediated tumor suppression in NPC are summarized in Fig. 7. In conclusion, our data provide a foundation to explore the role of RBMS3 in the NPC pathogenesis. More comprehensive under-standing of the tumor suppressive mechanisms of RBMS3 in NPC would provide much more effective therapeutic strategy for the management of NPC patients.
Materials and Methods
Ethics Statement
Tumor specimens used in this study were approved by the Committees for Ethical Review of Research involving Human Subjects at University of Hong Kong. Written Informed consent was obtained from the patients involved. Animal operation was carried out according to the protocols approved by the Committee on the Use of Live Animals in Teaching and Research (CULATRA). Lisence which could conduct live animal experi-ments was approved by Hong Kong Department of Health (lisence no. (09–770) in DH/HA&P/8/2/3 Pt.17).
Cell Lines and Primary Tumor Specimens
EBV-positive NPC cell line C666 was derived from NPC tissue harbored latent EBV infection [47,48], while EBV-negative NPC cell lines CNE2 and SUNE1 were derived from poorly
differen-and CNE2 cells was confirmed by qPCR. Empty vector-transfected cells were used as control. (C) Representative IF images showed thatb-catenin was mainly localized in the nucleus of SUNE1-RBMS3 cells, whereas it was mainly localized in cell membrane and cytoplasm in SUNE1-V1 cells. (D) Western blot analysis ofb-catenin from whole cell, nuclear and cytosolic extract was compared between inRBMS3- and empty vector-transfected SUNE1 and CNE2 cells.b-actin and PCNA were used as loading control. (E)Western blot analysis of c-Myc, MMP7, MMP9 and MMP2 was compared between
RBMS3- and empty vector-transfected SUNE1 and CNE2 cells.b-actin was used as loading control. doi:10.1371/journal.pone.0044636.g005
Table 1.Quantitation of microvessels formed in empty vector and RBMS3-transfected NPC cells induced mouse tumor xenografts (n = 10 tumors/group).
Cell lines aVessel count P
Vec RBMS3
SUNE1 78.6616.9 23.468.5 ,0.001**
CNE2 87.9627.1 29.666.7 ,0.001**
aValues represent mean
6standard error.
tiated NPC [49]. NP460 is an immortalized nasopharyngeal epithelium cell line [50]. Three NPC cell lines (C666, SUNE1, CNE2) and one immortalized nasopharyngeal epithelial cell lines (NP460) were kindly provided by Professor Tsao (Department of Anatomy, The University of Hong Kong). CNE2, SUNE1 and C666 were cultured in RPMI-1640 medium supplemented with 10% fetal bovine serum. NP460 cells were cultured in defined keratinocyte serum-free medium.
The primary NPC tumor tissues and their paired nontumorous tissues from 15 confirmed NPC patients (Age: 44–77 years; Female: n = 4; Male: n = 11) were collected immediately after surgical resection from the Queen Mary Hospital in Hong Kong. Samples used in this study were collected following methods approved by the Committee for Ethical Review of Research involving Human Subjects at the University of Hong Kong.
Establishment of RBMS3 Expressing Cell Lines
The OmicsLink-RBMS3 was purchased from GeneCopoeia Inc. (Germantown, MD) and sub-cloned into pcDNA3.1 (+) (Invitrogen, Carlsbad, CA) according to the manufacture’s protocol. RBMS3 was then stably transfected into the NPC cell lines SUNE1 and CNE2 using LipofectamineTM 2000
(Invitro-gen, Carlsbad, CA). Blank vector pcDNA3.1 (+) transfected cells (SUNE1-V1 and CNE2-V1) were used as controls.
RNA Extraction, Reverse Transcription and PCR
Total RNA from cultured cells and tumor tissues were extracted using Trizol (Invitrogen, Carlsbad, CA) according to the manufacturer’s instructions. Reverse transcription of total RNA was performed using SuperScript III kit (Invitrogen, Carlsbad, CA). The expression of RBMS3 was determined by RT-PCR at RNA level using the appropriate primer set (RBMS3-F: 59 -ACAAGAGCAAGACCCAACA- AA-39; RBMS3-R: 59 -TGTCCAAAGGGTTTCAGCATA-39). Images were processed and analyzed with ImageJ software (Wayne Rashband, Nationlal Institute of Health, Bethesda, MD). Quantitative data were exported and RBMS3 expression was normalized using GAPDH as a control.
Quantitative Real-time PCR (qPCR)
qPCR was performed using the SYBR Green Supermix and the ABI7900HT Fast Real-Time PCR system (Applied Biosystems, Foster City, CA). RBMS3 specific primers (RBMS3-F: 59
-ACAAGAGCAAGACCCAACAAA-39; RBMS3-R: 59
-siRBMS3- and siScramble-transfected NP460 cells (* p,0.05; ** p,0.001, Student’st-test). Values were expressed as mean6SD of three independent experiments. (C) Foci formation assay showed that the number of foci was significantly increased in siRBMS3-transfected NP460 cells compared to control cells (* p,0.05, Student’st-test). The results were expressed as mean6SD of three independent experiments. (D) Representative and summary of DNA content detected by flow cytometry showed that the percentage of cells in the S phase was higher while the percentage of cells in the G1 phase was lower in siRBMS3-transfected NP460 cells than that in control cells. (* p,0.05, Student’st-test). (E) Expression ofVEGFin siRBMS3-and siScramble-transfected NP460 cells was confirmed by qPCR. (* p,0.05, Student’st-test). The results were expressed as mean6SD of three independent experiments. (F)b-catenin was significantly up-regulated while p53 was significantly down-regulated in siRBMS3-transfected NP460 cells compared to control cells by Western blot analysis.b-actin was used as a loading control.
doi:10.1371/journal.pone.0044636.g006
Figure 7. A schematic diagram showing the role ofRBMS3in malignant transformation of nasopharyngeal carcinoma cell.Activation R, inhibitionR.
TGTCCAAAGGGTTTCAGCATA-39) were bought from Gen-eCopoeia Inc. (Germantown, MD). The 18s RNA was used as internal control. The assay was performed in triplicate and values were normalized using the internal control. PCR was performed for 40 cycles at 95uC for 10sec, 60uC for 20sec and 72uC for 15sec. PCR products were subjected to a dissociation curve analysis using the light cycler system to exclude amplification of nonspecific products. Quantitation of the PCR data was processed using the DCTmethod as described previously [51].
Tumor-suppressive Function of RBMS3
To test the tumor-suppressive function of RBMS3, stable RBMS3-expressing clones (SUNE1-R4, SUNE1-R5, CNE2-R1 and CNE2-R2) were selected for further study. Empty vector transfected NPC cells (SUNE1-V1 and CNE2-V1) were used as control. Cell proliferation assay and foci formation assay were carried out as described previously [13]. The in vivo tumor suppression ability of RBMS3 was investigated using a tumor xenograft experiment. Approximately 26106RBMS3-expressing
cells and control cells were injected subcutaneously (s.c.) into the right and left hind legs of 4-week-old nude mice (n = 10 for each group), respectively. Tumor formation in nude mice was monitored over a 4-week period. The tumor volume was calculated by the formula V = 0.56L6W2. Following sacrifice,
tumors were excised, fixed in 10% formalin and embedded in paraffin block for IHC study.
Small Interfering RNA Transfection
RBMS3expression was silenced by double-stranded siRNA of targeting of RBMS3 (sense 59 -CCAACCGCAUGAUUCCACAtt-39; antisense 59-UGUGGAAUCAUGC- GGUUGGtt-39) and scramble siRNA, which were obtained from Ambion’s prede-signed siRNA database (Ambion, Inc., Austin, TX). NP460 cells were transfected with siRNA using LipofectamineTM 2000 (Invitrogen, Carlsbad, CA) according to the manufacture’s instruction. Forty-eight hours after transfection, the effect of gene-silencing was measured by qPCR and Western blot analysis. Scramble siRNA was used as a negative control.
Cell Cycle Analysis
RBMS3 and vector-transfected SUNE1 cells (16106) were cultured in RPMI medium containing 10% fetal bovine serum (FBS), while si-RBMS3 and si-scramble transfected NP460 cells were cultured in defined keratinocyte serum-free medium. Serum was withdrawn from culture medium when cells were 70% confluent. After 72 h, 10% FBS was added in the medium for an additional 12 h. Cells were fixed in 70% ethanol, stained with propidium iodide, and DNA content was analyzed using Cytomics FC (Beckman Coulter).
Immunohistochemistry (IHC)
Tumor sections (5mm thick) from primary NPCs or mouse
xenografts were used for immunohistochemical analysis. Briefly, paraffin-embedded sections were deparaffinized, blocked with goat serum, followed by incubation with mouse anti- RBMS3 (1:100) or anti-CD34 (1:100) overnight at 4uC. After incubation with horseradish peroxidase linked secondary antibody for 30 min, the sections were counterstained with Mayer’s hematoxylin. For RBMS3 staining, the scores were determined by the intensity of staining: positive staining (moderate and strong nuclear staining) and downregulation (absent and weak staining).
Microvessel Density Analysis
Tumor xenograft sections were stained for CD34, and four random medium-power fields (6200) were photographed for each
tumor. Vessels were counted by a blinded observer using standard criteria [52].
Immunofluorescence (IF)
RBMS3 and vector-transfected SUNE1 cells were grown on gelatin-coated cover slips, fixed with 4% paraformaldehyde, permeabilized in PBS, which contain 0.1% Triton-X 100, and blocked with 1% bovine serum albumin. The cells were then treated with antibodies targeting b-catenin (Cell Signaling Technology, Danvers, MA) at 4uC overnight. After washing with PBS, cells were incubated with FITC-conjugated anti-mouse secondary antibody and Texas red–conjugated anti-rabbit sec-ondary antibody at room temperature for 1 hour. Antifade 49, 6-diamidino-2-phenylindole (DAPI) solution was added, and images were captured.
Transferase-mediated dUTP Nick-end Labeling (TUNEL) Assay
RBMS3and vector-transfected SUNE1 cells were treated with straurosporine (STS; 1mM) for 2 hours. Morphological changes in the nuclear chromatin undergoing apoptosis were detected by terminal deoxynucleotidyl TUNEL assay according to the manufacturer’s protocol (Roche, Mannheim, Germany). Images were captured using a Leica DMRA fluorescence microscope (Rueil-Malmaison, France). Triplicate independent experiments were performed.
Mitochondrial Membrane Potential Assay
A MitoPTTM JC-1 Detection kit (Immunochemistry
Technol-ogies, Bloomington, MN) was used to detect the loss of mitochondrial membrane potential (DYm). Briefly, cells were
cultured on cover slips until 80% confluence was attained in a 6-well plate. Before and after STS treatment, cells were washed twice with phosphate-buffered saline (PBS) and incubated with the DYm-sensitive dyes JC-1 at 37uC for 15 min, and a fluorescence
microscope was used to capture the image with a Leica DMRA.
Cell Fractionation
Separation of nuclear and cytosolic fractions was performed using the NucBuster Protein Extraction kit (Novagen Inc, Madison, WI) according to the manufacturer’s instructions.
Western Blot Analysis
Western blot was performed according to the standard protocol with antibodies for cyclin D1,b-actin, E-cadherin, MMP7, and MMP9 (Santa Cruz Biotechnology, Santa Cruz, CA); p21, p27, cyclin E, p53 caspase-8, and caspase-9, (Cell Signaling Technol-ogy, Danvers, MA); and RBMS3 (Abnova, Taiwan).
Statistical Analysis
Statistical analysis was performed with the SPSS standard version 13.0. Results expressed as mean 6 SD were analyzed using Student’s t test. Differences were considered significant when P value was,0.05.
Author Contributions
References
1. Jeannel D, Bouvier G, Huber A (1999) Nasopharyngeal carcinoma: an epidemiological approach to carcinogenesis. Cancer Surv 33: 125–155. 2. Parkin DM, Bray F, Ferlay J, Pisani P (2005) Global cancer statistics, 2002. CA
Cancer J Clin 55: 74–108.
3. Vokes EE, Liebowitz DN, Weichselbaum RR (1997) Nasopharyngeal carcino-ma. Lancet 350: 1087–1091.
4. Yuan JM, Wang XL, Xiang YB, Gao YT, Ross RK, et al. (2000) Preserved foods in relation to risk of nasopharyngeal carcinoma in Shanghai, China. Int J Cancer 85: 358–363.
5. Liebowitz D (1994) Nasopharyngeal carcinoma: the Epstein-Barr virus association. Semin Oncol 21: 376–381.
6. Lo KW, Huang DP (2002) Genetic and epigenetic changes in nasopharyngeal carcinoma. Semin Cancer Biol 12: 451–462.
7. Henle G, Henle W (1976) Epstein-Barr virus-specific IgA serum antibodies as an outstanding feature of nasopharyngeal carcinoma. Int J Cancer 17: 1–7. 8. Kwong D, Lam A, Guan X, Law S, Tai A, et al. (2004) Chromosomal
aberrations in esophageal squamous cell carcinoma among Chinese: gain of 12p predicts poor prognosis after surgery. Hum Pathol 35: 309–316.
9. Hesson LB, Cooper WN, Latif F (2007) Evaluation of the 3p21.3 tumour-suppressor gene cluster. Oncogene 26: 7283–7301.
10. Qiu GH, Tan LK, Loh KS, Lim CY, Srivastava G, et al. (2004) The candidate tumor suppressor gene BLU, located at the commonly deleted region 3p21.3, is an E2F-regulated, stress-responsive gene and inactivated by both epigenetic and genetic mechanisms in nasopharyngeal carcinoma. Oncogene 23: 4793–4806. 11. Qin YR, Fu L, Sham PC, Kwong DL, Zhu CL, et al. (2008) Single-nucleotide
polymorphism-mass array reveals commonly deleted regions at 3p22 and 3p14.2 associate with poor clinical outcome in esophageal squamous cell carcinoma. Int J Cancer 123: 826–830.
12. Qiu GH, Salto-Tellez M, Ross JA, Yeo W, Cui Y, et al. (2008) The tumor suppressor gene DLEC1 is frequently silenced by DNA methylation in hepatocellular carcinoma and induces G1 arrest in cell cycle. J Hepatol 48: 433–441.
13. Fu L, Qin YR, Xie D, Hu L, Kwong DL, et al. (2007) Characterization of a novel tumor-suppressor gene PLC delta 1 at 3p22 in esophageal squamous cell carcinoma. Cancer Res 67: 10720–10726.
14. Hu XT, Zhang FB, Fan YC, Shu XS, Wong AH, et al. (2009) Phospholipase C delta 1 is a novel 3p22.3 tumor suppressor involved in cytoskeleton organization, with its epigenetic silencing correlated with high-stage gastric cancer. Oncogene 28: 2466–2475.
15. Penkov D, Ni R, Else C, Pinol-Roma S, Ramirez F, et al. (2000) Cloning of a human gene closely related to the genes coding for the c-myc single-strand binding proteins. Gene 243: 27–36.
16. Arvanitis C, Felsher DW (2006) Conditional transgenic models define how MYC initiates and maintains tumorigenesis. Semin Cancer Biol 16: 313–317. 17. Fan CS, Wong N, Leung SF, To KF, Lo KW, et al. (2000) Frequent c-myc and
Int-2 overrepresentations in nasopharyngeal carcinoma. Hum Pathol 31: 169– 178.
18. Hui AB, Lo KW, Teo PM, To KF, Huang DP (2002) Genome wide detection of oncogene amplifications in nasopharyngeal carcinoma by array based comparative genomic hybridization. Int J Oncol 20: 467–473.
19. Fritz D, Stefanovic B (2007) RNA-binding protein RBMS3 is expressed in activated hepatic stellate cells and liver fibrosis and increases expression of transcription factor Prx1. J Mol Biol 371: 585–595.
20. Wang XH, Sun X, Meng XW, Lv ZW, Du YJ, et al. (2010) beta-catenin siRNA regulation of apoptosis- and angiogenesis-related gene expression in hepatocel-lular carcinoma cells: potential uses for gene therapy. Oncol Rep 24: 1093–1099. 21. Carnero A, Hannon GJ (1998) The INK4 family of CDK inhibitors. Curr Top
Microbiol Immunol 227: 43–55.
22. Lu Z, Ghosh S, Wang Z, Hunter T (2003) Downregulation of caveolin-1 function by EGF leads to the loss of E-cadherin, increased transcriptional activity of beta-catenin, and enhanced tumor cell invasion. Cancer Cell 4: 499–515. 23. Sherr CJ, Roberts JM (1999) CDK inhibitors: positive and negative regulators of
G1-phase progression. Genes Dev 13: 1501–1512.
24. Hoshino I, Matsubara H, Akutsu Y, Nishimori T, Yoneyama Y, et al. (2007) Tumor suppressor Prdx1 is a prognostic factor in esophageal squamous cell carcinoma patients. Oncol Rep 18: 867–871.
25. Giorgio M, Trinei M, Migliaccio E, Pelicci PG (2007) Hydrogen peroxide: a metabolic by-product or a common mediator of ageing signals? Nat Rev Mol Cell Biol 8: 722–728.
26. Pellegrini M, Pacini S, Baldari CT (2005) p66SHC: the apoptotic side of Shc proteins. Apoptosis 10: 13–18.
27. Petronilli V, Costantini P, Scorrano L, Colonna R, Passamonti S, et al. (1994) The voltage sensor of the mitochondrial permeability transition pore is tuned by the oxidation-reduction state of vicinal thiols. Increase of the gating potential by oxidants and its reversal by reducing agents. J Biol Chem 269: 16638–16642.
28. Bernardi P, Petronilli V, Di Lisa F, Forte M (2001) A mitochondrial perspective on cell death. Trends Biochem Sci 26: 112–117.
29. Bouck N, Stellmach V, Hsu SC (1996) How tumors become angiogenic. In: VandeWoude GFKG, editor. Advances in Cancer Research, Vol 69. 135–174. 30. Mukhopadhyay D, Tsiokas L, Sukhatme VP (1995) Wild-type p53 and v-Src exert opposing influences on human vascular endothelial growth factor gene expression. Cancer Res 55: 6161–6165.
31. Rak J, Mitsuhashi Y, Bayko L, Filmus J, Shirasawa S, et al. (1995) Mutant ras oncogenes upregulate VEGF/VPF expression: implications for induction and inhibition of tumor angiogenesis. Cancer Res 55: 4575–4580.
32. Kraemer M, Tournaire R, Dejong V, Montreau N, Briane D, et al. (1999) Rat embryo fibroblasts transformed by c-Jun display highly metastatic and angiogenic activities in vivo and deregulate gene expression of both angiogenic and antiangiogenic factors. Cell Growth Differ 10: 193–200.
33. Marconcini L, Marchio S, Morbidelli L, Cartocci E, Albini A, et al. (1999) c-fos-induced growth factor/vascular endothelial growth factor D induces angiogen-esis in vivo and in vitro. Proc Natl Acad Sci U S A 96: 9671–9676. 34. Gnarra JR, Zhou S, Merrill MJ, Wagner JR, Krumm A, et al. (1996)
Post-transcriptional regulation of vascular endothelial growth factor mRNA by the product of the VHL tumor suppressor gene. Proc Natl Acad Sci U S A 93: 10589–10594.
35. Claudio PP, Stiegler P, Howard CM, Bellan C, Minimo C, et al. (2001) RB2/ p130 gene-enhanced expression down-regulates vascular endothelial growth factor expression and inhibits angiogenesis in vivo. Cancer Res 61: 462–468. 36. Ahn GO, Brown JM (2008) Matrix metalloproteinase-9 is required for tumor
vasculogenesis but not for angiogenesis: role of bone marrow-derived myelomonocytic cells. Cancer Cell 13: 193–205.
37. van Noort M, Meeldijk J, van der Zee R, Destree O, Clevers H (2002) Wnt signaling controls the phosphorylation status of beta-catenin. J Biol Chem 277: 17901–17905.
38. Iwai S, Yonekawa A, Harada C, Hamada M, Katagiri W, et al. (2010) Involvement of the Wnt-beta-catenin pathway in invasion and migration of oral squamous carcinoma cells. Int J Oncol 37: 1095–1103.
39. Taurin S, Sandbo N, Qin Y, Browning D, Dulin NO (2006) Phosphorylation of beta-catenin by cyclic AMP-dependent protein kinase. J Biol Chem 281: 9971– 9976.
40. Morrison JA, Gulley ML, Pathmanathan R, Raab-Traub N (2004) Differential signaling pathways are activated in the Epstein-Barr virus-associated malignan-cies nasopharyngeal carcinoma and Hodgkin lymphoma. Cancer Res 64: 5251– 5260.
41. Zeng ZY, Zhou YH, Zhang WL, Xiong W, Fan SQ, et al. (2007) Gene expression profiling of nasopharyngeal carcinoma reveals the abnormally regulated Wnt signaling pathway. Hum Pathol 38: 120–133.
42. Luo J, Xiao J, Tao Z, Li X (1997) Detection of c-myc gene expression in nasopharyngeal carcinoma by nonradioactive in situ hybridization and immunohistochemistry. Chin Med J (Engl) 110: 229–232.
43. Porter MJ, Field JK, Leung SF, Lo D, Lee JC, et al. (1994) The detection of the c-myc and ras oncogenes in nasopharyngeal carcinoma by immunohistochem-istry. Acta Otolaryngol 114: 105–109.
44. Fang YJ, Lu ZH, Wang GQ, Pan ZZ, Zhou ZW, et al. (2009) Elevated expressions of MMP7, TROP2, and survivin are associated with survival, disease recurrence, and liver metastasis of colon cancer. Int J Colorectal Dis 24: 875– 884.
45. Yue W, Sun Q, Landreneau R, Wu C, Siegfried JM, et al. (2009) Fibulin-5 suppresses lung cancer invasion by inhibiting matrix metalloproteinase-7 expression. Cancer Res 69: 6339–6346.
46. Li Y, Chen L, Nie CJ, Zeng TT, Liu H, et al. (2011) Downregulation of RBMS3 is associated with poor prognosis in esophageal squamous cell carcinoma. Cancer Res 71: 6106–6115.
47. Hui AB, Cheung ST, Fong Y, Lo KW, Huang DP (1998) Characterization of a new EBV-associated nasopharyngeal carcinoma cell line. Cancer Genet Cytogenet 101: 83–88.
48. Cheung ST, Huang DP, Hui AB, Lo KW, Ko CW, et al. (1999) Nasopharyngeal carcinoma cell line (C666–1) consistently harbouring Epstein-Barr virus. Int J Cancer 83: 121–126.
49. Sizhong Z, Xiukung G, Yi Z (1983) Cytogenetic studies on an epithelial cell line derived from poorly differentiated nasopharyngeal carcinoma. Int J Cancer 31: 587–590.
50. Li HM, Man C, Jin Y, Deng W, Yip YL, et al. (2006) Molecular and cytogenetic changes involved in the immortalization of nasopharyngeal epithelial cells by telomerase. Int J Cancer 119: 1567–1576.
51. Livak KJ, Schmittgen TD (2001) Analysis of relative gene expression data using real-time quantitative PCR and the 2(T)(-Delta Delta C) method. Methods 25: 402–408.