Vol-7, Special Issue-Number2-April, 2016, pp1442-1452 http://www.bipublication.com
Research Article
Assessment of qualitative potential of groundwater
using AHP and GIS
Hamad Baniasadi 1, and Mohsen Irandoust* 2
1MSc in Water Structure, Department of water engineering,
Kerman branch, Islamic Azad University, Kerman, Iran 2Assistant professor, Department of Water Engineering,
Kerman branch, Islamic Azad University, Kerman, Iran [email protected]*
ABSTRACT
In order to assess the groundwater quality status in Babak city (ShahreBabak) plain, the quality parameters were studied simultaneously in all extent of the aquifers. According to the simultaneous study of all factors affecting water quality, The Geographic Information System (GIS) can be used to analyze spatial data and raster maps can be made for changes in quality parameters and composition of these layers. In this study, after making variation maps for any qualitative parameter and classification of each map in GIS, by using the Analytic Hierarchy Process (AHP), in addition to determining the weight of each parameter, the weight of each class also was determined. The results show that according to Schoeller diagram drinking water is classified into four groups: good (1. 93 per cent), suitable (6.7 per cent), Unsuitable (71. 5 percent) and bad (19. 87 percent) and according to Wilcox diagram, agriculture water is classified into three groups: good (12. 3 percent), moderate (78. 9 percent) and Unsuitable (8.8 percent).
Keywords: qualitative zonation, spatial analysis, raster maps, AHP, GIS.
1- INTRODUCTION
The most important physical and chemical parameters of water are chloride, sodium, sulfate, total hardness, total dissolved solids and electrical conductivity.[3] Large withdrawals from aquifers causes negative balance and falling of water level and results in increased salinity and reduced water quality, and this issue makes it difficult to choose the right places to provide drinking and agriculture water. So to determine the appropriate limits for drinking and agricultural water, assessment of groundwater quality is required.[7] Assessment of the temporal trends of groundwater, for which the most important factor is the effect of charge and recharges time, can be investigated from comparison of changes in the quality and quantity of groundwater.[9] Therefore, the assumption of this study is to examine the qualitative and quantitative changes in groundwater in one plain and identify the
studied the sensitivity of Yazd-Ardakan plain to environmental pollution in GIS environments, the result shows that more than 98 percent of the area has drastic index between 47 to 92, so the vulnerability is in the low range and more than 1% of the study area is under negligible range and less than 1 percent in in the mid-range of pollution. Ramlingam and Santakumar (2002) studied proper artificial recharge areas in the a state in India by using GIS and remote sensing, data layers, such as geomorphology, geology, soil, slope, land use, runoff rate, depth of ground water were used in this study. Data Integration was performed in GIS environment and they concluded that the zonation created by GIS was acceptable for more than 90%. Lu Li et al (2005) used Analytic Hierarchy Process (AHP) to assess the vulnerability of ecosystem and the environment in the reservoir area of Denj Yang Kuo in China.[6]
2- METHODS AND MATERIALS
a. Introduction of the study area:
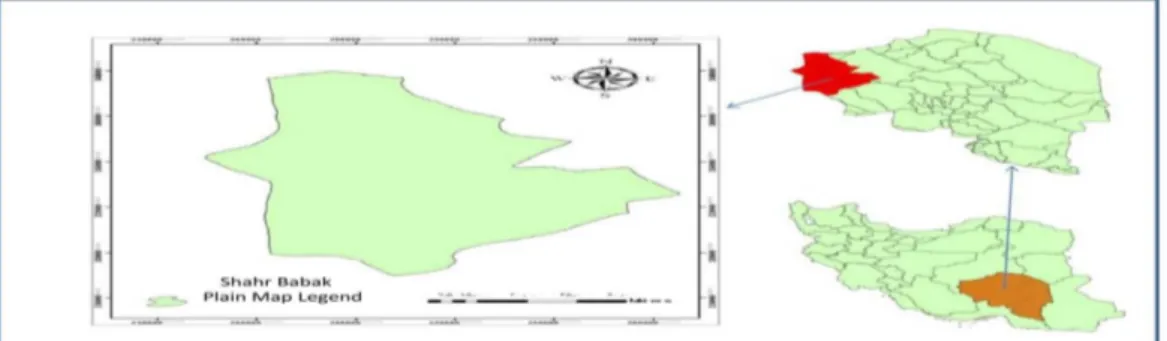
Shahre Babak-Khatoonabad basin with an area of 3197 square kilometers is divided into two sub-basins called ShahreBabak basin with an area 1935 square kilometers and Khatoonabad basin with an area of 1262 square kilometers. The area is located between 54° 45' and 55° 47' E longitudes and 29° 53' and 30° 33' N latitudes. This plain is located in the North West of Kerman Province in AbarghuSirjan basin and about 69 percent of it is an alluvial plain. The climate based on Do marten method is dry type. Babak plain has no constant surface water flow, and floods caused by rainfall, from the hillside to the plains middle zone, flows in the rivers to feed parts of groundwater. [5]
Figure 2-1ShahreBabak plain geographical location
b. The research method:
In this study, 52 wells were chosen randomly and with good distribution and were sent to the laboratory to determine water quality parameters such as electrical conductivity (EC), total dissolved solid (TDS).Then, in order to control the overall quality of the data by using reaction Error, error amounts of experimental data was examined. For making qualitative parameters maps which affecting the drinking water, the Arc GIS software was used, the best method was chosen to assess the spatial interpolation parameters and the type of groundwater was found by using Piper diagram. In this study, after making a qualitative variation map for any parameter and classification of each map in
include deterministic, probabilistic and fuzzy methods, that in this study fuzzy method and Schuler and Stokes diagram is used. Then, using Geographic Information System capabilities all hybrid maps and zonation carried out with consideration of the factors that affecting water quality and using this zonation we can specify the appropriate range for drinking and agriculture water. To check the quality of drinking water, Schuler diagrams has been prepared for
ShahreBabak plain groundwater samples, using RockWareAq.QA(1.1.1) software. And also to check the water quality in the study area for agriculture Wilcox diagram, presented in 1955, was used.[10]
3.RESULTS:
Results of groundwater samples analysis for ShahreBabak plain along with TDS and EC parameters are summarized in the table below;
Table 3-1 Analysis of samples.
To verify the results of the relationship between responses error, the error values for all samples are calculated.
Table 3-2 checking lab results
E.B% Name E.B% Name
E.B% Name
E.B% Name
0.42 W40
1.64 W27
0.34 W14
0.22 W1
0.5 W41 0.06 W28
0.35 W15
1.72 W2
0.2 W42 0.33 W29
0.62 W16
1.77 W3
0.6 W43 0.49 W30
0.43 W17
0.2 W4
1.27 W44
0.67 W31
0.29 W18
0.5 W5
1.66 W45
0.32 W32
1.22 W19
0.86 W6
0.33 W46
0.5 W33 1.48 W20
0.83 W7
0.82 W47
0.41 W34
0.6 W21 0.34 W8
0.27 W48
0.97 W35
0.58 W22
0.66 W9
0.62 W49
0.57 W36
0.17 W23
0.76 W10
0.68 W52
1.67 W37
1.82 W24
1.23 W11
0.16 W51
0.5 W38 1.55 W25
0.74 W12
0.86 W52
0.76 W39
0.97 W26
1.83 W13
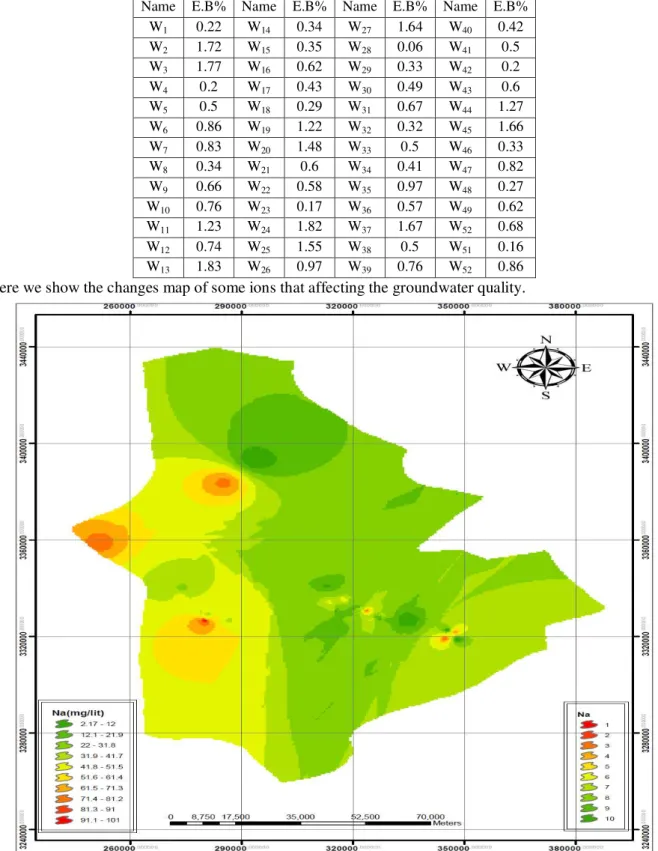
Here we show the changes map of some ions that affecting the groundwater quality.
Figure3-2 variation map in the concentration of soluble salts
Piper diagram was used to identify the type of water, as we can be seen in the figure below. Water type in this area is chloride sulfate and Schuler's diagram is drawn.
Piper Diagram 20% 20% 2 0% 40% 40% 4 0% 60%
60%
6 0% 80%
80%
8 0% Mg Ca 20% 20 % 20% 40% 40 % 40% 60% 60 % 60% 80% 8 0% 80% S O 4 Cl SO 4 + C
l C
a + M
g
N a +
K HCO
3 80% 80% 60% 60% 40% 4 0%
Schoeller Diagram
SO4 HCO3 Cl Mg Ca Na + K
m e q /k g 0.01 0.02 0.05 0.1 0.2 0.5 1 2 A A A A A A P P P P P P P P P P P P G G G G G G C C C C C C K K K K K K J J J J J J C C C C C C B B B B B B D D D D D D D D D D D D A A A A A A L L L L L L M M M M M M L L L L L L G G G G G G E E E E E E B B B B B B M M M M M M C C C C C C E E E E E E G G
G G G
G O O O O O O A A A A A A A A A A A A A A A A A A C C C C C C E E E E E E B B
B B B
B K K K K K K H H H H H H L L L L L L I I I I I I A A A A A A P P P P P P M M M M M M D D D D D D B B B B B B B B B B B B H H H
H H H
B
B
B
B B B
I I I I I I K K K K K K L L L L L L K K K K K K K K K K K K O O O O O O E E E E E E M M M M M M J J J J J J O O O O O O H H H H H H Legend A W1 P W2 P W3 G W4 C W5 K W6 J W7 C W8 B W9 D W10 D W11 A W12 L W13 MW14 L W15 G W16 E W17 B W18 MW19 C W20 E W21 G W22 O W23 A W24 A W25 A W26 26 More...
Figure 3-4 Schuler diagram
To determine significance coefficient (Weight) any amount, the Expert Choice 11 software is used to analyze the coefficients of the Analytic Hierarchy Process.
Table 3-3 Calculating coefficient of drinking water quality parameters affecting the AHP method
TH Cl So4 Na TDS
TH 1.00 0.33 0.20 0.14 0.11
Cl 3.00 1.00 0.33 0.20 0.14
So4 5.00 3.00 1.00 0.33 0.20
Na 7.00 5.00 3.00 1.00 0.33
TDS 9.00 7.00 5.00 3.00 1.00
Total 25.00 16.33 9.53 4.68 1.79
Table 3-4 Calculating coefficient of agriculture water quality parameters affecting the AHP method
SAR EC
SAR 1 0.5
EC 2 1
Total 3 1.5
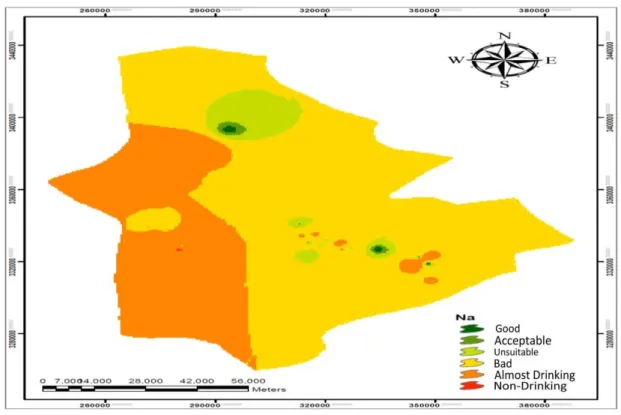
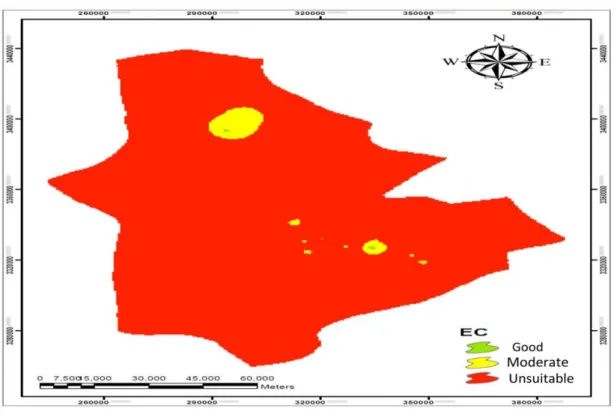
According to Schuler & Wilcox's classification, which have classified waters regarding their ability to be used for drinking and agriculture, zonation maps were drawn for various parameters
Figure 3-5 Na standardized maps based on the Schuler diagram
Figure 3-7 Map priority of drinking water supply
Figure 3-9SAR standardized maps based on the Wilcox diagram
3.CONCLUSION
According to Piper diagram water type of the area is chloride sulfate In this study, by entering the data in the GIS environment, quality and agriculture maps can be made with a high accuracy and speed. For this purpose the Arctoolbox in the Arc GIS 10 software was used. In this thesis, the AHP method was used, which is based on paired comparison and provides possibility for investigation of different scenarios and after the analysis done on data determined that In the drinking water, TDS parameter has a coefficient of 5/0, Sodium parameter has a coefficient of 26/0, sulfate parameter has a coefficient of 13/0, chlorine parameter has a coefficient of 07/0 and TH parameter has a coefficient of 030/ . Also in agricultural water EC parameter has a coefficient of 0/67 and SAR parameter has a coefficient of 0/33. In order to Drinking Water Quality potential finding, maps of the value of sodium, chloride, sulfate, TDS and TH was used. According to the Schoeller diagram, 1.93 percent of the plains have good quality, 6.7 percent of them have appropriate quality, and 71.5 percent have poor quality and 19.87 percent of the area has bad quality. Also for potential findingաgricultural water quality EC and SAR maps integration were used that according to Wilcox diagram 12.3 percent of the plains have good quality, 78.9 percent have quality and 8.8 percent have poor medium quality. Another finding of this study is the classification of territorial waters, which generally shows that most of the drinking water in the plains have inappropriate and bad quality and also for agricultural purposes, in most parts of the plain water have inappropriate quality.
4.SUGGESTIONS
Using the combination of fuzzy and AHP systems in order to potential finding and as a GIS model with Geographic Information System software with Model Builder can be used for the entire plains and its examining is suggested in further researches. In the study area pumping test to
calculate the hydrodynamic coefficients aquifer has not done. Therefore for further studies in this area pumping test is necessary. We also need to prevent uncontrolled exploitation of groundwater resources to have less advance salt water into the aquifer and to better understand of the study area, more piezometers are recommended. Also with the help of modern methods of agriculture we can partly reduce the risk of soil salinity. The use unusable ground water for drinking and agricultural purposes and leading to the desalination and technical and economic studies for reuse. Check other hydrogeological parameters in ShahreBabak plain groundwater potential finding like thickness of alluvium and isoplethic drop maps.Review of existing sites with agricultural lands and adapt their place on agricultural water analysis and provide solutions for the proper functioning or shift them. The effect of seasonal blackout of agricultural pump motor on east, west and south water quality and quantity in the study area. Provide solutions to change the crop pattern in different regions based on the evaluation of yield loss and the use of maps. Using schemes to prevent salty water intrusion into freshwater, such as the construction of underground dams in separating regions of central, eastern and southern parts and its effect on water quality and quantity.
REFERENCES
1. Ahmadi, A, Aberoomand, M, 1388. Study of Khash potential aquifer contamination, east of Iran, using GIS, Journal of Applied Geology, Volume 5, Number one, 11-1.
2. Entezari, A, Akbari, A, 1392. Check the quality of drinking water extracted from underground water sources on human disease in the past decades in Mashhad plain. Journal of Applied Research in Geographical Sciences Issue 31, Winter 92, 172-157.
groundwater, Islamic Azad University, Behbahan
4. Khodai, K, Shahsavari, A E, Etebari, B. 1385. Jovin aquifer vulnerability assessment by DRASTIC and GODS methods. Journal of the Iranian lands, Number 9 Spring 1385, 73-87.. 5. Rezai, M, Bemani Ahmad Abad, M,
AjdariMoghadam, M. 1386. Study of Yazd-Ardakan plain sensitivity to pollution in GIS. Applied Geology and Environment Conference, 15 March, EslamShahr, 21-27. 6. Sepand, S, 1386. The feasibility of artificial
recharge techniques in Lali region using GIS and RS. Master's thesis, University of Chamran, Ahvaz.
7. AtaiZade, S, Chitsazan, M, 1387. Feasibility artificial recharge techniques using GIS. Geomatics 87, 22 to 23 May, the national mapping agency of Tehran.
8. Keshavarz, E, KhasheiSiuki, A, Njafi, M H. 1392. Location of suitable drinking water extraction using fuzzy hierarchical analysis, Case study: Birjand aquifer. Journal of Water and Wastewater, No. 3.
9. Lu Li. Zhi-Hua Shi. Wei Yin. Dun Zhu. Sai Leung Ng. Chong-FaCai. A-Lin Lei. 2009. A fuzzy analytic hierarchy process (FAHP) approach to ec-environmental vulnerability assessment for the danjiangkou reservoir area. China, EcolojicalModelling 220,PP:3439-3447.