© 2013 Science Publications
doi:10.3844/jcssp.2013.1543.1555 Published Online 9 (11) 2013 (http://www.thescipub.com/jcs.toc)
Corresponding Author: S. Karpagam, Department of Information Technology, St. Michael College of Engineering and Technology, Kalayarkoil, TamilNadu, India
PREDICTION OF GLIOMA USING
GENETIC OPTIMIZED NEURAL NETWORK
1
S. Karpagam and
2S. Gowri
1
Department of Information Technology,
St. Michael College of Engineering and Technology, Kalayarkoil, TamilNadu, India 2
Director, Educational Multimedia Research Centre, Anna University, Chennai, Tamil Nadu, India
Received 2013-08-14, Revised 2013-09-30; Accepted 2013-10-01
ABSTRACT
Neural networks are a computational paradigm model of the human brain that has become popular in recent years. We have tried to address the problem of Glioma by creating a more accurate classifier which can act as an expert assistant to medical practitioners. Brain stem gliomas are now recognized as a heterogenous group of tumors. In this study proposed a prediction of Glioma in MR images using weight optimized neural network. Magnetic Resonance (MR) images are affected by rician noise which limits the accuracy of any quantitative measurements from the data. A recently proposed filter for rician noise removal is analyzed and adapted to reduce this noise in MR images. This parametric filter, named Non-Local Means (NLM), is highly dependent on setting its parameters. Experimental results reveal the efficacy of the adduced methodology as compared to the related work.
Keywords: Magnetic Resonance Imaging, Fuzzy C-Means Clustering, Gray-Level Co-occurrence Matrix, Feature Selection, Genetic Algorithm
1. INTRODUCTION
Magnetic Resonance Imaging (MRI) has been often the medical imaging method of choice when the soft tissue delineation is necessary. The most important advantage of MR imaging is non-invasive technique. Today, most medical institutions use the WHO classification system to identify brain tumors. It classifies brain tumors by cell origin and how the cells behave from the least aggressive (benign) to the most aggressive (malignant). Some tumor types are assigned a grade ranging from Grade I (least malignant) to Grade IV (most malignant) which signifies the rate of growth. There are variations in grading systems, depending on the tumor type. The classification and grade of an individual tumor help predict its likely behavior. This section 1 describes the most frequently diagnosed types. Glioma is a one type of primary brain tumor that starts in the brain or spine, secretarial for about 33% of these tumors. There are three main types of brain tumors.
These grades reflect the growth potential and aggressiveness of the tumor.
Astrocytomas: It can be low or high grade developed in the connective tissue. These do not have a clear boundary between the tumor and normal brain tissue.
Ependymomas: It develops from ependymal cells. Their job is to repair any damaged nerve tissue.
Oligodendrocytes: These develop in the supportive tissue cells of the brain called oliogendrocytes. Sometimes this tumor can spread within the central nervous system, in the fluid that circulates round the brain and spinal cord.
parameter optimization. The recently proposed nonlocal means algorithm offered remarkably promising results. Unlike previous denoise methods that rely on the local regularity assumption, the NLM exploits the spatial correlation in the entire image for noise removal. It can adjust each pixel value with a weighted average of other pixels whose neighborhood has a similar geometrical configuration. Since image pixels are highly correlated while noise is typically independently and identically distributed, averaging of these pixels results in noise cancellation and yields a pixel that is similar to its original value. The feature extraction of MR images is done with the consideration of moment invariant functions. They are several groups of moment invariants with respect to the more common degradations image scaling and rotation, image affine transforms, as well as image blurring was given in (Chen et al., 2012). There is a description about image classification based on moment invariants. Moreover, efficient numerical algorithms, used for moment computation and established some convenient examples for moment invariance in real-time applications. Then explained the construction methodologies of moment invariant functions which can be used to give distinctive brain images for accurate predictive classification of brain tumor. Each patch feature is clustered into K clusters using Fuzzy C-Means clustering. The main objective of fuzzy c-means algorithm is to minimize the objective function. This stage is defined as pre-Classification. The Noisy image is subjected to patch conversion and the patch features are classified to identify its neighboring patch. After identifying similar patches, the noisy patch is replaced with a weighted average of similarity window. For these kinds of noises, de-noising should be performed to improve the image quality for more accurate diagnosis. The main objective of image denoising techniques is to remove such noises while retaining as much as possible the important signal features. There are several methods for denoising slices, feature extraction can be extracted from Co-occurrence matrix, this study proposed a Gray Level Co-occurrence Matrix (GLCM) features are used to separate out normal slice from a slice affected by glioma. Feature selection is performed after the feature extraction. The objective of feature selection is to use parts of extracting as input to the classifier. In this study, the sequential forward selection algorithm is proposed along with the nearest neighbor to select the best feature. A set of feature which produces the highest classification rate is selected as selected feature. Finally proposed a classification neural
network based on genetic algorithm proposed in (Jadav and Panchal, 2012). It consists an extended investigation of the features of genetic algorithms in order to realize a high accurate classification neural network with a reduced number of neurons. In this study, a genetic algorithm is used to optimize the initial random weights that are provided to the Neural Network. Genetic algorithm used to produce a balanced classification every time when the program is executed. Therefore, the adduced work provides a framework for prediction of Glioma in MR image weight optimized neural network. The resultant images are obtained with more relevance and accuracy rate with its specific category.
The remainder of this study is structured as follows, Section 2 confers about the related work, Section 3 summarizes the proposed prediction of glioma in MR images using genetic neural network, Section 4 discussed the experiments and results achieved. Finally Section 5, presents the conclusion and future enhancements of the adduced work.
2. RELATED WORKS
Some of the notable research efforts have been made in previous research works. Most of the current conventional diagnostic techniques are based on human experience in interpreting the MRI-scan for judgment, certainly this increases the possibility of false detection and identification of the brain tumor. Moreover, applying digital image processing ensures the quick and precise detection of the tumor (Nagalkar and Asole, 2012). The authors (Wang et al., 2009) discuss about a classifying brain tumor in MR images. Moreover, it utilizes a combination of different techniques and is composed of several steps including segmentation, feature extraction and learning model. Even though, the proposed approach has described a 2D MR image, it can be easily extended to 3D MR volumes, since both the segmentation and feature extraction techniques have been successfully applied to 3D volumes. Following, the study (Dahab et al., 2012) a modified probabilistic neural network model that is based on learning vector quantization with image and data analysis and manipulation techniques is proposed to carry out an automated brain tumor classification using MRI-scan. Further, this study discussed about the noise enhancement algorithm is based on using spatial filters:
• Smoothing filters that are used to reduce or remove Gaussian noise from the MRI image
A new weight is derived for Non-Local Means (NLM) denoise, which exploits the joint nonlocal similarities between method noise and pre-denoised image is given in (Zhong et al., 2012). The similarities between noise free patches can be robustly measured with higher accuracy by using the new weight. Further, this study discussed about the two stages NLM scheme is implemented, it shows better denoising performance in the second stage and also the robustness with respect to different parameter in the first stage. The Non-Local Means (NLM) algorithm (Anupama et al., 2012) has offered remarkably promising results. Unlike previous denoise methods that rely on the local regularity assumption, the NL-means exploits spatial correlation in the entire image for noise removal. It adjusts each pixel value with a weighted average of other pixels whose neighborhood has a similar geometrical configuration. Since image pixels are highly correlated while noise is typically independently and identically distributed, averaging of these pixels results in noise cancellation and yields a pixel that is similar to its original value. Park and Kang (2010), NLM filter approaches have many improvements regarding its weight function and parameter optimization. However, those improvements have not removed artifacts such as the false texture pattern, which occurs when the smoothing parameter in the weight function is small. Boulanger et al. (2010) proposed a nonparametric regression method for denoising 3-D image sequences acquired via fluorescence microscopy. Redundancy of the 3-D time information to improve the signal-to-noise ratio of images corrupted by the Poisson-Gaussian noise. A patch-based function demonstrates the fixed-point solution, which yields an image patche taken in a spatially varying neighborhood. Neural Network based brain tumor detection was proposed in (Kadam et al., 2011). Both hardware and software approach is projected on this study. The interdependency of two approaches certainly makes precise detection of maligns cells. Moreover, it presents a prototype system to evaluate the performance of the proposed methods, comparing detection accuracy and robustness with 3D visualization. A neural network classification based noise identification method is presented by isolating some representative noise samples and extracting their statistical features for noise type identification was given in (Tiwari et al., 2011). The isolation of representative noise samples is achieved using prevalent used image filters whereas noise identification is performed using statistical moments features based classification system. Other supervised classification techniques, such as k-Nearest Neighbor (k-NN) (Rajini and Bhavani, 2011) can be
used to classify the normal or pathological T1 and T2-weighted MRI images. In this study, the proposed method used supervised machine learning algorithms (FP-ANN and k-NN) to obtain the classification of images under two categories, either normal or a pathological brain. Semantic association rules (Kharat et al., 2012) were used to produce high-level concepts, which were extracted from visual content. The approach forwarded a modality for learning the medical image diagnosis using low-level features. Association rule mining reveals all the consuming relationships in a conceivably large image database. A framework formed by the combination of associative rule mining and classification rule mining in medical image diagnosis called neural network association classification system (Tech and Korrapati, 2010). The various types of moments are complex moment, geometric moment and moment-based invariants with respect to various image degradations and distortions, which can be used as shape descriptors for classification. Anitha et al. (2012), proposed a segmentation models for automated detection of white matter change of brain. In addition to Fuzzy c-means Clustering,Geostatistical Fuzzy c-means Clustering is used for detecting (white matter lesions) WML in brains. Feng et al. (2010) discusses about a spatial FCM that incorporates the spatial information into the membership function to improve the segmentation results. The membership functions of the neighbors centered on a pixel in the spatial domain are enumerated to obtain the cluster distribution statistics. These statistics are transformed into a weighting function and incorporated into the membership function. Cui et al. (2013), proposed an adaptive spatial FCM segmentation algorithm, which portrays in local spatial continuity constraint image. The algorithm employs a novel divergence index that considers the local influence of neighboring pixels in an adaptive manner.
3. PROPOSED WORK
best optimal selection for MR magnitude image denoise. The overview of the proposed work is revealed in Fig. 1.
Noise in MR images obeys a Rician distribution. In contrast to Gaussian additive noise, Rician noise is image dependent and is therefore more difficult to separate from the image. MR images are corrupted by Rician noise, which arises from complex Gaussian noise in the original frequency domain measurements. The Rician probability density function for the corrupted image intensity xis given by Equation (1):
( )
2 2 2 2 0 A2x x + A x
p x = exp exp - I
σ 2σ σ
(1)
Where:
A = The underlying true intensity σ = The standard deviation of the noise I0 = The modified zeroth order
The Glioma image enumerated by rician noise and is subjected to pre-filtration which is then decomposed into image patches.
Filters are used to remove noise from an image by making a determination of a more accurate version of pixels. By taking neighboring pixels into consideration, extreme noisy pixels can be filtered out. Unfortunately, extreme pixels can also represent original fine details. The averaging filtering technique can successfully remove noise from the distorted image but in this case the filtered image suffers the blurring effect. For the mean filtering techniques each pixel is considered to calculate the mean and also every pixel is replaced by that calculated mean. So affected pixels are considered to calculate the mean and unaffected pixels are also replaced by this calculated mean.
In this study, the non-local means algorithm was proposed can successfully remove the image noise at the same time and save the image in complete boundary information. Sequentially, to protect the image of superior structure and specifys the information, and protected images are not to be destroyed. NLM makes use of similar patterns occurring in different parts of any image and use these similarities to denoise an image assuming that the corrupting noise is uncorrelated. The NLM algorithm is a weighted averaging process, where the similarity of regions determines the amount of contribution of a particular region to the denoise mechanism for a region of interest:
i ij i i ij
j l j
i
1
X = w y where C = w
C ˆP
∈
∑
∑
(2)( )
( )
2i j µ
ij e 2
k
|| N X - N X ||
w = - (3)
where, Ci act as a normalizing constant. The index j runs over the entire image and i, basically denotes for each pixel. In addition, the weights are intended with respect to all pixels in the image. The weights are calculated by matching neighborhoods (patches) and searching for pixels which have similar neighborhoods to the one under consideration. This process is done by calculating weights for each pair of pixels.
N (xi) is the vectorized version of a patch centered at location xi and k is a global smoothing parameter which controls the amount of blurring introduced in the denoise process. For higher values of noise present in an image this constant is set to be larger. The parameter is the variance of a normal distribution which is used to smooth out the neighborhood while calculating the weights. This has the effect of reducing the influence of difference in pixel intensities as they go spatially further away from the center of the patch being considered.
The NLM process gives rise to the method of weighted average filtering which calculates the contributing weights making use of Equation (3). This weight calculation mechanism effectively sort out dissimilar patches and does not consider them in the denoising process. The final restoration process consists of these weights to determine the ratio which the central pixels of the patches contribute to estimate the denoised intensity of the central pixel of the patch under consideration, as expressed by Equation (2).
The feature extraction of MR image is done with the consideration of moment invariant functions. Hence, we provide a moment invariant mechanism in feature extraction. Both input and output images are considered, it changes tends to differ between those circumstances. Although, the generalized moment invariant is extracted from the patches. Accordingly moment invariant is applied to intensity changes, contrast images, convolution and rotational images.
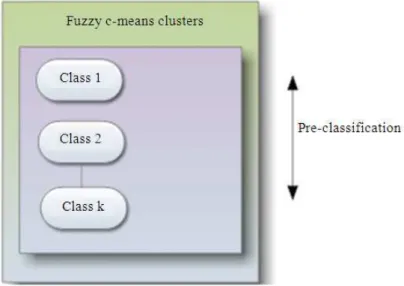
Each patch feature is clustered into K clusters using Fuzzy C-Means clustering.
Fig. 2. Fuzzy c-means cluster This study proposes an algorithm, namely FCM which is
often used as a clustering algorithm and the Fig. 2 shows the fuzzy c-means clustering. Image clustering and categorization is a means for high-level description of image content. The goal is to find a mapping of the archive images into classes (clusters) such that the set of classes provides essentially the same information about the image archive as the entire image-set collection. The generated classes provide a concise summarization and visualization of the image content that can be used for different tasks related to image database management.
Fuzzy C-Means (FCM) clustering is an unsupervised method derived from fuzzy logic that is suitable for solving multiclass and ambiguous clustering problems. It works by assigning membership to each data point corresponding to each cluster center on the basis of distance between the cluster center and the data point. More the data is near to the cluster center more is its membership towards the particular cluster center. Obviously, summation of the membership of each data point should be equal to one. An image can be represented in various feature spaces and the FCM algorithm classifies the patch features by grouping similar data points in the feature space into clusters. This clustering is achieved by iteratively minimizing a cost function that is dependent on the distance of the pixels to the cluster centers in the feature domain, as expressed by Equation 4:
(
)
n a( )
v2
ij i j
i 1 j 1
k m, n = ||x - n ||
= =
∑∑
(4)There are numerous applications of FCM in virtually every major application area of clustering. The main objective of fuzzy c-means algorithm is to minimize the objective function. This stage is defined as pre-Classification.
To identify similar patches, the Noisy image is subjected to patch conversion and the patch features are classified to identify its neighboring patch. As the classified patch falls into any one of the clusters, the necessity to find the most correlated patch creeps in. So, correlation measure is computed to determine the most relevant patch and it is exposed to the weighted average of similarity computation.
After identifying similar patches, the noisy patch is replaced with a weighted average of similarity window. This replacement is done for all the noisy patches and finally the patches are merged to view it as a complete denoise image.
For these kinds of noises, de-noising should be performed to improve the image quality for more accurate diagnosis. The main objective of image denoising techniques is to remove such noises while retaining as much as possible the important signal features.
the dataset and statistical features are calculated from the matrix. These values are framed as a feature matrix. As this feature matrix is of larger dimension to be projected in the feature space, a dimension reduction algorithm was implemented to project the features in a lower dimensional space.
In this proposed work, Gray Level Co-occurrence Matrix (GLCM) features are used to separate out normal slice from a slice affected by glioma. GLCM is The Gray-Level Co-occurrence Matrix (GLCM), also known as the gray-level spatial dependence matrix.
GLCM is the statistical method of examining the textures that considers the spatial relationship of the pixels. The GLCM function characterizes the texture of an image by calculating often pairs of pixel with specific values and in a specific spatial relationship occur in an image, creating a GLCM and then extracting statistical measures from this matrix. The graycomatrix function in MATLAB creates a Gray-Level Co-occurrence Matrix (GLCM) by calculating how often a pixel with the intensity value i occurs in a specific spatial relationship to a specific pixel with the value j. By default, the spatial relationship is defined as the pixel to its immediate right. Each element (i, j) in the resultant GLCM is simply the number of times that the pixel with the value i occurred in the specified spatial relationship to a pixel with value j in the input image.
Given an image K, of size N×N, the Co-occurrence, matrix F can be defined as Equation 5:
( )
N N( )
(
)
x y
x 1 y 1
1,if K x, y = i and K x + , y + = j
F i, j =
0,otherwise = = ∆ ∆
∑∑
(5)Here, the offset x, y, is specifying the distance between the pixel-of-interest and its neighbors. The offset x, y parameterization makes the Co-occurrence matrix sensitive to rotation.
Feature selection is performed after the feature extraction. The objective of feature selection is to use parts of extracted as input to the classifier.
Feature selection, the process of removing irrelevant features can be extremely useful in reducing the dimensionality of the data to be processed, in reducing execution time and improving predictive accuracy of the classifier. Selecting the right set of features for classification is one of the most important problems in designing a good classifier. It needed to perform filtering extracted features and find the group of features which can get the best classification performance. It may be
defined as the process of searching an optimum subset solution from a large dataset according to an evaluation measure. A combined classification based feature selection namely sequential forward feature selection based on k-Nearest Neighbor classification was used to acquire low dimension feature set. In this study, the sequential forward selection algorithm proposed along with the nearest neighbor to select the best feature. A set of features which produces the highest classification rate is selected as selected feature.
The Sequential Forward Selection algorithm (SFS) calculated feature selected matrix is used to train the neural network.
In K-NN classifier algorithm, significant difference between tissue types, observed in variability of textural measurements in MR image, is used for this classification. The various measurements based on statistical and Co occurrence matrix textural features from the MR images are given as input to the classifiers for training. The features of new slices are given as input, the trained classifier can able to classify it.
One of the simplest classification techniques is the k-Nearest Neighbor classifier. Classification of an input feature vector X is done by determining the k closest training vectors according to a suitable distance metric. The KNN algorithm is based on a distance function and a voting function in k nearest neighbors, a metric employed is the Euclidean distance. The k-NN algorithm consists of a training phase and a testing phase. During the training phase, the data points are given in a n-dimensional space. These training data points have labels associated with them that designate their class. In testing phase, an unlabeled data are specified and the algorithm creates the list of the k nearest (already classified) data points in the unlabeled equation 6:
( )
k( )
jix =1,aji=a
1 v a =
d c ,c
∑
(6)The Genetic Algorithm (GA) approach to feature selection constitutes a different way for feature, since it allows a randomized search guided by fitness measure. In this proposed work, Genetic algorithm is used to optimize the initial random weights that are provided to the Neural Network. Genetic algorithm used to produce a balanced classification every time when the program is executed. Genetic Algorithm maintains a population of competing feature transformation matrix. To estimate each matrix in the population, and need to multiply the input patterns by matrix. Hence, producing a set of transforming patterns, which are sent to a classifier. The classifier typically divides the patterns in a training set, used to train the classifier and a testing set used to evaluate classification accuracy. The accuracy obtained is then returned to the GA as a measure of the quality of the transformation matrix used to obtain the set of transforming patterns. Using this information, GA searches a transformation that minimizes the dimensionality of the transformed patterns and maximizing classification accuracy. Initial populations in the genetic process are randomly created. GA uses three operators to generate a next generation from the recent generation namely, selection, crossover and mutation. GA eliminates the chromosomes of low fitness and keeps the ones of higher fitness.
The three basic operators of genetic algorithms are: selection, crossover and mutation.
In selection techniques, selection of some individuals with stronger adaptability is performed from the population according to the fitness and then the decision of copy number of individual is taken according to the selection methods such as Backer Stochastic Universal Sampling.
It exchanges and recombines a pair of chromosome through crossover. Mutation is done to change certain point state via probability. In general, one needs to choose suitable crossover and mutation probability time and again via real problems.
In neural network classifier, the feature vector matrix is formed by calculating feature values from all the images. The neural network making use of optimized weights from GA, bias and with the help of pre-defined neurons learns the particular features with the true labels. In this proposed work, we need to train our network using Levenberg Marquardt back propagation training algorithm.
In Back-Propagation feed-forward Neural Network model (BPN), processing nodes makes up a set of fully interconnected layers, except that there are no interconnections between nodes within the same layer. A successful pattern classification methodology
depends heavily on the particular choice of the features used by the classifier. The feed forward neural network refers to the network consisting of a set of sensory units that constitute the input layer, one or more layers of computation nodes and output layer of computation nodes. Input signal propagates through the network in a forward direction from left to right and layer-by-layer basis.
The BPN provides a computationally efficient method for changing the weights in a feed forward network with differentiable activation function units to learn a training set of input, output data. Then being a gradient method it minimizes the total squared error of the output computed from the network. Hence, balaned network are used for training and to provide better response to the input, which are similar. In proposed work, the number of hidden neurons is set to 5.
If the BP network’s total mean squared error is larger than the expected error, the weights and thresholds will be updated, or else preserving the initial value of BP network training. The GA function requires a function to handle as an input argument to which it passes a 1xN vector, where N is the number of variables in the system to be optimized. In a neural network, the weights and biases are a Mx1 vector. These may be optimized using GA. A function can be written to accept the network, weights and biases, inputs and targets. This function may return the mean squared error based on the outputs and the targets as GA requires a function to handle that only returns a scalar value. Thus the optimized neural network classifies the given input slice as normal or glioma.
4. EXPERIMENTAL RESULTS
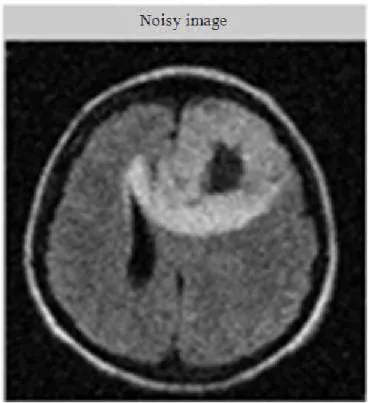
The proposed method is a very promising algorithm for removing noise from MR image. To test this method we took a Magnetic Resonance Imaging (MRI) image of the human brain. The human brain MRI suffers from rician noise. Figure 3 shows the noisy MRI image.
Fig. 3. Noisy MRI image of human brain
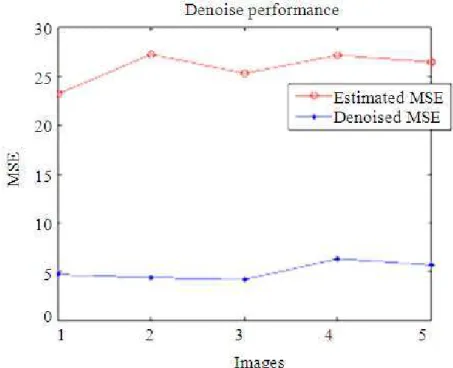
Fig. 5. Performance of filter based on MSE
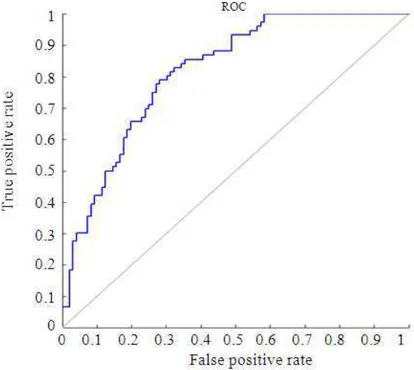
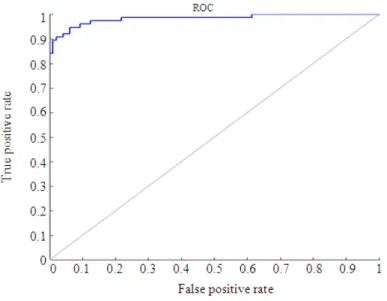
Fig. 7. ROC Graph-NN classification without genetic algorithm
Fig. 9. ROC Graph-NN classification with genetic algorithm In this proposed work, the denoised images provide
lowest MSE than the estimated value proves the efficiency of the proposal:
( ) ( )
(
)
A B 2
i =1 j=1
1
MSE = x i, j - y i, j
AB
∑∑
Figure 6 shows the confusion matrix for the results obtained with NN classification. The confusion matrix is determined between target class and output class. The diagonal values represent the appropriate classification results and the final diagonal value shows the accuracy rate of the classification. The rest of confusion matrix exhibits the misclassification results.
Figure 7 shows the Receiver operating characteristic curve graph for NN classification. In order to predict the accuracy rate diagnosis, the graph is plotted between true positive rate and false positive rate. As we mentioned, the AUC varies from 0 to 1. We have analyzed the performance of neural network classification without genetic algorithm. Subsequently, the neural network classification is performed to classify the brain images by the selected features.
The curve plotted against the correlation between false positive and true positive rate. On comparing the results of two classification systems, the more accuracy rate is obtained by the latter classification. The efficacy rate of the classification approach is persistent via less MSE and higher accuracy rate in accordance with reduced time consumption. Therefore on analyzing the
results, it is obvious that neural network classification with genetic algorithm method affords factual classification results were shown in Fig. 8.
The ROC is determined as a comparison of the true positive rate versus false positive rate. The ROC analysis gives the receiver operating characteristic for each output class. The ROC for the NN classification (with genetic algorithm) for training, validation and test data is specified in Fig. 9.
5. CONCLUSION
This study is to suggest a congruous method for an effective denoise image that assists medical image diagnosis in the clinical domain. In this work, we proposed a classification of MR image using the genetic optimized neural network, imposed with sequential forward selection and k-NN classifier. This study presents a simple and efficient technique to remove noise from the medical image which combines NLM filtering to determine the pixel value in the noiseless image. The experimental results are analyzed using image quality metrics Mean Square Error (MSE), while comparing the results of two classification systems, the more accuracy rate is obtained by the latter classification. Hence, this study suggests that genetic algorithm based neural network classification system affords better decision making in discriminating brain tumors and accuracy changing.
attention. Improving the 3D volume rendering on the segmented tumor region is important for accurate resulting images. Three-dimensional volume rendering is useful in a wide variety of applications but is just now being incorporated into commercially available software packages for medical imaging.
6. REFERENCES
Anitha, M., P.T. Selvy and V. Palanisamy, 2012. WML detection of brain images using fuzzy and possibilistic approach in feature space. WSEAS Trans. Comput., 11: 2224-2872.
Anupama, P., S.P. Kumar, B. Sudharshan and N. Pradhan, 2012. A review of different image denoising methods. Int. J. Innov. Res. Dev., 1: 533-545.
Boulanger, J., C. Kervrann, P. Bouthemy, P. Elbau and J.B. Sibarita et al., 2010. Patch-based nonlocal functional for denoising fluorescence microscopy image sequences. IEEE Trans. Med. Imag., 29: 442-454. DOI: 10.1109/TMI.2009.2033991
Chen, B.J., H.Z. Shu, H. Zhang, G. Chen and C. Toumoulin et al., 2012. Quaternion Zernike moments and their invariants for color image analysis and object recognition. Signal Process., 92: 308-318. DOI: 10.1016/j.sigpro.2011.07.018 Cui, W., Y. Wang, Y. Fan, Y. Feng and T. Lei, 2013.
Localized FCM clustering with spatial information for medical image segmentation and bias field estimation. Int. J. Biomed. Imag. DOI: 10.1155/2013/930301
Dahab, D.A., S.S.A. Ghoniemy and G.M. Selim, 2012. Automated brain tumor detection and identification using image processing and probabilistic neural network techniques. Int. J. Comp. Image Process. Visual Commun., 1: 1-8.
Feng, Z., S. Yuqing and C. Jianme, 2010. Fuzzy c-means clustering for image segmentation using the adaptive spatially median neighborhood information. Proceedings of the Chinese Conference on Pattern Recognition (CCPR), Oct. 21-23, IEEE Xplore
Press, Chongqing, pp: 1-5. DOI:
10.1109/CCPR.2010.5659305
Jadav, K. and M. Panchal, 2012. Optimizing weights of artificial neural networks using genetic algorithms. Int. J. Adv. Res. Comput. Sci. Electr. Eng., 1: 47-51. Kadam, D.B., S.S. Gade, M.D. Uplane and R.K. Prasad, 2011. Neural network based brain tumor detection using MR images. Int. J. Comp. Sci. Commun., 2: 325-231.
Kharat, K.D., P.P. Kulkarni and M.B. Nagori, 2012. Brain tumor classification using neural network based methods. Int. J. Comput. Sci. Inform., 1: 85-90.
Nagalkar, V.J. and S.S. Asole, 2012. Brain tumor detection using digital image processing based on soft computing. J. Signal Image Process., 3: 102-105.
Park, S.W. and M.G. Kang, 2010. NLM algorithm with weight update. Elect. Lett., 46: 1061-1063. DOI: 10.1049/el.2010.0659
Rajini, N.H. and R. Bhavani, 2011. Classification of MRI brain images using k-nearest neighbor and artificial neural network. Proceedings of the International Conference on Recent Trends in Information Technology (ICRTIT), Jun. 3-5, IEEE Xplore Press, Chennai, Tamil Nadu, pp: 563-568. DOI: 10.1109/ICRTIT.2011.5972341
Tech, K.V.R.M. and R.B. Korrapati, 2010. Neural network based classification and diagnosis of brain hemorrhages. Int. J. Artif. Intell. Expert Syst., 1: 7-25.
Tiwari, S., A.K. Singh and V. Shukla, 2011. Statistical moments based noise classification using feed forward back propagation neural network. Int. J. Comput. Appli., 18: 36-40.
Wang, Q., E.K. Liacouras, E. Miranda, U. S. Kanamalla and V. Megalooikonomou, 2009. Classification of Brain Tumors in MR images.